Analysis Summary
Notes:
- 1) No attempt has been made to eliminate the non-significant decimal places.
- 2) This batgrbproduct analysis is done using the HEASARC data.
- 3) This batgrbproduct analysis is using the flight position for the mask-weighting calculation.
======================================================================
BAT GRB EVENT DATA PROCESSING REPORT
Process Script Ver: batgrbproduct v2.46
Process Start Time: Sun Jan 19 16:01:53 EST 2014
Host Name: batevent1
Current Working Dir: /local/data/batevent/batevent_reproc/trigger354299
======================================================================
Trigger: 00354299 Segment: 000
BAT Trigger Time: 266045422.208 [s; MET]
Trigger Stop: 266045422.72 [s; MET]
UTC: 2009-06-07T05:30:17.401940 [includes UTCF correction]
Where From?: TDRSS position message
BAT
RA: 191.208949448038 Dec: 44.1296441879312 [deg; J2000]
Catalogged Source?: NO
Point Source?: YES
GRB Indicated?: YES [ by BAT flight software ]
Image S/N Ratio: 6.44
Image Trigger?: NO
Rate S/N Ratio: 18.8679622641132 [ if not an image trigger ]
Image S/N Ratio: 6.44
Analysis Position: [ source = BAT ]
RA: 191.208949448038 Dec: 44.1296441879312 [deg; J2000]
Refined Position: [ source = BAT pre-slew burst ]
RA: 191.191333937601 Dec: 44.1063123603798 [deg; J2000]
{ 12h 44m 45.9s , +44d 06' 22.7" }
+/- 1.86012914186531 [arcmin] (estimated 90% radius based on SNR)
+/- 1.01652124380591 [arcmin] (formal 1-sigma fit error)
SNR: 12.5330511824791
Angular difference between the analysis and refined position is 1.592323 arcmin
Partial Coding Fraction: 0.96875 [ including projection effects ]
Duration
T90: 2.29200002551079 +/- 0.127121992145015
Measured from: 0.0839999914169312
to: 2.37600001692772 [s; relative to TRIGTIME]
T50: 1.84799998998642 +/- 0.277185829902444
Measured from: 0.280000001192093
to: 2.12799999117851 [s; relative to TRIGTIME]
Fluence
Peak Flux (peak 1 second)
Measured from: -0.00999999046325684
to: 0.990000009536743 [s; relative to TRIGTIME]
Total Fluence
Measured from: 0.0600000023841858
to: 2.48800000548363 [s; relative to TRIGTIME]
Band 1 Band 2 Band 3 Band 4
15-25 25-50 50-100 100-350 keV
Total 0.046217 0.054435 0.051471 0.018064
0.007769 0.008198 0.007523 0.006722 [error]
Peak 0.028772 0.021631 0.030817 0.009615
0.005080 0.005306 0.005070 0.004499 [error]
[ fluence units of on-axis counts / fully illuminated detector ]
======================================================================
====== Table of the duration information =============================
Value tstart tstop
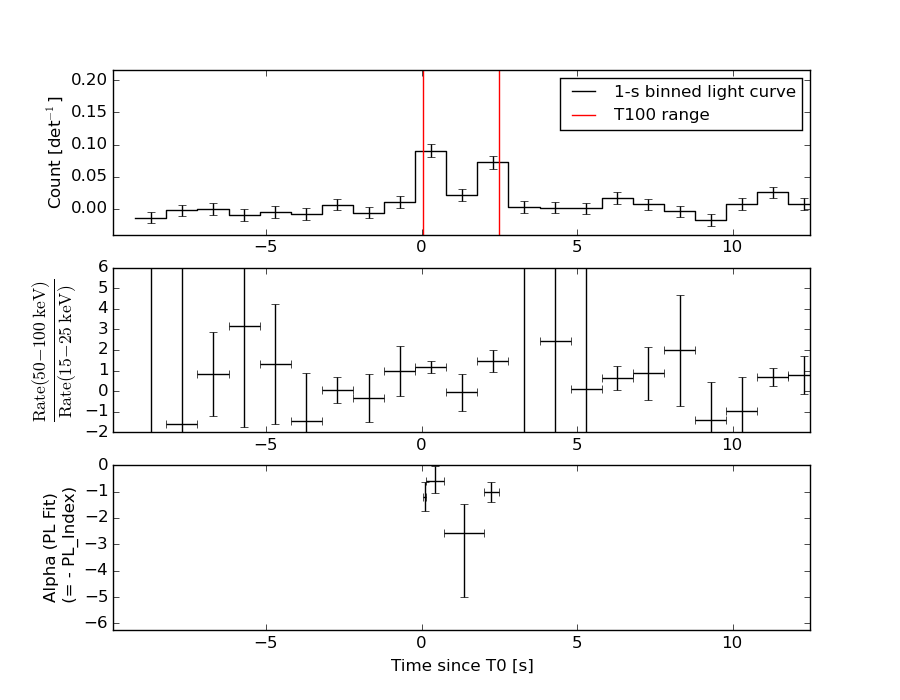
T100 2.428 0.060 2.488
T90 2.292 0.084 2.376
T50 1.848 0.280 2.128
Peak 1.000 -0.010 0.990
====== Spectral Analysis Summary =====================================
Model : spectral model: simple power-law (PL) and cutoff power-law (CPL)
Ph_index : photon index: E^{Ph_index}
Ph_90err : 90% error of the photon index
Epeak : Epeak in keV
Epeak_90err: 90% error of Epeak
Norm : normalization at 50 keV in both the PL model and CPL model
Nomr_90err : 90% error of the normalization
chi2 : Chi-Squared
dof : degree of freedo
=== Time-averaged spectral analysis ===
(Best model with acceptable fit: N/A)
Model Ph_index Ph_90err_low Ph_90err_hi Epeak Epeak_90err_low Epeak_90err_hi Norm Nomr_90err_low Norm_90err_hi chi2 dof
PL -1.155 -0.294 0.303 - - - 4.58e-03 -6.55e-04 6.55e-04 71.540 57
CPL -1.178 -0.271 0.281 9999.360 -9999.360 -9999.360 4.60e-03 N/A N/A 71.600 56
=== 1-s peak spectral analysis ===
(Best model with acceptable fit: PL)
Model Ph_index Ph_90err_low Ph_90err_hi Epeak Epeak_90err_low Epeak_90err_hi Norm Nomr_90err_low Norm_90err_hi chi2 dof
PL -1.135 -0.413 0.425 - - - 5.73e-03 -1.05e-03 1.05e-03 69.430 57
CPL -1.181 -0.369 0.482 9999.360 -9999.360 -9999.360 5.75e-03 -1.04e-03 -5.75e-03 69.500 56
=== Fluence/Peak Flux Summary ===
Model Band1 Band2 Band3 Band4 Band5 Total
15-25 25-50 50-100 100-350 15-150 15-350 keV
Fluence PL 1.03e-08 2.34e-08 4.20e-08 1.78e-07 1.14e-07 2.54e-07 erg/cm2
90%_error_low -3.05e-09 -4.12e-09 -7.71e-09 -6.71e-08 -1.90e-08 -7.23e-08 erg/cm2
90%_error_hi 3.33e-09 3.93e-09 7.44e-09 9.35e-08 1.92e-08 9.56e-08 erg/cm2
Peak flux PL 1.66e-01 2.08e-01 1.90e-01 3.01e-01 6.67e-01 8.64e-01 ph/cm2/s
90%_error_low -6.62e-02 -5.08e-02 -4.52e-02 -1.40e-01 -1.26e-01 -1.75e-01 ph/cm2/s
90%_error_hi 7.59e-02 4.67e-02 4.21e-02 2.08e-01 1.26e-01 1.93e-01 ph/cm2/s
Fluence CPL 1.03e-08 2.34e-08 3.97e-08 1.83e-07 1.14e-07 2.45e-07 erg/cm2
90%_error_low N/A -4.13e-09 N/A -1.03e-07 N/A -7.40e-08 erg/cm2
90%_error_hi N/A 3.92e-09 N/A 1.11e-07 N/A 7.42e-08 erg/cm2
Peak flux CPL 1.36e-01 9.87e-02 4.87e-02 4.16e-02 2.99e-01 3.24e-01 ph/cm2/s
90%_error_low -1.36e-01 -9.87e-02 -4.87e-02 -4.16e-02 -2.99e-01 -1.98e-01 ph/cm2/s
90%_error_hi 8.79e-02 6.30e-02 -1.90e-03 2.19e-02 1.95e-01 2.11e-01 ph/cm2/s
======================================================================
Image
Pre-slew 15.0-350.0 keV image (Event data)
#   RAcent    DECcent   POSerr    Theta     Phi              Peak Cts       SNR   Name
  191.1913    44.1063   0.0153    19.9310    -6.7939         0.1831166     12.533 TRIG_00354299

Foreground time interval of the image:
  0.060   2.488 (delta_t =   2.428 [sec])
Background time interval of the image:
-60.208   0.060 (delta_t =  60.268 [sec])
Light Curves
Note: The mask-weighted lightcurves have units of either count/det or counts/sec/det, where a det is 0.4 x 0.4 = 0.16 sq cm.
Full-time range; 1 s binning
Other quick-look light curves:
- 64 ms binning (zoomed)
- 16 ms binning (zoomed)
- 8 ms binning (zoomed)
- 2 ms binning (zoomed)
- SN=5 or 10 s binning (full-time range)
- Raw light curve
Spectra
- 64 ms binning (zoomed)
- 16 ms binning (zoomed)
- 8 ms binning (zoomed)
- 2 ms binning (zoomed)
- SN=5 or 10 s binning (full-time range)
- Raw light curve
Spectra
Notes:
- 1) The fitting includes the systematic errors.
- 2) When the burst includes telescope slew time periods, the fitting uses an average response file made from multiple 5-s response files through out the slew time plus single time preiod for the non-slew times, and weighted by the total counts in the corresponding time period using addrmf. An average response file is needed becuase a spectral fit using the pre-slew DRM will introduce some errors in both a spectral shape and a normalization if the PHA file contains a lot of the slew/post-slew time interval.
- 3) For fits to more complicated models (e.g. a power-law over a cutoff power-law), the BAT team has decided to require a chi-square improvement of more than 6 for each extra dof.
Time averaged spectrum fit using the average DRM
Power-law model
Time interval is from    0.060 sec. to    2.488 sec.

Spectral model in power-law:
------------------------------------------------------------
Parameters  : value       lower 90%   higher 90%
Photon index: -1.15548     ( -0.294583   0.303173 )
Norm@50keV  : 4.57827E-03    ( -0.000655353   0.000655296 )
------------------------------------------------------------
#Fit statistic : Chi-Squared =          71.54 using 59 PHA bins.
# Reduced chi-squared =          1.255 for     57 degrees of freedom
# Null hypothesis probability =   9.309568e-02

Photon flux (15-150 keV)    in 2.428 sec: 0.534259 ( -0.078983  0.079194 ) ph/cm2/s
Energy fluence (15-150 keV)             : 1.14264e-07 ( -1.89582e-08  1.91524e-08 ) ergs/cm2
Cutoff power-law model

Time interval is from    0.060 sec. to    2.488 sec.
Spectral model in the cutoff power-law:
------------------------------------------------------------
Parameters  : value       lower 90%   higher 90%
Photon index: -1.15258     ( -0.272275   0.279751 )
Epeak [keV] : 1.00000E+04      ( -10000 -10000 )
Norm@50keV  : 4.60080E-03    (     )
------------------------------------------------------------
#Fit statistic : Chi-Squared =          71.58 using 59 PHA bins.
# Reduced chi-squared =          1.278 for     56 degrees of freedom
# Null hypothesis probability =   7.841989e-02

Photon flux (15-150 keV)    in 2.428 sec: 0.212325 ( -0.122966  0.113928 ) ph/cm2/s
Energy fluence (15-150 keV)             : 1.14116e-07 ( 0  0 ) ergs/cm2
1-s peak spectrum fit
Power-law model

Time interval is from   -0.010 sec. to    0.990 sec.

Spectral model in power-law:
------------------------------------------------------------
Parameters  : value       lower 90%   higher 90%
Photon index: -1.13513     ( -0.41311   0.424513 )
Norm@50keV  : 5.72711E-03    ( -0.00104506   0.00104505 )
------------------------------------------------------------
#Fit statistic : Chi-Squared =          69.43 using 59 PHA bins.
# Reduced chi-squared =          1.218 for     57 degrees of freedom
# Null hypothesis probability =   1.250103e-01

Photon flux (15-150 keV)    in 1 sec: 0.666709 ( -0.125502  0.125571 ) ph/cm2/s
Energy fluence (15-150 keV)             : 5.92407e-08 ( -1.30175e-08  1.31312e-08 ) ergs/cm2
Cutoff power-law model
Time interval is from   -0.010 sec. to    0.990 sec.
Spectral model in the cutoff power-law:
------------------------------------------------------------
Parameters  : value       lower 90%   higher 90%
Photon index: -1.13622     ( -0.372179   0.479702 )
Epeak [keV] : 1.00000E+04      ( -10000 -10000 )
Norm@50keV  : 5.75376E-03    ( -0.00104885   -0.00575377 )
------------------------------------------------------------
#Fit statistic : Chi-Squared =          69.46 using 59 PHA bins.
# Reduced chi-squared =          1.240 for     56 degrees of freedom
# Null hypothesis probability =   1.066716e-01

Photon flux (15-150 keV)    in 1 sec: 0.299375 ( -0.299375  0.195412 ) ph/cm2/s
Energy fluence (15-150 keV)             : 5.90269e-08 ( -1.28505e-08  1.32867e-08 ) ergs/cm2
Time-resolved spectra
Distribution
T90 vs. Hardness ratio plot
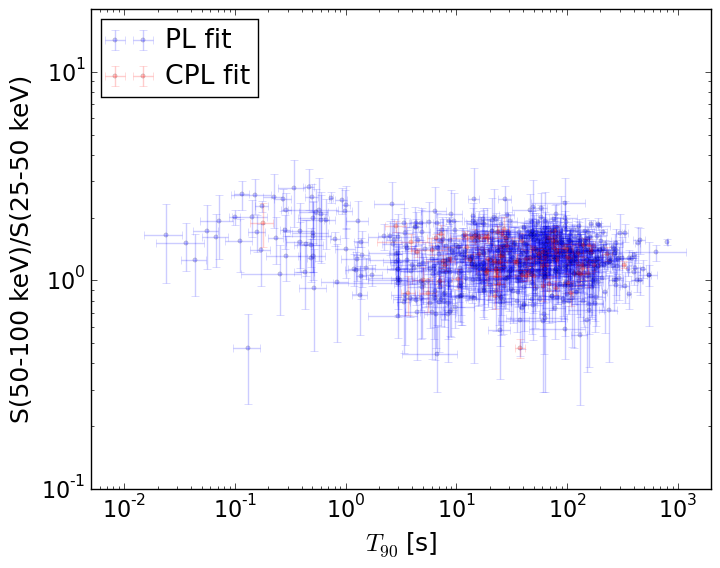
T90                                   = N/A sec.
Hardness ratio (energy fluence ratio) = N/A
S(15-50 keV) vs. S(50-150 keV) plot
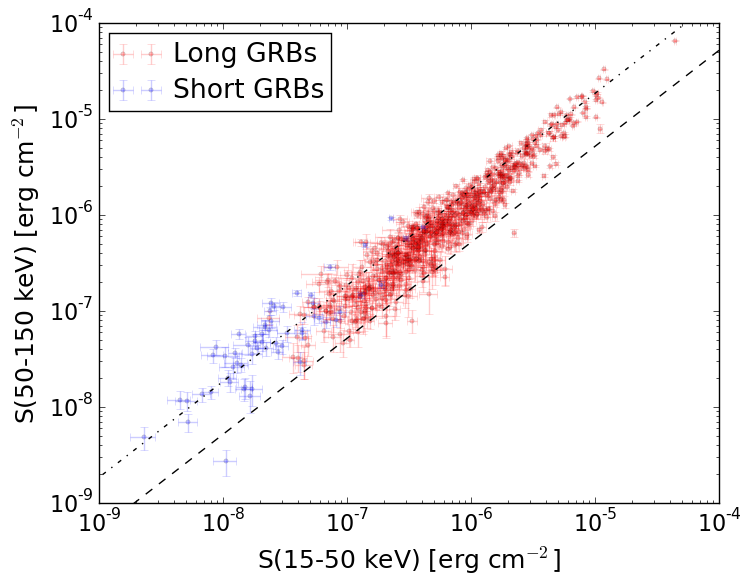
S(15-50 keV)  = N/A
S(50-150 keV) = N/A
The dash-dotted line and the dashed line traces the fluences calculated from the Band function with Epeak = 15 and 150 keV, respectively. Both lines assume a canonical values of alpha = -1 and beta = -2.5.
Mask shadow pattern
IMX = 3.600613765182163E-01, IMY = 4.289605819807337E-02
Spacecraft aspect plot

Bright source in the pre-burst/pre-slew/post-slew images
Pre-burst image of 15-350 keV band
Time interval of the image:
-60.208000 0.060000

# RAcent  DECcent POSerr Theta    Phi  PeakCts   SNR AngSep     Name
#  [deg]    [deg]    ['] [deg]  [deg]                   [']
202.9037   4.1539    2.2  31.8   98.5   0.7214   5.4 ------	UNKNOWN
190.3362   3.1068    3.1  25.7  121.7   0.3514   3.7 ------	UNKNOWN
195.2254  69.3617    2.6  43.8  -24.3   0.5343   4.5 ------	UNKNOWN
Pre-slew background subtracted image of 15-350 keV band
Time interval of the image:
0.060000 2.488000

# RAcent  DECcent POSerr Theta    Phi  PeakCts   SNR AngSep     Name
#  [deg]    [deg]    ['] [deg]  [deg]                   [']
188.5009  -2.2632    1.7  30.2  129.3   0.1529   6.7 ------	UNKNOWN
177.5236  14.9492    2.4  11.8  156.4   0.0709   4.8 ------	UNKNOWN
191.1913  44.1063    0.9  19.9   -6.8   0.1831  12.5 ------	UNKNOWN
Post-slew image of 15-350 keV band
Time interval of the image:
59.092590 302.854300

# RAcent  DECcent POSerr Theta    Phi  PeakCts   SNR AngSep     Name
#  [deg]    [deg]    ['] [deg]  [deg]                   [']
254.4016  35.2054    4.4  48.2   44.2   1.9920   2.6    8.7	Her X-1
259.6061  38.8655    3.5  50.0   37.2   2.8021   3.3 ------	UNKNOWN
235.9076  29.0313    3.2  38.4   64.1   1.7807   3.6 ------	UNKNOWN
172.9111  -5.1982    2.7  52.0  169.7   2.5207   4.3 ------	UNKNOWN
172.5813   7.1828    2.8  40.4  175.6   1.0848   4.2 ------	UNKNOWN
294.5325  63.2048    2.6  56.8   -2.1   3.5027   4.5 ------	UNKNOWN
160.1390   8.8264    2.1  44.4 -166.9   1.6657   5.6 ------	UNKNOWN
  7.7829  81.4179    3.4  54.4  -33.1   3.1465   3.4 ------	UNKNOWN