Analysis Summary
Notes:
- 1) No attempt has been made to eliminate the non-significant decimal places.
- 2) This batgrbproduct analysis is done using the HEASARC data.
- 3) This batgrbproduct analysis is using the flight position for the mask-weighting calculation.
======================================================================
BAT GRB EVENT DATA PROCESSING REPORT
Process Script Ver: batgrbproduct v2.46
Process Start Time: Sun Jan 19 15:53:56 EST 2014
Host Name: batevent1
Current Working Dir: /local/data/batevent/batevent_reproc/trigger355303
======================================================================
Trigger: 00355303 Segment: 000
BAT Trigger Time: 267250968 [s; MET]
Trigger Stop: 267250976.192 [s; MET]
UTC: 2009-06-21T04:22:43.155300 [includes UTCF correction]
Where From?: TDRSS position message
BAT
RA: 10.9861581404119 Dec: 61.9679004327154 [deg; J2000]
Catalogged Source?: NO
Point Source?: YES
GRB Indicated?: YES [ by BAT flight software ]
Image S/N Ratio: 7.8
Image Trigger?: NO
Rate S/N Ratio: 7.28010988928052 [ if not an image trigger ]
Image S/N Ratio: 7.8
Analysis Position: [ source = BAT ]
RA: 10.9861581404119 Dec: 61.9679004327154 [deg; J2000]
Refined Position: [ source = BAT pre-slew burst ]
RA: 10.987544246165 Dec: 61.9386576388914 [deg; J2000]
{ 00h 43m 57.0s , +61d 56' 19.2" }
+/- 1.68809163958159 [arcmin] (estimated 90% radius based on SNR)
+/- 0.622900260053021 [arcmin] (formal 1-sigma fit error)
SNR: 14.3968315848615
Angular difference between the analysis and refined position is 1.755003 arcmin
Partial Coding Fraction: 0.7734375 [ including projection effects ]
Duration
T90: 219.236000001431 +/- 72.378491614085
Measured from: -1.53999999165535
to: 217.696000009775 [s; relative to TRIGTIME]
T50: 106.532000005245 +/- 60.6811145451002
Measured from: 77.2759999930859
to: 183.807999998331 [s; relative to TRIGTIME]
Fluence
Peak Flux (peak 1 second)
Measured from: 239.847999989986
to: 240.847999989986 [s; relative to TRIGTIME]
Total Fluence
Measured from: -31.0480000078678
to: 241.747999995947 [s; relative to TRIGTIME]
Band 1 Band 2 Band 3 Band 4
15-25 25-50 50-100 100-350 keV
Total 1.624493 1.946231 1.309509 0.192701
0.083837 0.086721 0.076380 0.066600 [error]
Peak 0.093355 0.118441 0.065568 0.022200
0.006199 0.006481 0.005541 0.004220 [error]
[ fluence units of on-axis counts / fully illuminated detector ]
======================================================================
====== Table of the duration information =============================
Value tstart tstop
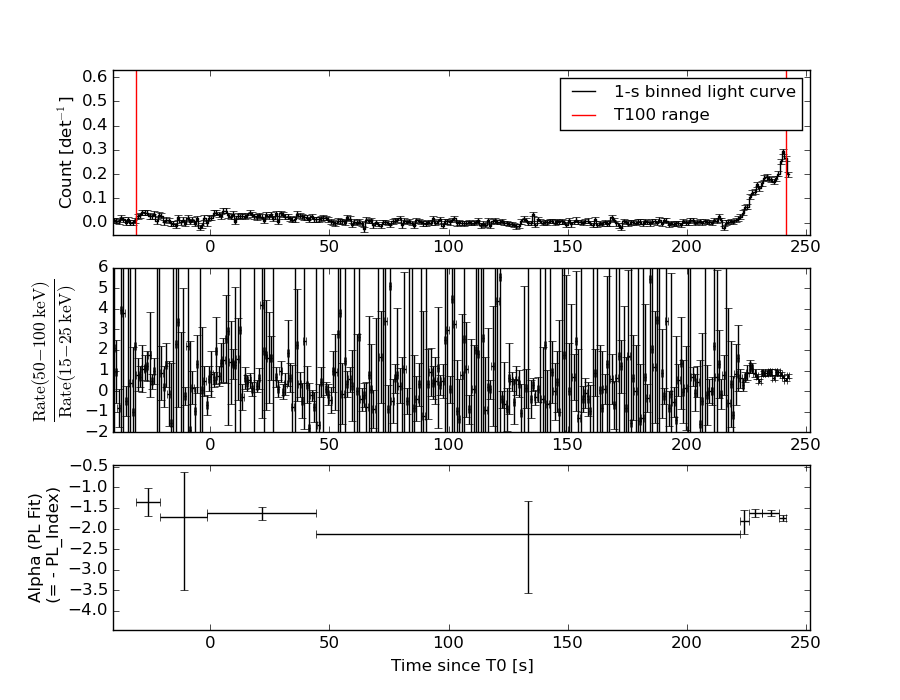
T100 272.796 -31.048 241.748
T90 219.236 -1.540 217.696
T50 106.532 77.276 183.808
Peak 1.000 239.848 240.848
====== Spectral Analysis Summary =====================================
Model : spectral model: simple power-law (PL) and cutoff power-law (CPL)
Ph_index : photon index: E^{Ph_index}
Ph_90err : 90% error of the photon index
Epeak : Epeak in keV
Epeak_90err: 90% error of Epeak
Norm : normalization at 50 keV in both the PL model and CPL model
Nomr_90err : 90% error of the normalization
chi2 : Chi-Squared
dof : degree of freedo
=== Time-averaged spectral analysis ===
(Best model with acceptable fit: PL)
Model Ph_index Ph_90err_low Ph_90err_hi Epeak Epeak_90err_low Epeak_90err_hi Norm Nomr_90err_low Norm_90err_hi chi2 dof
PL -1.674 -0.099 0.098 - - - 1.16e-03 -6.51e-05 6.47e-05 70.830 57
CPL -1.299 -0.372 0.407 90.537 -25.149 901.263 1.80e-03 -6.26e-04 1.08e-03 67.860 56
=== 1-s peak spectral analysis ===
(Best model with acceptable fit: PL)
Model Ph_index Ph_90err_low Ph_90err_hi Epeak Epeak_90err_low Epeak_90err_hi Norm Nomr_90err_low Norm_90err_hi chi2 dof
PL -1.724 -0.121 0.119 - - - 1.72e-02 -1.27e-03 1.26e-03 64.970 57
CPL -1.640 -0.493 0.458 193.705 N/A N/A 1.92e-02 N/A N/A 64.860 56
=== Fluence/Peak Flux Summary ===
Model Band1 Band2 Band3 Band4 Band5 Total
15-25 25-50 50-100 100-350 15-150 15-350 keV
Fluence PL 4.74e-07 7.84e-07 9.83e-07 2.45e-06 2.93e-06 4.69e-06 erg/cm2
90%_error_low -4.17e-08 -4.22e-08 -7.49e-08 -3.77e-07 -1.75e-07 -4.42e-07 erg/cm2
90%_error_hi 4.28e-08 4.22e-08 7.50e-08 4.21e-07 1.76e-07 4.77e-07 erg/cm2
Peak flux PL 8.80e-01 7.76e-01 4.70e-01 4.30e-01 2.31e+00 2.56e+00 ph/cm2/s
90%_error_low -9.24e-02 -5.23e-02 -4.51e-02 -7.70e-02 -1.54e-01 -1.70e-01 ph/cm2/s
90%_error_hi 9.47e-02 5.21e-02 4.51e-02 8.69e-02 1.54e-01 1.71e-01 ph/cm2/s
Fluence CPL 4.46e-07 8.12e-07 9.95e-07 1.38e-06 2.83e-06 3.64e-06 erg/cm2
90%_error_low -4.99e-08 -5.06e-08 -7.91e-08 -5.65e-07 -1.99e-07 -6.02e-07 erg/cm2
90%_error_hi 5.07e-08 5.15e-08 7.98e-08 1.05e-06 2.00e-07 1.06e-06 erg/cm2
Peak flux CPL 8.71e-01 7.83e-01 4.71e-01 3.80e-01 2.30e+00 2.51e+00 ph/cm2/s
90%_error_low -1.03e-01 -5.82e-02 -4.59e-02 -1.75e-01 -1.60e-01 -2.44e-01 ph/cm2/s
90%_error_hi 8.91e-02 6.52e-02 4.66e-02 9.20e-02 1.59e-01 2.16e-01 ph/cm2/s
======================================================================
Image
Pre-slew 15.0-350.0 keV image (Event data)
#   RAcent    DECcent   POSerr    Theta     Phi              Peak Cts       SNR   Name
   10.9875    61.9387   0.0133    27.6519   -35.8055         1.6051573     14.397 TRIG_00355303

Foreground time interval of the image:
-31.048  50.301 (delta_t =  81.349 [sec])
Background time interval of the image:
-239.000 -31.048 (delta_t = 207.952 [sec])
Light Curves
Note: The mask-weighted lightcurves have units of either count/det or counts/sec/det, where a det is 0.4 x 0.4 = 0.16 sq cm.
Full-time range; 1 s binning
Other quick-look light curves:
- 64 ms binning (zoomed)
- 16 ms binning (zoomed)
- 8 ms binning (zoomed)
- 2 ms binning (zoomed)
- SN=5 or 10 s binning (full-time range)
- Raw light curve
Spectra
- 64 ms binning (zoomed)
- 16 ms binning (zoomed)
- 8 ms binning (zoomed)
- 2 ms binning (zoomed)
- SN=5 or 10 s binning (full-time range)
- Raw light curve
Spectra
Notes:
- 1) The fitting includes the systematic errors.
- 2) When the burst includes telescope slew time periods, the fitting uses an average response file made from multiple 5-s response files through out the slew time plus single time preiod for the non-slew times, and weighted by the total counts in the corresponding time period using addrmf. An average response file is needed becuase a spectral fit using the pre-slew DRM will introduce some errors in both a spectral shape and a normalization if the PHA file contains a lot of the slew/post-slew time interval.
- 3) For fits to more complicated models (e.g. a power-law over a cutoff power-law), the BAT team has decided to require a chi-square improvement of more than 6 for each extra dof.
Time averaged spectrum fit using the average DRM
Power-law model
Time interval is from  -31.048 sec. to  241.748 sec.

Spectral model in power-law:
------------------------------------------------------------
Parameters  : value       lower 90%   higher 90%
Photon index: -1.67387     ( -0.0988712   0.0976553 )
Norm@50keV  : 1.15642E-03    ( -6.51433e-05   6.47507e-05 )
------------------------------------------------------------
#Fit statistic : Chi-Squared =          70.83 using 59 PHA bins.
# Reduced chi-squared =          1.243 for     57 degrees of freedom
# Null hypothesis probability =   1.030062e-01

Photon flux (15-150 keV)    in 272.8 sec: 0.152216 ( -0.008214  0.008225 ) ph/cm2/s
Energy fluence (15-150 keV)             : 2.92774e-06 ( -1.74566e-07  1.75989e-07 ) ergs/cm2
Cutoff power-law model
Time interval is from  -31.048 sec. to  241.748 sec.
Spectral model in the cutoff power-law:
------------------------------------------------------------
Parameters  : value       lower 90%   higher 90%
Photon index: -1.29939     ( -0.371636   0.406776 )
Epeak [keV] : 90.5367      ( -25.1489 901.264 )
Norm@50keV  : 1.80080E-03    ( -0.000625873   0.00108081 )
------------------------------------------------------------
#Fit statistic : Chi-Squared =          67.86 using 59 PHA bins.
# Reduced chi-squared =          1.212 for     56 degrees of freedom
# Null hypothesis probability =   1.331278e-01

Photon flux (15-150 keV)    in 272.8 sec: 0.148872 ( -0.008828  0.008832 ) ph/cm2/s
Energy fluence (15-150 keV)             : 2.82926e-06 ( -1.9909e-07  2.00051e-07 ) ergs/cm2
1-s peak spectrum fit
Power-law model
Time interval is from  239.848 sec. to  240.848 sec.

Spectral model in power-law:
------------------------------------------------------------
Parameters  : value       lower 90%   higher 90%
Photon index: -1.72418     ( -0.12098   0.118968 )
Norm@50keV  : 1.72349E-02    ( -0.00126959   0.00125642 )
------------------------------------------------------------
#Fit statistic : Chi-Squared =          64.97 using 59 PHA bins.
# Reduced chi-squared =          1.140 for     57 degrees of freedom
# Null hypothesis probability =   2.187415e-01

Photon flux (15-150 keV)    in 1 sec: 2.30877 ( -0.15427  0.15435 ) ph/cm2/s
Energy fluence (15-150 keV)             : 1.59316e-07 ( -1.22237e-08  1.23444e-08 ) ergs/cm2
Cutoff power-law model
Time interval is from  239.848 sec. to  240.848 sec.
Spectral model in the cutoff power-law:
------------------------------------------------------------
Parameters  : value       lower 90%   higher 90%
Photon index: -1.64003     ( -0.493093   0.458087 )
Epeak [keV] : 193.705      (   )
Norm@50keV  : 1.91734E-02    (     )
------------------------------------------------------------
#Fit statistic : Chi-Squared =          64.86 using 59 PHA bins.
# Reduced chi-squared =          1.158 for     56 degrees of freedom
# Null hypothesis probability =   1.951806e-01

Photon flux (15-150 keV)    in 1 sec: 2.30055 ( -0.15953  0.15853 ) ph/cm2/s
Energy fluence (15-150 keV)             : 1.57914e-07 ( -1.41401e-08  1.34107e-08 ) ergs/cm2
Time-resolved spectra
Distribution
T90 vs. Hardness ratio plot
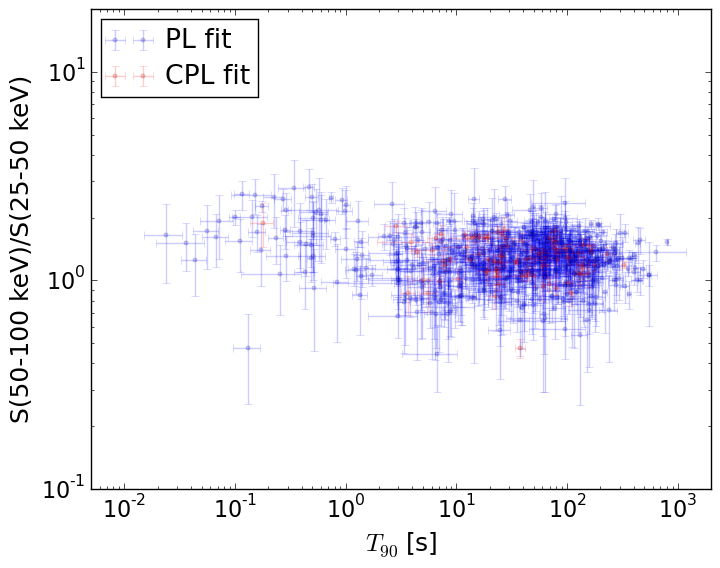
T90                                   = N/A sec.
Hardness ratio (energy fluence ratio) = N/A
S(15-50 keV) vs. S(50-150 keV) plot
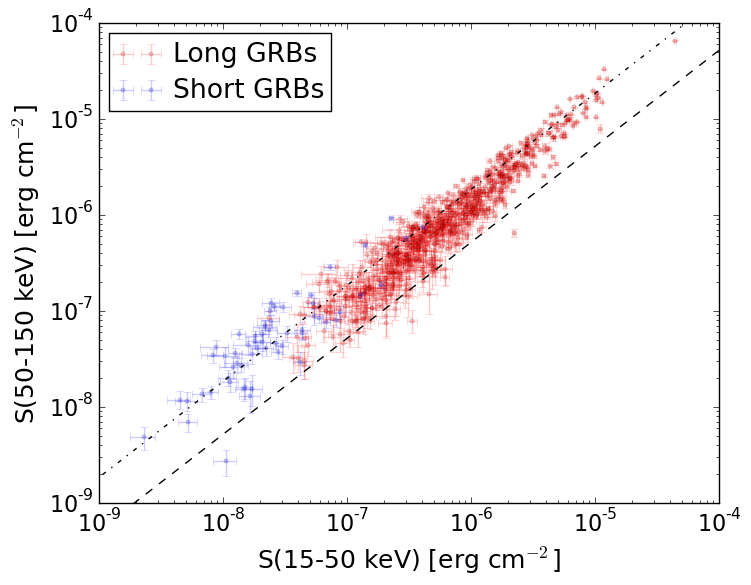
S(15-50 keV)  = N/A
S(50-150 keV) = N/A
The dash-dotted line and the dashed line traces the fluences calculated from the Band function with Epeak = 15 and 150 keV, respectively. Both lines assume a canonical values of alpha = -1 and beta = -2.5.
Mask shadow pattern
IMX = 4.249211462681622E-01, IMY = 3.065245283774237E-01
Spacecraft aspect plot
Bright source in the pre-burst/pre-slew/post-slew images
Pre-burst image of 15-350 keV band
Time interval of the image:
-239.000000 -31.048000

# RAcent  DECcent POSerr Theta    Phi  PeakCts   SNR AngSep     Name
#  [deg]    [deg]    ['] [deg]  [deg]                   [']
299.5872  35.1902    1.0  43.2   56.8   7.6772  11.4    0.7	Cyg X-1
308.1806  40.8171    9.0  37.9   45.9   0.4348   1.3    8.7	Cyg X-3
325.9966  38.3656    5.6  42.1   25.2   0.6642   2.1    8.7	Cyg X-2
Pre-slew background subtracted image of 15-350 keV band
Time interval of the image:
-31.048000 50.300590

# RAcent  DECcent POSerr Theta    Phi  PeakCts   SNR AngSep     Name
#  [deg]    [deg]    ['] [deg]  [deg]                   [']
299.6188  35.0393    0.0  43.4   56.8  -0.2717  -0.7    9.8	Cyg X-1
308.3499  40.9395   12.1  37.8   45.7  -0.1984  -1.0   10.9	Cyg X-3
326.1502  38.3125   29.2  42.1   25.0  -0.0802  -0.4    1.1	Cyg X-2
211.9308  45.4121    1.9  44.2  157.5   1.3109   6.0 ------	UNKNOWN
 10.9875  61.9387    0.8  27.7  -35.8   1.6052  14.4 ------	UNKNOWN
 21.4427  42.2899    2.1  48.2  -34.5   1.4186   5.6 ------	UNKNOWN
102.4835  65.4538    2.3  36.0 -108.5   0.9990   5.0 ------	UNKNOWN
Post-slew image of 15-350 keV band
Time interval of the image:
101.300590 243.052300

# RAcent  DECcent POSerr Theta    Phi  PeakCts   SNR AngSep     Name
#  [deg]    [deg]    ['] [deg]  [deg]                   [']
326.0197  38.3361    8.8  36.1   72.5   0.3967   1.3    7.2	Cyg X-2
303.9098  46.8567    2.2  39.7  101.9   2.5083   5.4 ------	UNKNOWN
  3.5399   7.5728    2.5  54.7   11.3   2.9676   4.7  501.3	UNKNOWN
 10.9918  61.9355    0.4   0.0    0.3   3.5612  29.5 ------	UNKNOWN