Analysis Summary
Notes:
- 1) No attempt has been made to eliminate the non-significant decimal places.
- 2) This batgrbproduct analysis is done using the HEASARC data.
- 3) This batgrbproduct analysis is using the flight position for the mask-weighting calculation.
======================================================================
BAT GRB EVENT DATA PROCESSING REPORT
Process Script Ver: batgrbproduct v2.46
Process Start Time: Sun Jan 19 15:49:16 EST 2014
Host Name: batevent1
Current Working Dir: /local/data/batevent/batevent_reproc/trigger355359
======================================================================
Trigger: 00355359 Segment: 000
BAT Trigger Time: 267314850.496 [s; MET]
Trigger Stop: 267314850.56 [s; MET]
UTC: 2009-06-21T22:07:25.649220 [includes UTCF correction]
Where From?: (*SHORT BURST*) TDRSS scaled map message
BAT
RA: 313.432293721725 Dec: 69.0133669114323 [deg; J2000]
Catalogged Source?: NO
Point Source?: YES
GRB Indicated?: YES [ by BAT flight software ]
Image S/N Ratio: 8.88
Image Trigger?: NO
Rate S/N Ratio: 43.3820239269677 [ if not an image trigger ]
Image S/N Ratio: 8.88
Analysis Position: [ source = BAT ]
RA: 313.432293721725 Dec: 69.0133669114323 [deg; J2000]
Refined Position: [ source = BAT pre-slew burst ]
RA: 313.459988338886 Dec: 69.0301545448606 [deg; J2000]
{ 20h 53m 50.4s , +69d 01' 48.6" }
+/- 1.74460231010358 [arcmin] (estimated 90% radius based on SNR)
+/- 0.61178070090604 [arcmin] (formal 1-sigma fit error)
SNR: 13.7352872644
Angular difference between the analysis and refined position is 1.169820 arcmin
Partial Coding Fraction: 0.6953125 [ including projection effects ]
Duration
T90: 0.140000015497208 +/- 0.0368781879146241
Measured from: -0.0119999945163727
to: 0.128000020980835 [s; relative to TRIGTIME]
T50: 0.0439999997615814 +/- 0.017888553416166
Measured from: 0.0360000133514404
to: 0.0800000131130219 [s; relative to TRIGTIME]
Fluence
Peak Flux (peak 1 second)
Measured from: -0.439999997615814
to: 0.560000002384186 [s; relative to TRIGTIME]
Total Fluence
Measured from: -0.0279999971389771
to: 0.143999993801117 [s; relative to TRIGTIME]
Band 1 Band 2 Band 3 Band 4
15-25 25-50 50-100 100-350 keV
Total 0.015092 0.024656 0.035818 0.020884
0.003076 0.003723 0.004017 0.003368 [error]
Peak 0.014125 0.033738 0.028889 0.021131
0.006086 0.006546 0.006217 0.005456 [error]
[ fluence units of on-axis counts / fully illuminated detector ]
======================================================================
====== Table of the duration information =============================
Value tstart tstop
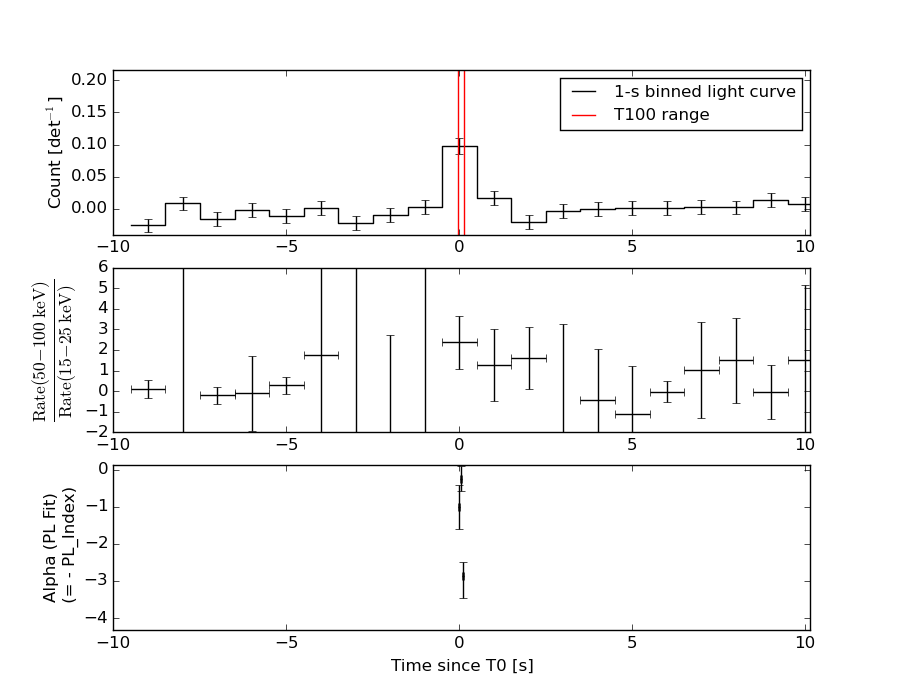
T100 0.172 -0.028 0.144
T90 0.140 -0.012 0.128
T50 0.044 0.036 0.080
Peak 1.000 -0.440 0.560
====== Spectral Analysis Summary =====================================
Model : spectral model: simple power-law (PL) and cutoff power-law (CPL)
Ph_index : photon index: E^{Ph_index}
Ph_90err : 90% error of the photon index
Epeak : Epeak in keV
Epeak_90err: 90% error of Epeak
Norm : normalization at 50 keV in both the PL model and CPL model
Nomr_90err : 90% error of the normalization
chi2 : Chi-Squared
dof : degree of freedo
=== Time-averaged spectral analysis ===
(Best model with acceptable fit: N/A)
Model Ph_index Ph_90err_low Ph_90err_hi Epeak Epeak_90err_low Epeak_90err_hi Norm Nomr_90err_low Norm_90err_hi chi2 dof
PL -0.684 -0.231 0.244 - - - 3.46e-02 -4.70e-03 4.61e-03 40.050 57
CPL -0.680 -0.228 0.769 9999.360 -9999.360 -9999.360 3.49e-02 -4.39e-03 3.55e-02 40.070 56
=== 1-s peak spectral analysis ===
(Best model with acceptable fit: PL)
Model Ph_index Ph_90err_low Ph_90err_hi Epeak Epeak_90err_low Epeak_90err_hi Norm Nomr_90err_low Norm_90err_hi chi2 dof
PL -1.004 -0.342 0.368 - - - 6.32e-03 -1.31e-03 1.30e-03 37.420 57
CPL -0.294 -0.883 2.570 122.483 -122.483 -122.483 1.43e-02 -9.08e-03 2.61e-01 36.870 56
=== Fluence/Peak Flux Summary ===
Model Band1 Band2 Band3 Band4 Band5 Total
15-25 25-50 50-100 100-350 15-150 15-350 keV
Fluence PL 3.56e-09 1.08e-08 2.70e-08 1.89e-07 7.32e-08 2.31e-07 erg/cm2
90%_error_low -9.86e-10 -1.89e-09 -3.62e-09 -5.48e-08 -1.01e-08 -5.67e-08 erg/cm2
90%_error_hi 1.09e-09 1.84e-09 3.58e-09 7.03e-08 1.02e-08 7.09e-08 erg/cm2
Peak flux PL 1.62e-01 2.19e-01 2.19e-01 3.93e-01 7.27e-01 9.93e-01 ph/cm2/s
90%_error_low -6.23e-02 -5.65e-02 -4.91e-02 -1.59e-01 -1.52e-01 -2.18e-01 ph/cm2/s
90%_error_hi 7.08e-02 5.49e-02 4.84e-02 2.22e-01 1.53e-01 2.33e-01 ph/cm2/s
Fluence CPL 3.55e-09 1.08e-08 2.65e-08 1.98e-07 7.35e-08 2.31e-07 erg/cm2
90%_error_low N/A N/A -3.16e-09 -1.25e-07 -1.41e-08 -1.14e-07 erg/cm2
90%_error_hi N/A N/A 4.62e-09 2.45e-08 1.35e-08 3.17e-08 erg/cm2
Peak flux CPL 1.43e-01 2.35e-01 2.32e-01 1.78e-01 7.09e-01 7.86e-01 ph/cm2/s
90%_error_low -7.36e-02 -6.61e-02 -5.63e-02 -1.78e-01 -1.63e-01 -2.31e-01 ph/cm2/s
90%_error_hi 6.47e-02 7.47e-02 5.97e-02 2.81e-01 1.59e-01 3.31e-01 ph/cm2/s
======================================================================
Image
Pre-slew 15.0-350.0 keV image (Event data)
#   RAcent    DECcent   POSerr    Theta     Phi              Peak Cts       SNR   Name
  313.4600    69.0302   0.0141    23.8782   133.9387         0.1001109     13.735 TRIG_00355359

Foreground time interval of the image:
 -0.028   0.144 (delta_t =   0.172 [sec])
Background time interval of the image:
-239.496  -0.028 (delta_t = 239.468 [sec])
Light Curves
Note: The mask-weighted lightcurves have units of either count/det or counts/sec/det, where a det is 0.4 x 0.4 = 0.16 sq cm.
Full-time range; 1 s binning
Other quick-look light curves:
- 64 ms binning (zoomed)
- 16 ms binning (zoomed)
- 8 ms binning (zoomed)
- 2 ms binning (zoomed)
- SN=5 or 10 s binning (full-time range)
- Raw light curve
Spectra
- 64 ms binning (zoomed)
- 16 ms binning (zoomed)
- 8 ms binning (zoomed)
- 2 ms binning (zoomed)
- SN=5 or 10 s binning (full-time range)
- Raw light curve
Spectra
Notes:
- 1) The fitting includes the systematic errors.
- 2) When the burst includes telescope slew time periods, the fitting uses an average response file made from multiple 5-s response files through out the slew time plus single time preiod for the non-slew times, and weighted by the total counts in the corresponding time period using addrmf. An average response file is needed becuase a spectral fit using the pre-slew DRM will introduce some errors in both a spectral shape and a normalization if the PHA file contains a lot of the slew/post-slew time interval.
- 3) For fits to more complicated models (e.g. a power-law over a cutoff power-law), the BAT team has decided to require a chi-square improvement of more than 6 for each extra dof.
Time averaged spectrum fit using the average DRM
Power-law model
Time interval is from   -0.028 sec. to    0.144 sec.

Spectral model in power-law:
------------------------------------------------------------
Parameters  : value       lower 90%   higher 90%
Photon index: -0.683996     ( -0.230633   0.244326 )
Norm@50keV  : 3.46116E-02    ( -0.00469759   0.00460739 )
------------------------------------------------------------
#Fit statistic : Chi-Squared =          40.05 using 59 PHA bins.
# Reduced chi-squared =         0.7027 for     57 degrees of freedom
# Null hypothesis probability =   9.568233e-01

Photon flux (15-150 keV)    in 0.172 sec: 0.115882 0.272396 0.197409 0.144594 0.109829 (    ) ph/cm2/s
Energy fluence (15-150 keV)             : 7.32029e-08 ( -1.01059e-08  1.01573e-08 ) ergs/cm2
Cutoff power-law model

Time interval is from   -0.028 sec. to    0.144 sec.
Spectral model in the cutoff power-law:
------------------------------------------------------------
Parameters  : value       lower 90%   higher 90%
Photon index: -0.680213     ( -0.228603   0.769189 )
Epeak [keV] : 9999.36      ( -9999.36 -9999.36 )
Norm@50keV  : 3.48715E-02    ( -0.00442578   0.0354195 )
------------------------------------------------------------
#Fit statistic : Chi-Squared =          40.07 using 59 PHA bins.
# Reduced chi-squared =         0.7155 for     56 degrees of freedom
# Null hypothesis probability =   9.466611e-01

Photon flux (15-150 keV)    in 0.172 sec: 4.01515 ( -0.55792  0.53846 ) ph/cm2/s
Energy fluence (15-150 keV)             : 7.35238e-08 ( -1.40592e-08  1.3472e-08 ) ergs/cm2
1-s peak spectrum fit
Power-law model
Time interval is from   -0.440 sec. to    0.560 sec.

Spectral model in power-law:
------------------------------------------------------------
Parameters  : value       lower 90%   higher 90%
Photon index: -1.0043     ( -0.341829   0.367966 )
Norm@50keV  : 6.31735E-03    ( -0.00130623   0.00130033 )
------------------------------------------------------------
#Fit statistic : Chi-Squared =          37.42 using 59 PHA bins.
# Reduced chi-squared =         0.6564 for     57 degrees of freedom
# Null hypothesis probability =   9.790946e-01

Photon flux (15-150 keV)    in 1 sec: 0.727479 ( -0.152238  0.152882 ) ph/cm2/s
Energy fluence (15-150 keV)             : 6.8215e-08 ( -1.51302e-08  1.53492e-08 ) ergs/cm2
Cutoff power-law model
Time interval is from   -0.440 sec. to    0.560 sec.
Spectral model in the cutoff power-law:
------------------------------------------------------------
Parameters  : value       lower 90%   higher 90%
Photon index: -0.29429     ( -0.881956   2.57089 )
Epeak [keV] : 122.483      ( -122.608 -122.608 )
Norm@50keV  : 1.43026E-02    ( -0.00906186   0.261205 )
------------------------------------------------------------
#Fit statistic : Chi-Squared =          36.87 using 59 PHA bins.
# Reduced chi-squared =         0.6584 for     56 degrees of freedom
# Null hypothesis probability =   9.773999e-01

Photon flux (15-150 keV)    in 1 sec: 0.708689 ( -0.16296  0.159179 ) ph/cm2/s
Energy fluence (15-150 keV)             : 6.3972e-08 ( -1.9654e-08  1.79292e-08 ) ergs/cm2
Time-resolved spectra
Distribution
T90 vs. Hardness ratio plot
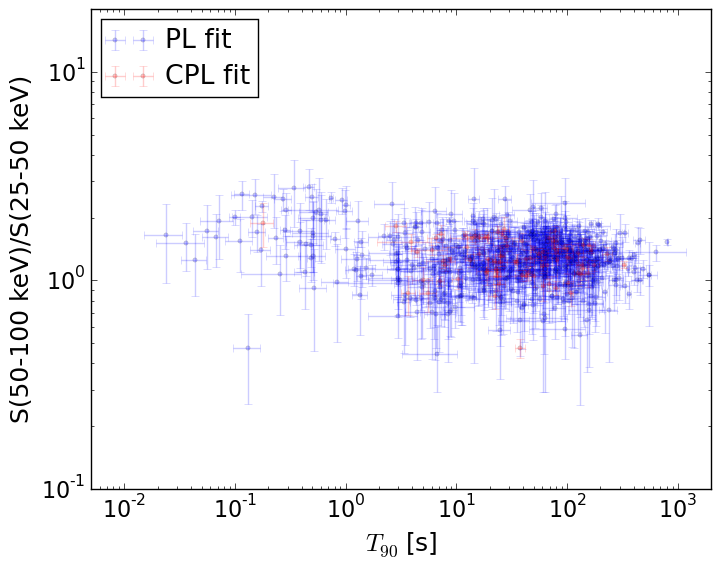
T90                                   = N/A sec.
Hardness ratio (energy fluence ratio) = N/A
S(15-50 keV) vs. S(50-150 keV) plot
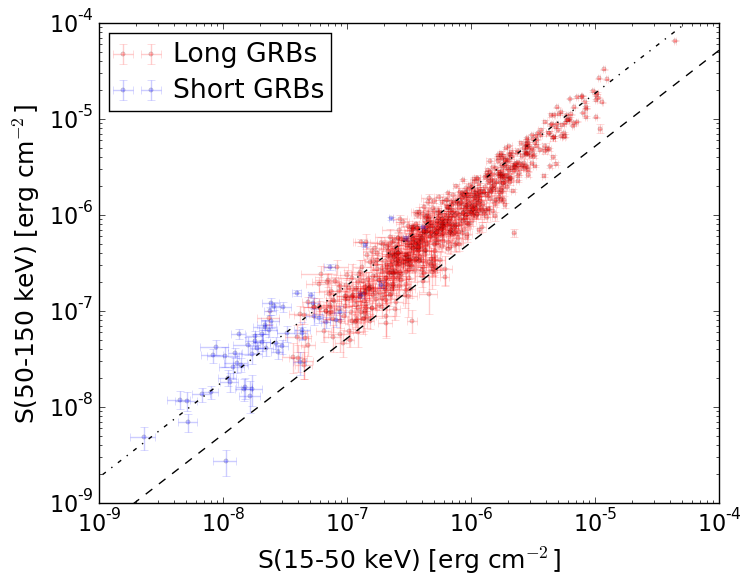
S(15-50 keV)  = N/A
S(50-150 keV) = N/A
The dash-dotted line and the dashed line traces the fluences calculated from the Band function with Epeak = 15 and 150 keV, respectively. Both lines assume a canonical values of alpha = -1 and beta = -2.5.
Mask shadow pattern
IMX = -3.071729157571842E-01, IMY = -3.187682394523158E-01
Spacecraft aspect plot
Bright source in the pre-burst/pre-slew/post-slew images
Pre-burst image of 15-350 keV band
Time interval of the image:
-239.496000 -0.028000

# RAcent  DECcent POSerr Theta    Phi  PeakCts   SNR AngSep     Name
#  [deg]    [deg]    ['] [deg]  [deg]                   [']
326.0496  38.3340    5.7  36.1   72.5   0.8815   2.0    5.8	Cyg X-2
338.5490  21.3079    2.9  46.3   45.9   2.6340   3.9 ------	UNKNOWN
342.4261  17.5348    2.6  48.7   39.6   3.3826   4.3 ------	UNKNOWN
339.5755  33.9563    2.8  34.3   52.3   1.2096   4.1 ------	UNKNOWN
347.4423  48.0221    2.5  19.2   56.6   0.8370   4.7 ------	UNKNOWN
Pre-slew background subtracted image of 15-350 keV band
Time interval of the image:
-0.028000 0.144000

# RAcent  DECcent POSerr Theta    Phi  PeakCts   SNR AngSep     Name
#  [deg]    [deg]    ['] [deg]  [deg]                   [']
326.2798  38.3536    4.2  35.9   72.3  -0.0413  -2.7    5.4	Cyg X-2
313.4600  69.0302    0.8  23.9  133.9   0.1001  13.7 ------	UNKNOWN
 47.3680  76.5270    2.7  18.8 -152.5   0.0245   4.3 ------	UNKNOWN
Post-slew image of 15-350 keV band
Time interval of the image:
54.404590 835.504600

# RAcent  DECcent POSerr Theta    Phi  PeakCts   SNR AngSep     Name
#  [deg]    [deg]    ['] [deg]  [deg]                   [']
299.5940  35.2042    0.4  34.7   71.4  35.9061  32.3    0.2	Cyg X-1
308.0301  40.8190   14.2  28.3   60.0   0.5122   0.8    8.8	Cyg X-3
326.1386  38.3798    3.5  31.4   32.0   1.9299   3.2    3.8	Cyg X-2
316.4055  22.2943    2.8  46.8   47.5   9.0358   4.1 ------	UNKNOWN
314.0349  58.4201    5.2  10.6   49.7   0.8769   2.2 ------	UNKNOWN
202.0045  42.9582    2.5  57.3  177.2  13.2694   4.7 ------	UNKNOWN
200.2971  57.0151    2.5  45.1 -173.8   3.9249   4.5 ------	UNKNOWN
355.9488  46.6982    2.9  30.6  -14.2   1.7634   4.0 ------	UNKNOWN
178.4474  59.3913    4.3  47.6 -157.9   2.4400   2.7 ------	UNKNOWN