Analysis Summary
Notes:
- 1) No attempt has been made to eliminate the non-significant decimal places.
- 2) This batgrbproduct analysis is done using the HEASARC data.
- 3) This batgrbproduct analysis is using the flight position for the mask-weighting calculation.
======================================================================
                  BAT GRB EVENT DATA PROCESSING REPORT
    Process Script Ver: batgrbproduct v2.46
    Process Start Time: Sun Jan 19 15:11:50 EST 2014
             Host Name: batevent1
   Current Working Dir: /local/data/batevent/batevent_reproc/trigger357512
======================================================================

  Trigger: 00357512      Segment: 000

  BAT Trigger Time: 269384599.552   [s; MET]
      Trigger Stop: 269384600.576   [s; MET]
               UTC: 2009-07-15T21:03:14.638140    [includes UTCF correction]
       Where From?: TDRSS position message

  BAT
    RA: 251.344210801804   Dec: 44.8267357756654  [deg; J2000]

     Catalogged Source?: NO
     Point Source?:      YES
     GRB Indicated?:     YES    [ by BAT flight software ]
     Image S/N Ratio:    11.48
     Image Trigger?:     NO
     Rate S/N Ratio:     24.9599679486974  [ if not an image trigger ]
     Image S/N Ratio:    11.48

  Analysis Position:   [ source = BAT ]
    RA: 251.344210801804   Dec: 44.8267357756654  [deg; J2000]

  Refined Position:   [ source = BAT pre-slew burst ]
    RA: 251.337504687415   Dec: 44.8383599885626  [deg; J2000]
        { 16h 45m 21.0s , +44d 50' 18.1" }
         +/- 0.591795565878904 [arcmin] (estimated 90% radius based on SNR)
         +/- 0.131778457099376 [arcmin] (formal 1-sigma fit error)
    SNR: 64.3557521218125

  Angular difference between the analysis and refined position is 0.753567 arcmin

  Partial Coding Fraction: 1.015625    [ including projection effects ]

  Duration
     T90: 266.399999916553 +/- 11.596705875929
        Measured from: -0.715999960899353
                   to: 265.683999955654     [s; relative to TRIGTIME]
     T50: 63.8599998950958 +/- 1.13974033794588
        Measured from: 5.78400003910065
                   to: 69.6439999341965     [s; relative to TRIGTIME]


  Fluence
     Peak Flux  (peak 1 second)
        Measured from: 6.45600003004074
                   to: 7.45600003004074     [s; relative to TRIGTIME]
     Total Fluence
        Measured from: -11.6480000019073
                   to: 292.31200003624     [s; relative to TRIGTIME]

             Band 1     Band 2     Band 3     Band 4
              15-25      25-50     50-100    100-350     keV
 Total     2.984596   3.635168   2.561005   0.562827
           0.090137   0.094682   0.086041   0.080399 [error]
 Peak      0.118522   0.178282   0.151994   0.038735
           0.006757   0.007728   0.007357   0.005618 [error]

     [ fluence units of on-axis counts / fully illuminated detector ]

======================================================================


====== Table of the duration information =============================

        Value   tstart    tstop
T100  303.960  -11.648  292.312
T90   266.400   -0.716  265.684
T50    63.860    5.784   69.644
Peak    1.000    6.456    7.456


====== Spectral Analysis Summary =====================================

Model      : spectral model: simple power-law (PL) and cutoff power-law (CPL)
Ph_index   : photon index: E^{Ph_index}
Ph_90err   : 90% error of the photon index
Epeak      : Epeak in keV
Epeak_90err: 90% error of Epeak
Norm       : normalization at 50 keV in both the PL model and CPL model
Nomr_90err : 90% error of the normalization
chi2       : Chi-Squared
dof        : degree of freedo

=== Time-averaged spectral analysis ===
(Best model with acceptable fit: PL)

Model Ph_index Ph_90err_low Ph_90err_hi  Epeak  Epeak_90err_low  Epeak_90err_hi  Norm       Nomr_90err_low    Norm_90err_hi    chi2    dof
PL      -1.583    -0.066      0.065       -           -               -         1.98e-03     -6.63e-05          6.62e-05      55.910   57
CPL     -1.582    -0.065      0.200     9998.590    -9998.590      -9998.590      1.98e-03     -6.31e-05          4.81e-04      55.920   56


=== 1-s peak spectral analysis ===
(Best model with acceptable fit: PL)

Model Ph_index Ph_90err_low Ph_90err_hi  Epeak  Epeak_90err_low  Epeak_90err_hi  Norm       Nomr_90err_low    Norm_90err_hi    chi2    dof
PL      -1.302     -0.087     0.087       -           -               -         3.15e-02     -1.53e-03          1.53e-03      34.020   57
CPL     -1.182     -0.165     0.337      355.416    -355.416      -355.416      3.60e-02     -5.83e-03          1.61e-02      33.600   56


=== Fluence/Peak Flux Summary ===

              Model    Band1     Band2     Band3     Band4     Band5     Total
                       15-25     25-50    50-100    100-350    15-150    15-350    keV
Fluence         PL   8.32e-07  1.45e-06  1.94e-06  5.30e-06  5.65e-06  9.52e-06   erg/cm2
      90%_error_low -5.18e-08 -5.16e-08 -8.76e-08 -5.25e-07 -2.04e-07 -5.82e-07   erg/cm2
      90%_error_hi   5.31e-08  5.14e-08  8.75e-08  5.65e-07  2.05e-07  6.15e-07   erg/cm2
Peak flux       PL   1.07e+00  1.21e+00  9.84e-01  1.33e+00  3.75e+00  4.60e+00   ph/cm2/s
      90%_error_low -9.48e-02 -6.55e-02 -5.91e-02 -1.62e-01 -1.84e-01 -2.34e-01   ph/cm2/s
      90%_error_hi   9.75e-02  6.51e-02  5.87e-02  1.76e-01  1.84e-01  2.36e-01   ph/cm2/s

Fluence        CPL   8.32e-07  1.45e-06  1.94e-06  5.55e-06  5.67e-06  9.50e-06   erg/cm2
      90%_error_low    N/A    -4.05e-08 -8.75e-08 -1.73e-06 -3.13e-07 -1.43e-06   erg/cm2
      90%_error_hi     N/A     6.93e-08  9.59e-08  -1.76e-07  1.60e-07  3.10e-07   erg/cm2
Peak flux      CPL   1.05e+00  1.23e+00  9.95e-01  1.15e+00  3.73e+00  4.42e+00   ph/cm2/s
      90%_error_low -1.15e-01 -7.19e-02 -6.55e-02 -3.63e-01 -1.92e-01 -4.17e-01   ph/cm2/s
      90%_error_hi   1.00e-01  7.37e-02  6.66e-02  2.26e-01  1.92e-01  3.40e-01   ph/cm2/s

======================================================================
Image
Pre-slew 15.0-350.0 keV image (Event data)
#   RAcent    DECcent   POSerr    Theta     Phi              Peak Cts       SNR   Name
  251.3375    44.8384   0.0030     5.3043   -66.3588         4.3165268     64.356 TRIG_00357512

Foreground time interval of the image:
-11.648  11.349 (delta_t =  22.997 [sec])
Background time interval of the image:
-239.552 -11.648 (delta_t = 227.904 [sec])
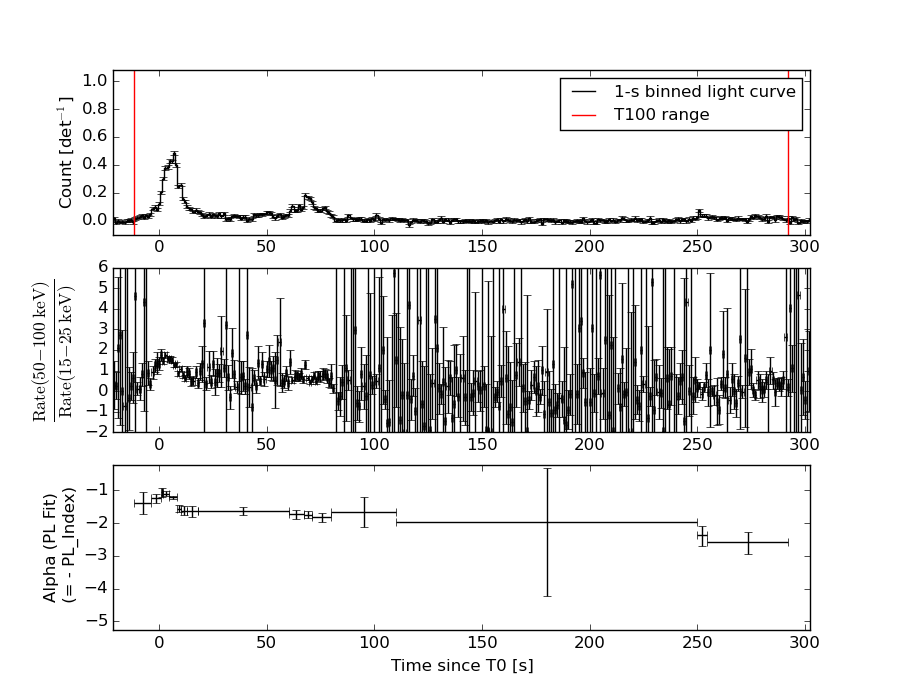
Light Curves
Note: The mask-weighted lightcurves have units of either count/det or counts/sec/det, where a det is 0.4 x 0.4 = 0.16 sq cm.
Full-time range; 1 s binning
Other quick-look light curves:
- 64 ms binning (zoomed)
- 16 ms binning (zoomed)
- 8 ms binning (zoomed)
- 2 ms binning (zoomed)
- SN=5 or 10 s binning (full-time range)
- Raw light curve
Spectra
- 64 ms binning (zoomed)
- 16 ms binning (zoomed)
- 8 ms binning (zoomed)
- 2 ms binning (zoomed)
- SN=5 or 10 s binning (full-time range)
- Raw light curve
Spectra
Notes:
- 1) The fitting includes the systematic errors.
- 2) When the burst includes telescope slew time periods, the fitting uses an average response file made from multiple 5-s response files through out the slew time plus single time preiod for the non-slew times, and weighted by the total counts in the corresponding time period using addrmf. An average response file is needed becuase a spectral fit using the pre-slew DRM will introduce some errors in both a spectral shape and a normalization if the PHA file contains a lot of the slew/post-slew time interval.
- 3) For fits to more complicated models (e.g. a power-law over a cutoff power-law), the BAT team has decided to require a chi-square improvement of more than 6 for each extra dof.
Time averaged spectrum fit using the average DRM
Power-law model
Time interval is from  -11.648 sec. to  292.312 sec.

Spectral model in power-law:
------------------------------------------------------------
Parameters  : value       lower 90%   higher 90%
Photon index: -1.58334     ( -0.0656361   0.0653594 )
Norm@50keV  : 1.98167E-03    ( -6.63333e-05   6.61417e-05 )
------------------------------------------------------------
#Fit statistic : Chi-Squared =          55.91 using 59 PHA bins.
# Reduced chi-squared =         0.9809 for     57 degrees of freedom
# Null hypothesis probability =   5.160123e-01

Photon flux (15-150 keV)    in 304 sec: 0.253366 ( -0.008805  0.008839 ) ph/cm2/s
Energy fluence (15-150 keV)             : 5.64656e-06 ( -2.04243e-07  2.05029e-07 ) ergs/cm2
Cutoff power-law model

Time interval is from  -11.648 sec. to  292.312 sec.
Spectral model in the cutoff power-law:
------------------------------------------------------------
Parameters  : value       lower 90%   higher 90%
Photon index: -1.5819     ( -0.0654635   0.199792 )
Epeak [keV] : 9998.59      ( -9998.98 -9998.98 )
Norm@50keV  : 1.98441E-03    ( -6.50804e-05   0.000479222 )
------------------------------------------------------------
#Fit statistic : Chi-Squared =          55.92 using 59 PHA bins.
# Reduced chi-squared =         0.9986 for     56 degrees of freedom
# Null hypothesis probability =   4.777143e-01

Photon flux (15-150 keV)    in 304 sec: 0.254179 (    ) ph/cm2/s
Energy fluence (15-150 keV)             : 5.67158e-06 ( -3.13071e-07  1.60103e-07 ) ergs/cm2
1-s peak spectrum fit
Power-law model

Time interval is from    6.456 sec. to    7.456 sec.

Spectral model in power-law:
------------------------------------------------------------
Parameters  : value       lower 90%   higher 90%
Photon index: -1.30238     ( -0.0867113   0.0865943 )
Norm@50keV  : 3.14592E-02    ( -0.00152852   0.00152595 )
------------------------------------------------------------
#Fit statistic : Chi-Squared =          34.02 using 59 PHA bins.
# Reduced chi-squared =         0.5968 for     57 degrees of freedom
# Null hypothesis probability =   9.932992e-01

Photon flux (15-150 keV)    in 1 sec: 3.75485 ( -0.18366  0.18378 ) ph/cm2/s
Energy fluence (15-150 keV)             : 3.10728e-07 ( -1.71929e-08  1.72993e-08 ) ergs/cm2
Cutoff power-law model
Time interval is from    6.456 sec. to    7.456 sec.
Spectral model in the cutoff power-law:
------------------------------------------------------------
Parameters  : value       lower 90%   higher 90%
Photon index: -1.18236     ( -0.164531   0.3374 )
Epeak [keV] : 355.416      ( -355.426 -355.426 )
Norm@50keV  : 3.60118E-02    ( -0.0058292   0.0160748 )
------------------------------------------------------------
#Fit statistic : Chi-Squared =          33.60 using 59 PHA bins.
# Reduced chi-squared =         0.6001 for     56 degrees of freedom
# Null hypothesis probability =   9.923493e-01

Photon flux (15-150 keV)    in 1 sec: 3.73359 ( -0.19192  0.19166 ) ph/cm2/s
Energy fluence (15-150 keV)             : 3.07886e-07 ( -1.88846e-08  1.87695e-08 ) ergs/cm2
Time-resolved spectra
Distribution
T90 vs. Hardness ratio plot
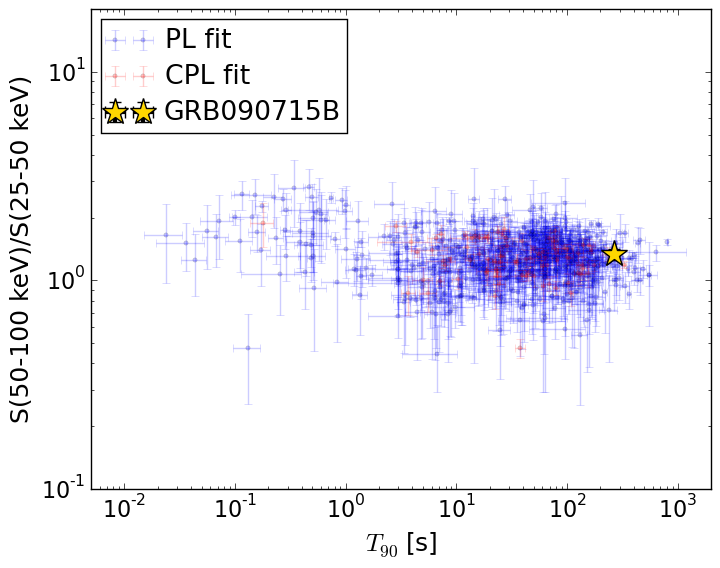
T90                                   = 266.4 sec.
Hardness ratio (energy fluence ratio) = 1.33484222076
S(15-50 keV) vs. S(50-150 keV) plot
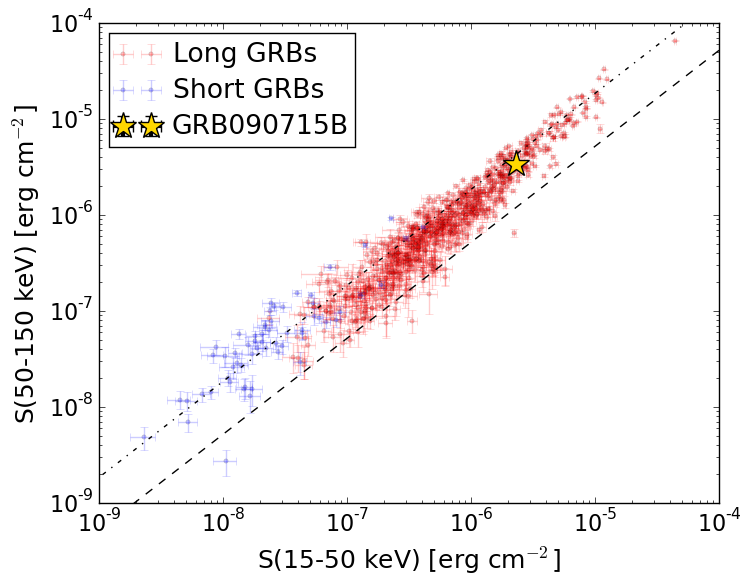
S(15-50 keV)  = 2.2845542e-06
S(50-150 keV) = 3.361926e-06
The dash-dotted line and the dashed line traces the fluences calculated from the Band function with Epeak = 15 and 150 keV, respectively. Both lines assume a canonical values of alpha = -1 and beta = -2.5.
Mask shadow pattern
IMX = 3.723090554828558E-02, IMY = 8.505123562137634E-02
Spacecraft aspect plot
Bright source in the pre-burst/pre-slew/post-slew images
Pre-burst image of 15-350 keV band
Time interval of the image:
-239.552000 -11.648000

# RAcent  DECcent POSerr Theta    Phi  PeakCts   SNR AngSep     Name
#  [deg]    [deg]    ['] [deg]  [deg]                   [']
254.4236  35.5138    8.3   4.3  119.7   0.2851   1.4   10.4	Her X-1
299.5914  35.2086    0.5  36.5   32.3   7.6563  24.9    0.4	Cyg X-1
308.0852  40.9844    2.5  40.9   20.1   1.6297   4.7    2.2	Cyg X-3
326.1619  38.4147    2.7  54.8   16.5   4.6408   4.2    5.6	Cyg X-2
245.7439  -2.1866    3.6  42.6  141.6   1.8225   3.2 ------	UNKNOWN
194.1889  26.0966    4.6  50.6 -136.5   2.9885   2.5 ------	UNKNOWN
Pre-slew background subtracted image of 15-350 keV band
Time interval of the image:
-11.648000 11.348600

# RAcent  DECcent POSerr Theta    Phi  PeakCts   SNR AngSep     Name
#  [deg]    [deg]    ['] [deg]  [deg]                   [']
254.3117  35.2517    4.6   4.6  121.4   0.1664   2.5    9.0	Her X-1
299.7599  35.2461   20.3  36.6   32.2   0.0673   0.6    8.7	Cyg X-1
308.0752  41.0681    4.6  40.9   20.0  -0.3081  -2.5    7.1	Cyg X-3
326.3923  38.4176   13.2  55.0   16.4   0.3831   0.9   11.9	Cyg X-2
245.4130  -4.8718    2.3  45.3  141.5   1.1906   4.9 ------	UNKNOWN
232.6680  -7.7150    2.4  51.2  157.0   1.4431   4.8 ------	UNKNOWN
251.3375  44.8384    0.2   5.3  -66.4   4.3166  64.4 ------	UNKNOWN
339.8019  62.0467    2.2  54.0  -14.5   1.0474   5.2 ------	UNKNOWN
209.6817  35.0303    2.5  34.8 -133.5   0.4551   4.5 ------	UNKNOWN
Post-slew image of 15-350 keV band
Time interval of the image:
32.948600 489.348620

# RAcent  DECcent POSerr Theta    Phi  PeakCts   SNR AngSep     Name
#  [deg]    [deg]    ['] [deg]  [deg]                   [']
254.6063  35.4285    3.7   9.7  115.8   1.0915   3.1    8.9	Her X-1
299.5940  35.1905    0.4  37.6   39.3  16.8283  27.4    0.7	Cyg X-1
308.1345  40.9833    4.4  40.9   26.3   1.6363   2.6    2.1	Cyg X-3
251.3364  44.8292    0.9   0.0 -126.3   4.1303  12.7 ------	UNKNOWN
246.0242  46.1086    2.9   4.0 -117.5   1.3407   3.9 ------	UNKNOWN
226.0398  47.2807    2.5  17.7 -121.3   1.5712   4.6 ------	UNKNOWN
192.2835  19.0447    4.3  54.9 -146.1   8.0657   2.7 ------	UNKNOWN