Analysis Summary
Notes:
- 1) No attempt has been made to eliminate the non-significant decimal places.
- 2) This batgrbproduct analysis is done using the HEASARC data.
- 3) This batgrbproduct analysis is using the flight position for the mask-weighting calculation.
======================================================================
BAT GRB EVENT DATA PROCESSING REPORT
Process Script Ver: batgrbproduct v2.46
Process Start Time: Sun Jan 19 15:01:08 EST 2014
Host Name: batevent1
Current Working Dir: /local/data/batevent/batevent_reproc/trigger358520
======================================================================
Trigger: 00358520 Segment: 000
BAT Trigger Time: 270427342.976 [s; MET]
Trigger Stop: 270427345.024 [s; MET]
UTC: 2009-07-27T22:42:18.028360 [includes UTCF correction]
Where From?: TDRSS position message
BAT
RA: 315.97210799452 Dec: 64.9160517614425 [deg; J2000]
Catalogged Source?: NO
Point Source?: YES
GRB Indicated?: YES [ by BAT flight software ]
Image S/N Ratio: 8.11
Image Trigger?: NO
Rate S/N Ratio: 7.48331477354788 [ if not an image trigger ]
Image S/N Ratio: 8.11
Analysis Position: [ source = BAT ]
RA: 315.97210799452 Dec: 64.9160517614425 [deg; J2000]
Refined Position: [ source = BAT pre-slew burst ]
RA: 315.921818678116 Dec: 64.9389225031386 [deg; J2000]
{ 21h 03m 41.2s , +64d 56' 20.1" }
+/- 2.23051518935367 [arcmin] (estimated 90% radius based on SNR)
+/- 1.45813174522031 [arcmin] (formal 1-sigma fit error)
SNR: 9.66933678508391
Angular difference between the analysis and refined position is 1.875634 arcmin
Partial Coding Fraction: 0.8359375 [ including projection effects ]
Duration
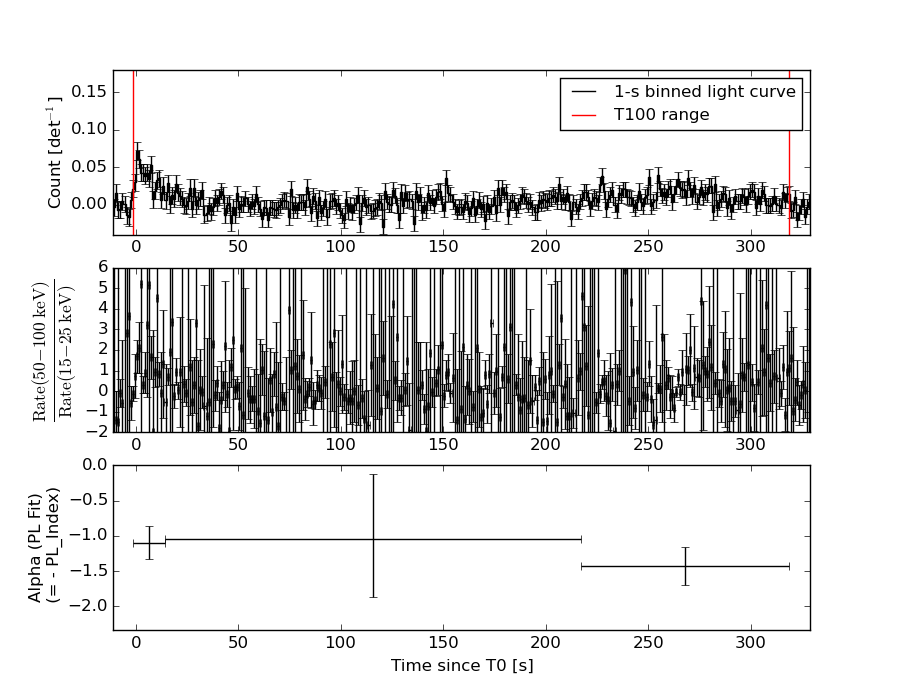
T90: 301.879999995232 +/- 22.9214466904804
Measured from: 0.891999959945679
to: 302.771999955177 [s; relative to TRIGTIME]
T50: 119.60799998045 +/- 135.6643635536
Measured from: 147.367999970913
to: 266.975999951363 [s; relative to TRIGTIME]
Fluence
Peak Flux (peak 1 second)
Measured from: 0.11599999666214
to: 1.11599999666214 [s; relative to TRIGTIME]
Total Fluence
Measured from: -1.3400000333786
to: 318.884000003338 [s; relative to TRIGTIME]
Band 1 Band 2 Band 3 Band 4
15-25 25-50 50-100 100-350 keV
Total 0.564599 0.661182 0.735873 0.154237
0.093052 0.098112 0.091003 0.089337 [error]
Peak 0.017544 0.024198 0.023149 0.016732
0.005652 0.006140 0.005852 0.005497 [error]
[ fluence units of on-axis counts / fully illuminated detector ]
======================================================================
====== Table of the duration information =============================
Value tstart tstop
T100 320.224 -1.340 318.884
T90 301.880 0.892 302.772
T50 119.608 147.368 266.976
Peak 1.000 0.116 1.116
====== Spectral Analysis Summary =====================================
Model : spectral model: simple power-law (PL) and cutoff power-law (CPL)
Ph_index : photon index: E^{Ph_index}
Ph_90err : 90% error of the photon index
Epeak : Epeak in keV
Epeak_90err: 90% error of Epeak
Norm : normalization at 50 keV in both the PL model and CPL model
Nomr_90err : 90% error of the normalization
chi2 : Chi-Squared
dof : degree of freedo
=== Time-averaged spectral analysis ===
(Best model with acceptable fit: PL)
Model Ph_index Ph_90err_low Ph_90err_hi Epeak Epeak_90err_low Epeak_90err_hi Norm Nomr_90err_low Norm_90err_hi chi2 dof
PL -1.237 -0.239 0.242 - - - 4.38e-04 -5.89e-05 5.88e-05 56.590 57
CPL -0.983 -0.480 1.079 209.063 -209.063 -209.063 5.82e-04 -1.99e-04 1.26e-03 56.370 56
=== 1-s peak spectral analysis ===
(Best model with acceptable fit: PL)
Model Ph_index Ph_90err_low Ph_90err_hi Epeak Epeak_90err_low Epeak_90err_hi Norm Nomr_90err_low Norm_90err_hi chi2 dof
PL -1.244 -0.536 0.548 - - - 4.40e-03 -1.23e-03 1.21e-03 65.350 57
CPL -1.257 -0.524 0.865 9999.360 -9999.360 -9999.360 4.39e-03 -1.20e-03 1.27e-02 65.360 56
=== Fluence/Peak Flux Summary ===
Model Band1 Band2 Band3 Band4 Band5 Total
15-25 25-50 50-100 100-350 15-150 15-350 keV
Fluence PL 1.40e-07 3.02e-07 5.13e-07 2.00e-06 1.41e-06 2.96e-06 erg/cm2
90%_error_low -3.32e-08 -4.46e-08 -8.78e-08 -6.62e-07 -2.17e-07 -7.35e-07 erg/cm2
90%_error_hi 3.54e-08 4.38e-08 8.68e-08 8.70e-07 2.21e-07 9.15e-07 erg/cm2
Peak flux PL 1.42e-01 1.66e-01 1.40e-01 2.01e-01 5.20e-01 6.49e-01 ph/cm2/s
90%_error_low -6.84e-02 -5.25e-02 -5.02e-02 -1.18e-01 -1.42e-01 -1.89e-01 ph/cm2/s
90%_error_hi 7.80e-02 4.95e-02 4.81e-02 2.02e-01 1.42e-01 2.08e-01 ph/cm2/s
Fluence CPL 1.33e-07 3.10e-07 5.23e-07 1.36e-06 1.38e-06 2.33e-06 erg/cm2
90%_error_low -4.14e-08 -4.98e-08 -9.38e-08 -9.59e-07 -2.41e-07 -9.92e-07 erg/cm2
90%_error_hi 4.03e-08 5.29e-08 9.76e-08 8.24e-07 2.36e-07 1.12e-06 erg/cm2
Peak flux CPL 1.49e-01 1.66e-01 1.37e-01 2.27e-01 5.20e-01 6.82e-01 ph/cm2/s
90%_error_low N/A N/A N/A N/A -1.42e-01 -3.14e-01 ph/cm2/s
90%_error_hi N/A N/A N/A N/A 1.42e-01 2.22e-01 ph/cm2/s
======================================================================
Image
Pre-slew 15.0-350.0 keV image (Event data)
#   RAcent    DECcent   POSerr    Theta     Phi              Peak Cts       SNR   Name
  315.9218    64.9389   0.0199    21.0889   147.1399         0.7180291      9.669 TRIG_00358520

Foreground time interval of the image:
 -1.340  29.725 (delta_t =  31.065 [sec])
Background time interval of the image:
-82.275  -1.340 (delta_t =  80.935 [sec])
Light Curves
Note: The mask-weighted lightcurves have units of either count/det or counts/sec/det, where a det is 0.4 x 0.4 = 0.16 sq cm.
Full-time range; 1 s binning
Other quick-look light curves:
- 64 ms binning (zoomed)
- 16 ms binning (zoomed)
- 8 ms binning (zoomed)
- 2 ms binning (zoomed)
- SN=5 or 10 s binning (full-time range)
- Raw light curve
Spectra
- 64 ms binning (zoomed)
- 16 ms binning (zoomed)
- 8 ms binning (zoomed)
- 2 ms binning (zoomed)
- SN=5 or 10 s binning (full-time range)
- Raw light curve
Spectra
Notes:
- 1) The fitting includes the systematic errors.
- 2) When the burst includes telescope slew time periods, the fitting uses an average response file made from multiple 5-s response files through out the slew time plus single time preiod for the non-slew times, and weighted by the total counts in the corresponding time period using addrmf. An average response file is needed becuase a spectral fit using the pre-slew DRM will introduce some errors in both a spectral shape and a normalization if the PHA file contains a lot of the slew/post-slew time interval.
- 3) For fits to more complicated models (e.g. a power-law over a cutoff power-law), the BAT team has decided to require a chi-square improvement of more than 6 for each extra dof.
Time averaged spectrum fit using the average DRM
Power-law model
Time interval is from   -1.340 sec. to  318.884 sec.

Spectral model in power-law:
------------------------------------------------------------
Parameters  : value       lower 90%   higher 90%
Photon index: -1.23652     ( -0.239354   0.241628 )
Norm@50keV  : 4.38081E-04    ( -5.88908e-05   5.87693e-05 )
------------------------------------------------------------
#Fit statistic : Chi-Squared =          56.59 using 59 PHA bins.
# Reduced chi-squared =         0.9928 for     57 degrees of freedom
# Null hypothesis probability =   4.903321e-01

Photon flux (15-150 keV)    in 320.2 sec: 5.17021E-02 ( -0.0069781  0.0069889 ) ph/cm2/s
Energy fluence (15-150 keV)             : 1.40903e-06 ( -2.16965e-07  2.20605e-07 ) ergs/cm2
Cutoff power-law model
Time interval is from   -1.340 sec. to  318.884 sec.
Spectral model in the cutoff power-law:
------------------------------------------------------------
Parameters  : value       lower 90%   higher 90%
Photon index: -0.982891     ( -0.479816   1.0787 )
Epeak [keV] : 209.063      ( -209.058 -209.058 )
Norm@50keV  : 5.82383E-04    ( -0.000198532   0.00126255 )
------------------------------------------------------------
#Fit statistic : Chi-Squared =          56.37 using 59 PHA bins.
# Reduced chi-squared =          1.007 for     56 degrees of freedom
# Null hypothesis probability =   4.611326e-01

Photon flux (15-150 keV)    in 320.2 sec: 5.10696E-02 ( -0.0073832  0.0073118 ) ph/cm2/s
Energy fluence (15-150 keV)             : 1.38016e-06 ( -2.41381e-07  2.3617e-07 ) ergs/cm2
1-s peak spectrum fit
Power-law model
Time interval is from    0.116 sec. to    1.116 sec.

Spectral model in power-law:
------------------------------------------------------------
Parameters  : value       lower 90%   higher 90%
Photon index: -1.2443     ( -0.536156   0.548423 )
Norm@50keV  : 4.40228E-03    ( -0.00122621   0.00120627 )
------------------------------------------------------------
#Fit statistic : Chi-Squared =          65.35 using 59 PHA bins.
# Reduced chi-squared =          1.147 for     57 degrees of freedom
# Null hypothesis probability =   2.093578e-01

Photon flux (15-150 keV)    in 1 sec: 0.520194 ( -0.141873  0.142139 ) ph/cm2/s
Energy fluence (15-150 keV)             : 4.41296e-08 ( -1.41739e-08  1.46897e-08 ) ergs/cm2
Cutoff power-law model
Time interval is from    0.116 sec. to    1.116 sec.
Spectral model in the cutoff power-law:
------------------------------------------------------------
Parameters  : value       lower 90%   higher 90%
Photon index: -1.25653     ( -0.524904   0.863628 )
Epeak [keV] : 9999.36      ( -9999.36 -9999.36 )
Norm@50keV  : 4.38886E-03    ( -0.00122885   0.0126858 )
------------------------------------------------------------
#Fit statistic : Chi-Squared =          65.36 using 59 PHA bins.
# Reduced chi-squared =          1.167 for     56 degrees of freedom
# Null hypothesis probability =   1.836077e-01

Photon flux (15-150 keV)    in 1 sec: 0.520109 ( -0.14201  0.142074 ) ph/cm2/s
Energy fluence (15-150 keV)             : 4.43803e-08 ( -1.76533e-08  7.31844e-09 ) ergs/cm2
Time-resolved spectra
Distribution
T90 vs. Hardness ratio plot
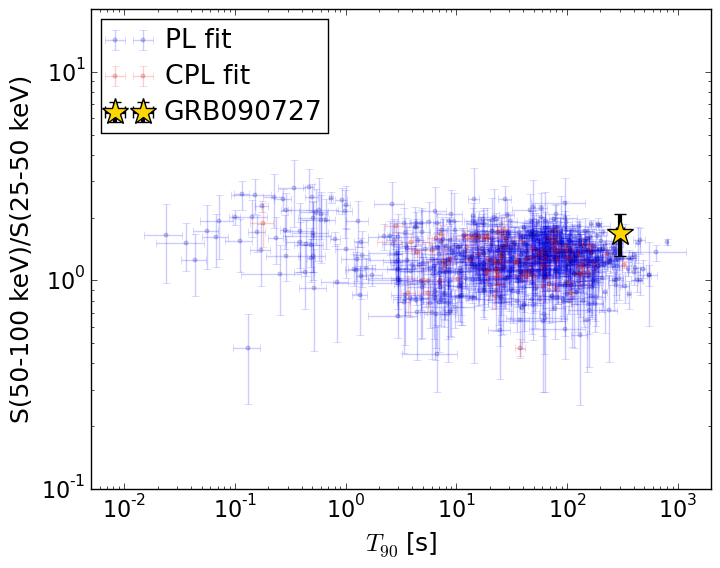
T90                                   = 301.88 sec.
Hardness ratio (energy fluence ratio) = 1.69761804141
S(15-50 keV) vs. S(50-150 keV) plot
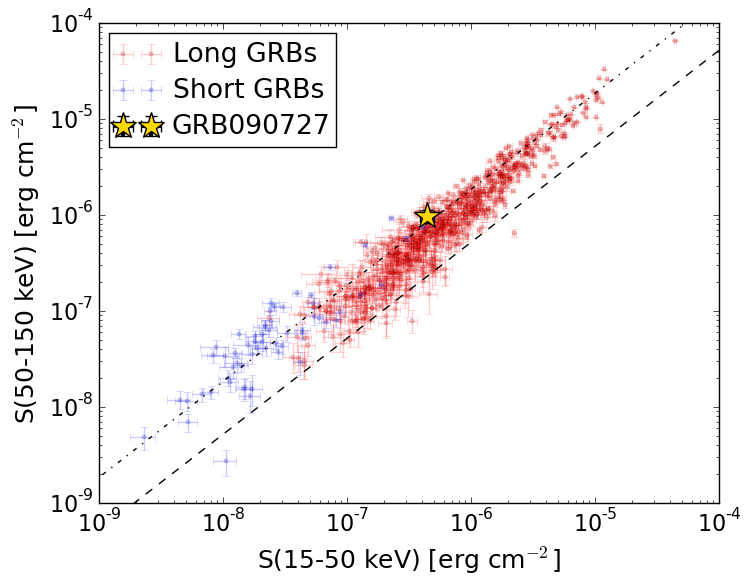
S(15-50 keV)  = 4.424141e-07
S(50-150 keV) = 9.666454e-07
The dash-dotted line and the dashed line traces the fluences calculated from the Band function with Epeak = 15 and 150 keV, respectively. Both lines assume a canonical values of alpha = -1 and beta = -2.5.
Mask shadow pattern
IMX = -3.239411333196693E-01, IMY = -2.092473103160312E-01
Spacecraft aspect plot
Bright source in the pre-burst/pre-slew/post-slew images
Pre-burst image of 15-350 keV band
Time interval of the image:
-82.275410 -1.340000

# RAcent  DECcent POSerr Theta    Phi  PeakCts   SNR AngSep     Name
#  [deg]    [deg]    ['] [deg]  [deg]                   [']
308.0723  40.9567    9.1  40.2  115.8   0.4921   1.3    1.7	Cyg X-3
326.3653  38.3582   40.5  34.8   93.9  -0.0687  -0.3    9.4	Cyg X-2
 34.7687  12.6022    2.4  55.2   -2.3   1.7690   4.9 ------	UNKNOWN
Pre-slew background subtracted image of 15-350 keV band
Time interval of the image:
-1.340000 29.724610

# RAcent  DECcent POSerr Theta    Phi  PeakCts   SNR AngSep     Name
#  [deg]    [deg]    ['] [deg]  [deg]                   [']
308.0877  40.9900    9.9  40.2  115.8  -0.3369  -1.2    2.5	Cyg X-3
326.1025  38.3327   46.1  35.0   94.2  -0.0413  -0.2    3.3	Cyg X-2
283.0275  46.7652    2.3  46.3  142.0   1.3647   5.1 ------	UNKNOWN
315.9222  64.9389    1.2  21.1  147.1   0.7182   9.7 ------	UNKNOWN
  1.1219  55.7185    2.3   8.8   51.5   0.3110   5.0 ------	UNKNOWN
244.6102  62.9489    2.3  45.8  179.5   0.6681   5.1 ------	UNKNOWN
  9.9266  72.7717    2.2   8.7 -140.7   0.3537   5.2 ------	UNKNOWN
 37.4428  24.8226    1.9  44.2  -10.1   0.6936   5.9 ------	UNKNOWN
 40.8222  32.7775    2.1  37.9  -18.7   0.4882   5.5 ------	UNKNOWN
 46.8794  34.8059    2.0  38.2  -27.5   0.5443   5.9 ------	UNKNOWN
 60.3645  43.9618    2.3  36.0  -50.3   0.5586   5.1 ------	UNKNOWN
Post-slew image of 15-350 keV band
Time interval of the image:
72.124600 303.924600

# RAcent  DECcent POSerr Theta    Phi  PeakCts   SNR AngSep     Name
#  [deg]    [deg]    ['] [deg]  [deg]                   [']
254.3845  35.3631   22.8  46.5  163.6   0.2722   0.5    3.8	Her X-1
299.5913  35.1912    0.4  31.3  108.4   9.8884  25.7    0.6	Cyg X-1
308.0525  40.9755    5.2  24.4   96.7   0.6029   2.2    3.0	Cyg X-3
326.2633  38.4555   14.3  27.1   64.2   0.2219   0.8    9.1	Cyg X-2
316.8272  45.7732    3.0  19.2   80.2   0.8516   3.8 ------	UNKNOWN
260.5469  40.3532    3.0  39.7  161.4   1.3333   3.9 ------	UNKNOWN
  3.4724  36.2927    2.2  39.9   14.2   1.6362   5.2 ------	UNKNOWN
284.0667  51.8160    2.3  20.9  148.5   1.1270   4.9 ------	UNKNOWN
288.5525  54.9880    4.0  16.7  148.7   0.6146   2.9 ------	UNKNOWN
315.8854  64.8742    1.7   0.1  128.4   1.3084   6.8 ------	UNKNOWN
245.9381  67.1926    2.5  27.0 -151.4   0.9430   4.6 ------	UNKNOWN
212.4442  49.7283    2.2  51.2 -151.8   3.0497   5.2 ------	UNKNOWN