Analysis Summary
Notes:
- 1) No attempt has been made to eliminate the non-significant decimal places.
- 2) This batgrbproduct analysis is done using the HEASARC data.
- 3) This batgrbproduct analysis is using the flight position for the mask-weighting calculation.
======================================================================
                  BAT GRB EVENT DATA PROCESSING REPORT
    Process Script Ver: batgrbproduct v2.46
    Process Start Time: Sun Jan 19 14:56:29 EST 2014
             Host Name: batevent1
   Current Working Dir: /local/data/batevent/batevent_reproc/trigger358574
======================================================================

  Trigger: 00358574      Segment: 000

  BAT Trigger Time: 270485150.912   [s; MET]
      Trigger Stop: 270485155.008   [s; MET]
               UTC: 2009-07-28T14:45:45.962500    [includes UTCF correction]
       Where From?: TDRSS position message

  BAT
    RA: 29.6601612956258   Dec: 41.6470928113711  [deg; J2000]

     Catalogged Source?: NO
     Point Source?:      YES
     GRB Indicated?:     YES    [ by BAT flight software ]
     Image S/N Ratio:    9.64
     Image Trigger?:     NO
     Rate S/N Ratio:     10.9544511501033  [ if not an image trigger ]
     Image S/N Ratio:    9.64

  Analysis Position:   [ source = BAT ]
    RA: 29.6601612956258   Dec: 41.6470928113711  [deg; J2000]

  Refined Position:   [ source = BAT pre-slew burst ]
    RA: 29.6413409875335   Dec: 41.6359884040569  [deg; J2000]
        { 01h 58m 33.9s , +41d 38' 09.6" }
         +/- 1.96264779750396 [arcmin] (estimated 90% radius based on SNR)
         +/- 1.31155149352086 [arcmin] (formal 1-sigma fit error)
    SNR: 11.6083938736816

  Angular difference between the analysis and refined position is 1.075197 arcmin

  Partial Coding Fraction: 0.3789062    [ including projection effects ]

  Duration
     T90: 64 +/- 35.7770876399966
        Measured from: -15.9120000004768
                   to: 48.0879999995232     [s; relative to TRIGTIME]
     T50: 16 +/- 22.6274169979695
        Measured from: 0.0879999995231628
                   to: 16.0879999995232     [s; relative to TRIGTIME]


  Fluence
     Peak Flux  (peak 1 second)
        Measured from: 7.58799999952316
                   to: 8.58799999952316     [s; relative to TRIGTIME]
     Total Fluence
        Measured from: -15.9120000004768
                   to: 64.0879999995232     [s; relative to TRIGTIME]

             Band 1     Band 2     Band 3     Band 4
              15-25      25-50     50-100    100-350     keV
 Total     0.629376   0.637135   0.420777   0.109452
           0.082473   0.084709   0.075338   0.065800 [error]
 Peak      0.009663   0.005832   0.002438   0.007397
           0.009944   0.009919   0.008997   0.007737 [error]

     [ fluence units of on-axis counts / fully illuminated detector ]

======================================================================


====== Table of the duration information =============================

        Value   tstart    tstop
T100   80.000  -15.912   64.088
T90    64.000  -15.912   48.088
T50    16.000    0.088   16.088
Peak    1.000    7.588    8.588


====== Spectral Analysis Summary =====================================

Model      : spectral model: simple power-law (PL) and cutoff power-law (CPL)
Ph_index   : photon index: E^{Ph_index}
Ph_90err   : 90% error of the photon index
Epeak      : Epeak in keV
Epeak_90err: 90% error of Epeak
Norm       : normalization at 50 keV in both the PL model and CPL model
Nomr_90err : 90% error of the normalization
chi2       : Chi-Squared
dof        : degree of freedo

=== Time-averaged spectral analysis ===
(Best model with acceptable fit: PL)

Model Ph_index Ph_90err_low Ph_90err_hi  Epeak  Epeak_90err_low  Epeak_90err_hi  Norm       Nomr_90err_low    Norm_90err_hi    chi2    dof
PL      -1.922    -0.260      0.243       -           -               -         1.48e-03     -2.42e-04          2.35e-04      56.740   57
CPL     -1.556    -0.641      1.036       55.798     -55.746       -55.798      2.34e-03     -1.30e-03          6.02e-03      56.220   56


=== 1-s peak spectral analysis ===
(Best model with acceptable fit: N/A)

Model Ph_index Ph_90err_low Ph_90err_hi  Epeak  Epeak_90err_low  Epeak_90err_hi  Norm       Nomr_90err_low    Norm_90err_hi    chi2    dof
PL      -2.725      2.725     2.725       -           -               -         1.10e-03     -1.10e-03          2.31e-03      67.920   57
CPL     -1.903      N/A       N/A           3.862      N/A           N/A         3.87e-03        N/A               N/A         67.940   56


=== Fluence/Peak Flux Summary ===

              Model    Band1     Band2     Band3     Band4     Band5     Total
                       15-25     25-50    50-100    100-350    15-150    15-350    keV
Fluence         PL   2.25e-07  3.20e-07  3.38e-07  6.59e-07  1.09e-06  1.54e-06   erg/cm2
      90%_error_low -4.47e-08 -4.35e-08 -7.37e-08 -2.50e-07 -1.71e-07 -3.36e-07   erg/cm2
      90%_error_hi   4.65e-08  4.35e-08  7.42e-08  3.32e-07  1.73e-07  3.97e-07   erg/cm2
Peak flux       PL   1.49e-01  7.36e-02  2.23e-02  8.55e-03  2.50e-01  2.54e-01   ph/cm2/s
      90%_error_low -1.49e-01 -7.36e-02 -2.23e-02 -8.55e-03 -2.50e-01 -2.54e-01   ph/cm2/s
      90%_error_hi   1.90e-01  9.42e-02  7.45e-02  5.08e-01  2.74e-01  2.84e-01   ph/cm2/s

Fluence        CPL   2.15e-07  3.35e-07  3.42e-07  3.72e-07  1.06e-06  1.26e-06   erg/cm2
      90%_error_low -5.15e-08 -1.20e-07 -7.88e-08 -2.71e-07 -1.82e-07 -3.42e-07   erg/cm2
      90%_error_hi   4.77e-08  5.66e-08  7.97e-08  3.71e-07  1.85e-07  5.32e-07   erg/cm2
Peak flux      CPL   1.39e-01  7.86e-02    N/A    2.08e-03  2.46e-01  2.46e-01   ph/cm2/s
      90%_error_low -1.39e-01 -7.86e-02 -2.23e-02 -2.08e-03 -2.46e-01     N/A     ph/cm2/s
      90%_error_hi   1.51e-01  9.49e-02  7.45e-02  1.17e-01  2.70e-01     N/A     ph/cm2/s

======================================================================
Image
Pre-slew 15.0-350.0 keV image (Event data)
#   RAcent    DECcent   POSerr    Theta     Phi              Peak Cts       SNR   Name
   29.6413    41.6360   0.0167    46.3187   -15.2023         1.7781422     11.608 TRIG_00358574

Foreground time interval of the image:
-15.912  37.789 (delta_t =  53.701 [sec])
Background time interval of the image:
-239.912 -15.912 (delta_t = 224.000 [sec])
Light Curves
Note: The mask-weighted lightcurves have units of either count/det or counts/sec/det, where a det is 0.4 x 0.4 = 0.16 sq cm.
Full-time range; 1 s binning
Other quick-look light curves:
- 64 ms binning (zoomed)
- 16 ms binning (zoomed)
- 8 ms binning (zoomed)
- 2 ms binning (zoomed)
- SN=5 or 10 s binning (full-time range)
- Raw light curve
Spectra
- 64 ms binning (zoomed)
- 16 ms binning (zoomed)
- 8 ms binning (zoomed)
- 2 ms binning (zoomed)
- SN=5 or 10 s binning (full-time range)
- Raw light curve
Spectra
Notes:
- 1) The fitting includes the systematic errors.
- 2) When the burst includes telescope slew time periods, the fitting uses an average response file made from multiple 5-s response files through out the slew time plus single time preiod for the non-slew times, and weighted by the total counts in the corresponding time period using addrmf. An average response file is needed becuase a spectral fit using the pre-slew DRM will introduce some errors in both a spectral shape and a normalization if the PHA file contains a lot of the slew/post-slew time interval.
- 3) For fits to more complicated models (e.g. a power-law over a cutoff power-law), the BAT team has decided to require a chi-square improvement of more than 6 for each extra dof.
Time averaged spectrum fit using the average DRM
Power-law model
Time interval is from  -15.912 sec. to   64.088 sec.

Spectral model in power-law:
------------------------------------------------------------
Parameters  : value       lower 90%   higher 90%
Photon index: -1.92237     ( -0.259919   0.243484 )
Norm@50keV  : 1.48135E-03    ( -0.000241629   0.000234608 )
------------------------------------------------------------
#Fit statistic : Chi-Squared =          56.74 using 59 PHA bins.
# Reduced chi-squared =         0.9955 for     57 degrees of freedom
# Null hypothesis probability =   4.847326e-01

Photon flux (15-150 keV)    in 80 sec: 0.214651 ( -0.029531  0.029564 ) ph/cm2/s
Energy fluence (15-150 keV)             : 1.09003e-06 ( -1.7062e-07  1.73482e-07 ) ergs/cm2
Cutoff power-law model
Time interval is from  -15.912 sec. to   64.088 sec.
Spectral model in the cutoff power-law:
------------------------------------------------------------
Parameters  : value       lower 90%   higher 90%
Photon index: -1.55577     ( -0.640703   1.03588 )
Epeak [keV] : 55.7980      ( -55.7481 -55.8 )
Norm@50keV  : 2.34163E-03    ( -0.00129842   0.00601808 )
------------------------------------------------------------
#Fit statistic : Chi-Squared =          56.22 using 59 PHA bins.
# Reduced chi-squared =          1.004 for     56 degrees of freedom
# Null hypothesis probability =   4.666552e-01

Photon flux (15-150 keV)    in 80 sec: 0.211685 ( -0.03039  0.03035 ) ph/cm2/s
Energy fluence (15-150 keV)             : 1.06189e-06 ( -1.81994e-07  1.84978e-07 ) ergs/cm2
1-s peak spectrum fit
Power-law model
Time interval is from    7.588 sec. to    8.588 sec.

Spectral model in power-law:
------------------------------------------------------------
Parameters  : value       lower 90%   higher 90%
Photon index: -2.72465     ( 2.72465   2.72465 )
Norm@50keV  : 1.10113E-03    ( -0.00110113   0.00230534 )
------------------------------------------------------------
#Fit statistic : Chi-Squared =          67.92 using 59 PHA bins.
# Reduced chi-squared =          1.192 for     57 degrees of freedom
# Null hypothesis probability =   1.525725e-01

Photon flux (15-150 keV)    in 1 sec: 0.249862 ( -0.249862  0.273535 ) ph/cm2/s
Energy fluence (15-150 keV)             : 1.18201e-08 ( 1  1.96951e-08 ) ergs/cm2
Cutoff power-law model
Time interval is from    7.588 sec. to    8.588 sec.
Spectral model in the cutoff power-law:
------------------------------------------------------------
Parameters  : value       lower 90%   higher 90%
Photon index: -1.90334     (       )
Epeak [keV] : 3.86208      (   )
Norm@50keV  : 3.86734E-03    (     )
------------------------------------------------------------
#Fit statistic : Chi-Squared =          67.94 using 59 PHA bins.
# Reduced chi-squared =          1.213 for     56 degrees of freedom
# Null hypothesis probability =   1.316553e-01

Photon flux (15-150 keV)    in 1 sec: 0.245748 ( -0.245748  0.270428 ) ph/cm2/s
Energy fluence (15-150 keV)             : 1.10375e-08 ( 0  0 ) ergs/cm2
Time-resolved spectra
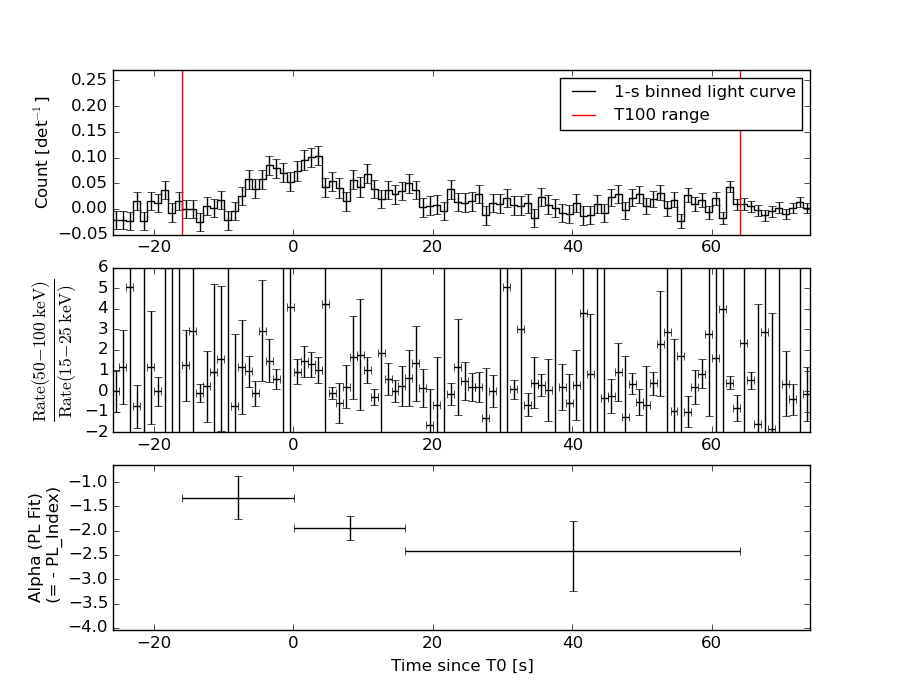
Distribution
T90 vs. Hardness ratio plot
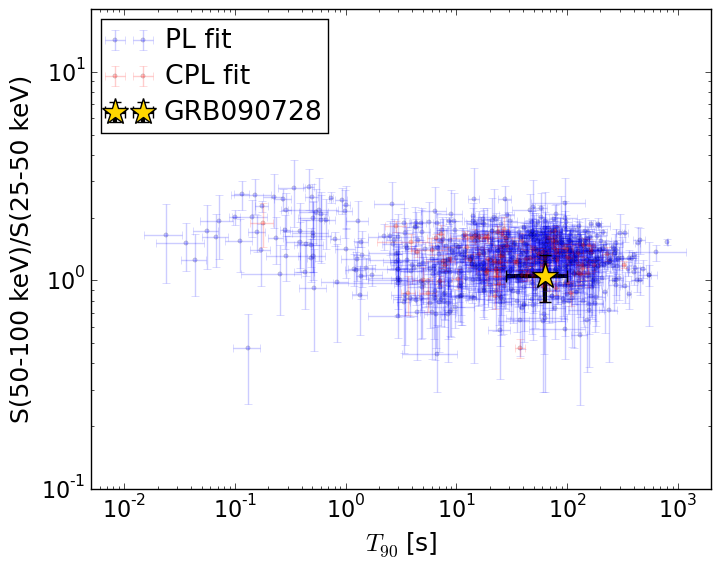
T90                                   = 64.0 sec.
Hardness ratio (energy fluence ratio) = 1.05533387569
S(15-50 keV) vs. S(50-150 keV) plot
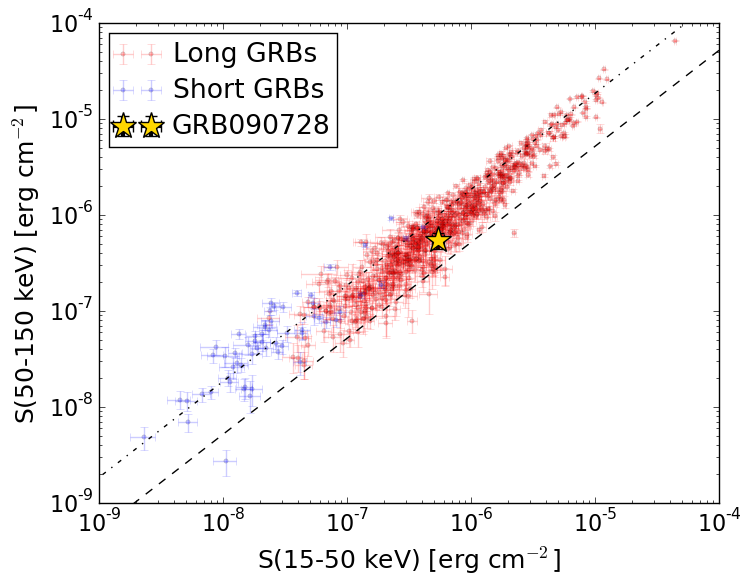
S(15-50 keV)  = 5.456364e-07
S(50-150 keV) = 5.444001e-07
The dash-dotted line and the dashed line traces the fluences calculated from the Band function with Epeak = 15 and 150 keV, respectively. Both lines assume a canonical values of alpha = -1 and beta = -2.5.
Mask shadow pattern
IMX = 1.010480728020026E+00, IMY = 2.745854694665011E-01
Spacecraft aspect plot
Bright source in the pre-burst/pre-slew/post-slew images
Pre-burst image of 15-350 keV band
Time interval of the image:
-239.912000 -15.912000

# RAcent  DECcent POSerr Theta    Phi  PeakCts   SNR AngSep     Name
#  [deg]    [deg]    ['] [deg]  [deg]                   [']
254.4666  35.3864    3.2  46.4  163.6   1.8631   3.6    2.7	Her X-1
299.5904  35.1892    0.4  31.3  108.4  11.3838  30.0    0.7	Cyg X-1
308.0421  41.0875    3.1  24.3   96.7   1.0216   3.7    8.7	Cyg X-3
326.2648  38.2769    5.0  27.3   64.2   0.6346   2.3    5.1	Cyg X-2
269.3530  69.9605    2.6  18.1 -151.3   0.8522   4.5 ------	UNKNOWN
 30.1512  62.5480    2.8  31.0  -38.5   1.0133   4.2 ------	UNKNOWN
214.5007  40.0997    3.8  58.7 -159.2   5.6279   3.1 ------	UNKNOWN
Pre-slew background subtracted image of 15-350 keV band
Time interval of the image:
-15.912000 37.788600

# RAcent  DECcent POSerr Theta    Phi  PeakCts   SNR AngSep     Name
#  [deg]    [deg]    ['] [deg]  [deg]                   [']
254.4948  35.3142    4.8  46.5  163.5  -0.4499  -2.4    2.5	Her X-1
299.4941  35.2184    5.9  31.3  108.5  -0.2842  -2.0    4.8	Cyg X-1
307.9268  40.8076    0.0  24.5   96.8   0.1995   1.7   12.0	Cyg X-3
326.1626  38.4747    9.7  27.1   64.3   0.1362   1.2    9.2	Cyg X-2
263.0012  25.8870    2.5  51.3  149.0   1.9504   4.5 ------	UNKNOWN
 29.6413  41.6359    1.0  46.3  -15.2   1.7786  11.6 ------	UNKNOWN
215.5360  45.9595    2.1  53.3 -156.4   1.2711   5.4 ------	UNKNOWN
Post-slew image of 15-350 keV band
Time interval of the image:
99.788600 962.193500

# RAcent  DECcent POSerr Theta    Phi  PeakCts   SNR AngSep     Name
#  [deg]    [deg]    ['] [deg]  [deg]                   [']
323.9581  46.4829    4.1  46.1  139.2   5.1845   2.8 ------	UNKNOWN
248.7138  78.5284    3.2  57.6 -168.8   9.3524   3.7 ------	UNKNOWN
 97.8304  61.3920    4.2  44.2 -120.7   5.8946   2.8 ------	UNKNOWN