Analysis Summary
Notes:
- 1) No attempt has been made to eliminate the non-significant decimal places.
- 2) This batgrbproduct analysis is done using the HEASARC data.
- 3) This batgrbproduct analysis is using the flight position for the mask-weighting calculation.
======================================================================
                  BAT GRB EVENT DATA PROCESSING REPORT
    Process Script Ver: batgrbproduct v2.46
    Process Start Time: Sun Jan 19 14:51:24 EST 2014
             Host Name: batevent1
   Current Working Dir: /local/data/batevent/batevent_reproc/trigger359378
======================================================================

  Trigger: 00359378      Segment: 000

  BAT Trigger Time: 271350032   [s; MET]
      Trigger Stop: 271350096   [s; MET]
               UTC: 2009-08-07T15:00:27.022480    [includes UTCF correction]
       Where From?: TDRSS position message

  BAT
    RA: 273.744300314753   Dec: 10.2809416544568  [deg; J2000]

     Catalogged Source?: NO
     Point Source?:      YES
     GRB Indicated?:     YES    [ by BAT flight software ]
     Image S/N Ratio:    13.18
     Image Trigger?:     YES
     Rate S/N Ratio:     0  [ if not an image trigger ]
     Image S/N Ratio:    13.18

  Analysis Position:   [ source = BAT ]
    RA: 273.744300314753   Dec: 10.2809416544568  [deg; J2000]

  Refined Position:   [ source = BAT pre-slew burst ]
    RA: 273.740596127134   Dec: 10.2795620125647  [deg; J2000]
        { 18h 14m 57.7s , +10d 16' 46.4" }
         +/- 1.81978519744879 [arcmin] (estimated 90% radius based on SNR)
         +/- 0.663278073070067 [arcmin] (formal 1-sigma fit error)
    SNR: 12.9318617832287

  Angular difference between the analysis and refined position is 0.233826 arcmin

  Partial Coding Fraction: 0.640625    [ including projection effects ]

  Duration
     T90: 146.351999938488 +/- 13.1963055176372
        Measured from: -0.444000005722046
                   to: 145.907999932766     [s; relative to TRIGTIME]
     T50: 80.5719999670982 +/- 19.1943076258741
        Measured from: 35.8240000009537
                   to: 116.395999968052     [s; relative to TRIGTIME]


  Fluence
     Peak Flux  (peak 1 second)
        Measured from: 41.9480000138283
                   to: 42.9480000138283     [s; relative to TRIGTIME]
     Total Fluence
        Measured from: -9.45200002193451
                   to: 151.487999975681     [s; relative to TRIGTIME]

             Band 1     Band 2     Band 3     Band 4
              15-25      25-50     50-100    100-350     keV
 Total     1.727121   1.793824   0.716037   0.159656
           0.102895   0.096105   0.086746   0.090612 [error]
 Peak      0.028111   0.029329   0.022718   0.012020
           0.008838   0.008155   0.007648   0.007787 [error]

     [ fluence units of on-axis counts / fully illuminated detector ]

======================================================================


====== Table of the duration information =============================

        Value   tstart    tstop
T100  160.940   -9.452  151.488
T90   146.352   -0.444  145.908
T50    80.572   35.824  116.396
Peak    1.000   41.948   42.948


====== Spectral Analysis Summary =====================================

Model      : spectral model: simple power-law (PL) and cutoff power-law (CPL)
Ph_index   : photon index: E^{Ph_index}
Ph_90err   : 90% error of the photon index
Epeak      : Epeak in keV
Epeak_90err: 90% error of Epeak
Norm       : normalization at 50 keV in both the PL model and CPL model
Nomr_90err : 90% error of the normalization
chi2       : Chi-Squared
dof        : degree of freedo

=== Time-averaged spectral analysis ===
(Best model with acceptable fit: N/A)

Model Ph_index Ph_90err_low Ph_90err_hi  Epeak  Epeak_90err_low  Epeak_90err_hi  Norm       Nomr_90err_low    Norm_90err_hi    chi2    dof
PL      -2.220    -0.145      0.140       -           -               -         1.44e-03     -1.37e-04          1.35e-04      76.970   57
CPL     -1.478    -0.539      0.739       26.965     -24.943         8.776      4.03e-03     -2.16e-03          7.32e-03      72.460   56


=== 1-s peak spectral analysis ===
(Best model with acceptable fit: PL)

Model Ph_index Ph_90err_low Ph_90err_hi  Epeak  Epeak_90err_low  Epeak_90err_hi  Norm       Nomr_90err_low    Norm_90err_hi    chi2    dof
PL      -1.830     -0.663     0.603       -           -               -         5.16e-03     -1.93e-03          1.77e-03      47.990   57
CPL     -1.861     -0.837     1.170     9999.360      N/A           N/A         5.05e-03        N/A               N/A         48.000   56


=== Fluence/Peak Flux Summary ===

              Model    Band1     Band2     Band3     Band4     Band5     Total
                       15-25     25-50    50-100    100-350    15-150    15-350    keV
Fluence         PL   5.84e-07  6.95e-07  5.96e-07  8.72e-07  2.18e-06  2.75e-06   erg/cm2
      90%_error_low -5.70e-08 -4.86e-08 -7.75e-08 -2.05e-07 -1.75e-07 -3.00e-07   erg/cm2
      90%_error_hi   5.82e-08  4.85e-08  7.99e-08  2.47e-07  1.79e-07  3.31e-07   erg/cm2
Peak flux       PL   2.92e-01  2.42e-01  1.36e-01  1.13e-01  7.19e-01  7.82e-01   ph/cm2/s
      90%_error_low -1.30e-01 -7.00e-02 -6.44e-02 -7.86e-02 -2.08e-01 -2.28e-01   ph/cm2/s
      90%_error_hi   1.43e-01  6.98e-02  6.63e-02  1.55e-01  2.09e-01  2.31e-01   ph/cm2/s

Fluence        CPL   5.53e-07  7.46e-07  5.41e-07  2.33e-07  2.00e-06  2.07e-06   erg/cm2
      90%_error_low -6.39e-08 -6.39e-08 -1.06e-07 -1.51e-07 -2.09e-07 -2.67e-07   erg/cm2
      90%_error_hi   6.41e-08  6.55e-08  9.84e-08  4.12e-07  2.25e-07  4.79e-07   erg/cm2
Peak flux      CPL   2.68e-01  1.99e-01  1.01e-01  8.72e-02  6.04e-01  6.57e-01   ph/cm2/s
      90%_error_low     N/A   -1.19e-01 -5.97e-02 -4.84e-02     N/A   -3.90e-01   ph/cm2/s
      90%_error_hi      N/A    1.05e-01  5.26e-02  4.07e-02     N/A    3.17e-01   ph/cm2/s

======================================================================
Image
Pre-slew 15.0-350.0 keV image (Event data)
#   RAcent    DECcent   POSerr    Theta     Phi              Peak Cts       SNR   Name
  273.7406    10.2796   0.0149    31.8565    18.6253         2.2916948     12.932 TRIG_00359378

Foreground time interval of the image:
 -9.452  73.501 (delta_t =  82.953 [sec])
Background time interval of the image:
-239.000  -9.452 (delta_t = 229.548 [sec])
Light Curves
Note: The mask-weighted lightcurves have units of either count/det or counts/sec/det, where a det is 0.4 x 0.4 = 0.16 sq cm.
Full-time range; 1 s binning
Other quick-look light curves:
- 64 ms binning (zoomed)
- 16 ms binning (zoomed)
- 8 ms binning (zoomed)
- 2 ms binning (zoomed)
- SN=5 or 10 s binning (full-time range)
- Raw light curve
Spectra
- 64 ms binning (zoomed)
- 16 ms binning (zoomed)
- 8 ms binning (zoomed)
- 2 ms binning (zoomed)
- SN=5 or 10 s binning (full-time range)
- Raw light curve
Spectra
Notes:
- 1) The fitting includes the systematic errors.
- 2) When the burst includes telescope slew time periods, the fitting uses an average response file made from multiple 5-s response files through out the slew time plus single time preiod for the non-slew times, and weighted by the total counts in the corresponding time period using addrmf. An average response file is needed becuase a spectral fit using the pre-slew DRM will introduce some errors in both a spectral shape and a normalization if the PHA file contains a lot of the slew/post-slew time interval.
- 3) For fits to more complicated models (e.g. a power-law over a cutoff power-law), the BAT team has decided to require a chi-square improvement of more than 6 for each extra dof.
Time averaged spectrum fit using the average DRM
Power-law model
Time interval is from   -9.452 sec. to  151.488 sec.

Spectral model in power-law:
------------------------------------------------------------
Parameters  : value       lower 90%   higher 90%
Photon index: -2.22046     ( -0.145502   0.140353 )
Norm@50keV  : 1.43908E-03    ( -0.00013652   0.00013494 )
------------------------------------------------------------
#Fit statistic : Chi-Squared =          76.97 using 59 PHA bins.
# Reduced chi-squared =          1.350 for     57 degrees of freedom
# Null hypothesis probability =   4.017857e-02

Photon flux (15-150 keV)    in 160.9 sec: 0.240861 ( -0.016701  0.016717 ) ph/cm2/s
Energy fluence (15-150 keV)             : 2.18396e-06 ( -1.75441e-07  1.78726e-07 ) ergs/cm2
Cutoff power-law model

Time interval is from   -9.452 sec. to  151.488 sec.
Spectral model in the cutoff power-law:
------------------------------------------------------------
Parameters  : value       lower 90%   higher 90%
Photon index: -1.47753     ( -0.539366   0.738502 )
Epeak [keV] : 26.9649      ( -24.9436 8.77593 )
Norm@50keV  : 4.02604E-03    ( -0.00215977   0.00732385 )
------------------------------------------------------------
#Fit statistic : Chi-Squared =          72.46 using 59 PHA bins.
# Reduced chi-squared =          1.294 for     56 degrees of freedom
# Null hypothesis probability =   6.857729e-02

Photon flux (15-150 keV)    in 160.9 sec: 0.232085 ( -0.017995  0.018045 ) ph/cm2/s
Energy fluence (15-150 keV)             : 1.99764e-06 ( -2.09479e-07  2.25447e-07 ) ergs/cm2
1-s peak spectrum fit
Power-law model
Time interval is from   41.948 sec. to   42.948 sec.

Spectral model in power-law:
------------------------------------------------------------
Parameters  : value       lower 90%   higher 90%
Photon index: -1.83044     ( -0.662951   0.603265 )
Norm@50keV  : 5.15587E-03    ( -0.00193015   0.00176566 )
------------------------------------------------------------
#Fit statistic : Chi-Squared =          47.99 using 59 PHA bins.
# Reduced chi-squared =         0.8419 for     57 degrees of freedom
# Null hypothesis probability =   7.966765e-01

Photon flux (15-150 keV)    in 1 sec: 0.719066 ( -0.208281  0.208742 ) ph/cm2/s
Energy fluence (15-150 keV)             : 4.74308e-08 ( -1.65108e-08  1.7696e-08 ) ergs/cm2
Cutoff power-law model
Time interval is from   41.948 sec. to   42.948 sec.
Spectral model in the cutoff power-law:
------------------------------------------------------------
Parameters  : value       lower 90%   higher 90%
Photon index: -2.58324     ( -0.114305   1.89249 )
Epeak [keV] : 196.700      (   )
Norm@50keV  : 2.11850E-03    (     )
------------------------------------------------------------
#Fit statistic : Chi-Squared =          47.30 using 59 PHA bins.
# Reduced chi-squared =         0.8446 for     56 degrees of freedom
# Null hypothesis probability =   7.897061e-01

Photon flux (15-150 keV)    in 1 sec: 0.603780 (    ) ph/cm2/s
Energy fluence (15-150 keV)             : 0 ( 0  0 ) ergs/cm2
Time-resolved spectra

Distribution
T90 vs. Hardness ratio plot
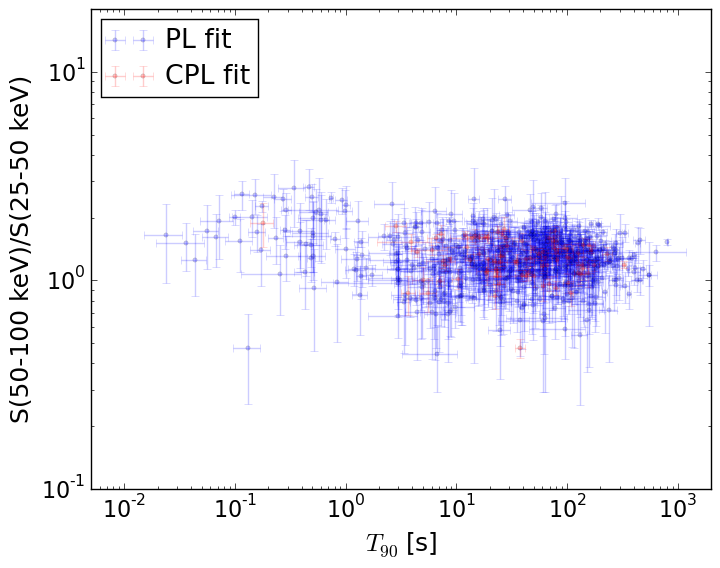
T90                                   = N/A sec.
Hardness ratio (energy fluence ratio) = N/A
S(15-50 keV) vs. S(50-150 keV) plot
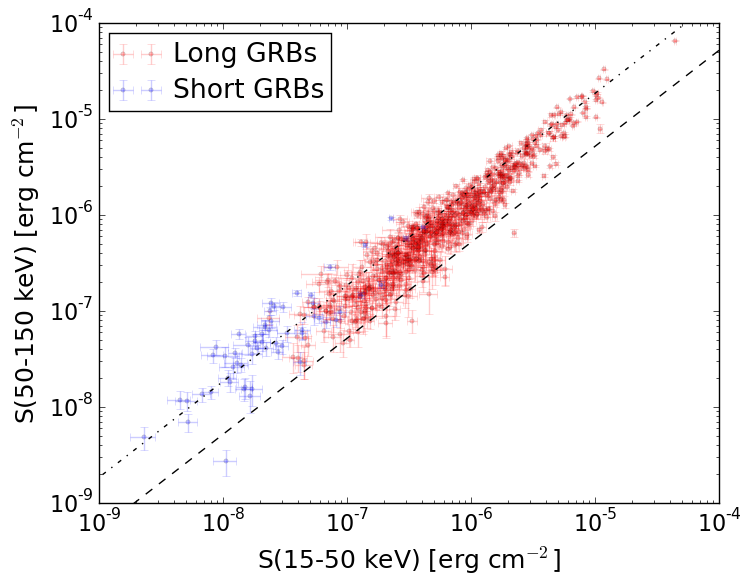
S(15-50 keV)  = N/A
S(50-150 keV) = N/A
The dash-dotted line and the dashed line traces the fluences calculated from the Band function with Epeak = 15 and 150 keV, respectively. Both lines assume a canonical values of alpha = -1 and beta = -2.5.
Mask shadow pattern
IMX = 5.888474441801412E-01, IMY = -1.984581321168578E-01
Spacecraft aspect plot
Bright source in the pre-burst/pre-slew/post-slew images
Pre-burst image of 15-350 keV band
Time interval of the image:
-239.000000 -9.452000

# RAcent  DECcent POSerr Theta    Phi  PeakCts   SNR AngSep     Name
#  [deg]    [deg]    ['] [deg]  [deg]                   [']
244.9788 -15.6320    0.2  24.1  -69.5  16.1379  48.2    0.5	Sco X-1
255.9616 -37.8415    0.9  20.3 -136.4   3.5255  12.6    1.2	4U 1700-377
256.2347 -36.2851    0.0  19.0 -133.9   0.0021   0.0   12.7	GX 349+2
263.0900 -24.5843    6.4   6.9 -108.6   0.4720   1.8   10.6	GX 1+4
264.9264 -44.5842    7.9  23.6 -160.6   0.4409   1.5   11.2	4U 1735-44
268.3818  -1.4441    2.1  19.9    7.3   1.4172   5.6    1.0	SW J1753.5-0127
270.3120 -25.0154    4.5   3.7 -178.2   0.6716   2.6    4.1	GX 5-1
270.3058 -25.6706   17.5   4.4 -176.7   0.1751   0.7    4.4	GRS 1758-258
274.0407 -14.1191    4.1   8.3   41.8   0.6895   2.8    5.4	GX 17+2
275.8482 -30.2713    4.2  10.5  160.3   0.6935   2.7    7.0	H1820-303
284.9964 -24.7785    9.7  14.5  117.7  -0.3665  -1.2    8.8	HT1900.1-2455
288.7024  10.9605   64.2  37.3   42.9   0.0992   0.2    5.7	GRS 1915+105
262.8087 -33.8274    5.0  13.9 -144.7   0.6088   2.3    9.0	GX 354-0
319.0591 -41.7480    3.2  46.0  139.1   4.0070   3.6 ------	UNKNOWN
267.8301  29.3873    2.5  50.7    8.9   3.8157   4.7 ------	UNKNOWN
255.0755 -41.6871    1.9  23.8 -141.2   1.6555   6.0 ------	UNKNOWN
219.3857 -69.8322    3.4  56.9 -150.6   5.1784   3.4 ------	UNKNOWN
Pre-slew background subtracted image of 15-350 keV band
Time interval of the image:
-9.452000 73.500590

# RAcent  DECcent POSerr Theta    Phi  PeakCts   SNR AngSep     Name
#  [deg]    [deg]    ['] [deg]  [deg]                   [']
244.8263 -15.6864    4.6  24.2  -69.8  -0.4150  -2.5    9.3	Sco X-1
256.1661 -37.8046    4.0  20.2 -136.7   0.4186   2.9    8.8	4U 1700-377
256.6366 -36.5608    0.0  19.0 -135.2   0.1338   0.9   12.7	GX 349+2
263.0367 -24.8417   11.4   7.0 -110.3  -0.1341  -1.0    6.0	GX 1+4
264.5646 -44.5301    7.2  23.6 -159.9  -0.2258  -1.6    9.0	4U 1735-44
268.2694  -1.5664  113.9  19.8    6.9  -0.0133  -0.1    9.0	SW J1753.5-0127
270.3896 -24.9470    6.7   3.7 -179.5  -0.2308  -1.7    9.8	GX 5-1
270.4737 -25.7518   10.4   4.5 -178.5   0.1491   1.1    9.3	GRS 1758-258
274.1003 -14.1556   17.3   8.3   42.3   0.0865   0.7    9.0	GX 17+2
275.8677 -30.4921    8.2  10.7  160.9  -0.1794  -1.4    8.1	H1820-303
285.0118 -24.7740    4.0  14.5  117.7   0.3971   2.9    8.9	HT1900.1-2455
288.8991  10.9752    4.4  37.4   43.2   0.7062   2.6    6.2	GRS 1915+105
262.8051 -33.8079    3.9  13.9 -144.6  -0.3840  -3.0    9.3	GX 354-0
273.7406  10.2796    0.9  31.9   18.6   2.2968  13.0 ------	UNKNOWN
Post-slew image of 15-350 keV band
Time interval of the image:
141.700600 963.056700

# RAcent  DECcent POSerr Theta    Phi  PeakCts   SNR AngSep     Name
#  [deg]    [deg]    ['] [deg]  [deg]                   [']
244.9759 -15.6391    0.2  38.5 -162.6  50.5121  49.0    0.2	Sco X-1
254.5541  35.1728    0.0  30.4  -62.8  -2.0877  -1.6   11.2	Her X-1
255.9784 -37.8603    1.8  50.9  167.4  16.0810   6.3    1.0	4U 1700-377
256.4493 -36.2574    0.0  49.3  167.7   3.6671   1.7   10.0	GX 349+2
262.9751 -24.7683    3.3  36.6  165.9   4.0602   3.5    2.3	GX 1+4
268.4063  -1.5062    2.6  12.9  173.9   3.5822   4.5    4.0	SW J1753.5-0127
270.2828 -25.0647  103.7  35.5  154.7   0.1440   0.1    0.9	GX 5-1
270.3018 -25.7433   11.7  36.2  154.6   1.3872   1.0    0.0	GRS 1758-258
273.9966 -14.0301   29.1  24.3  148.7   0.3235   0.4    0.7	GX 17+2
276.0861 -30.3936    5.6  40.7  146.2   4.2770   2.1    8.5	H1820-303
285.0325 -24.9117  291.5  36.9  132.1   0.0624   0.0    0.6	HT1900.1-2455
288.8275  11.0099    2.0  14.8   55.1   4.1300   5.9    4.2	GRS 1915+105
299.6042  35.1915    0.4  34.3    8.6  30.8167  32.4    0.9	Cyg X-1
308.0660  40.9818    2.7  43.1    7.8   5.3790   4.3    2.7	Cyg X-3
263.0626 -33.9342    8.2  45.4  161.8   2.8038   1.4    7.0	GX 354-0
314.1584  24.9741    2.4  41.0   32.8   6.9121   4.9 ------	UNKNOWN
298.3734  35.3348    2.7  33.6    7.2   3.7380   4.3 ------	UNKNOWN
263.4135  18.9568    2.4  13.2  -78.6   3.5766   4.8 ------	UNKNOWN
227.1498  -4.1733    4.2  48.6 -135.7   9.9836   2.8 ------	UNKNOWN