Analysis Summary
Notes:
- 1) No attempt has been made to eliminate the non-significant decimal places.
- 2) This batgrbproduct analysis is done using the HEASARC data.
- 3) This batgrbproduct analysis is using the flight position for the mask-weighting calculation.
======================================================================
                  BAT GRB EVENT DATA PROCESSING REPORT
    Process Script Ver: batgrbproduct v2.46
    Process Start Time: Sun Jan 19 14:41:18 EST 2014
             Host Name: batevent1
   Current Working Dir: /local/data/batevent/batevent_reproc/trigger359530
======================================================================

  Trigger: 00359530      Segment: 000

  BAT Trigger Time: 271531879.488   [s; MET]
      Trigger Stop: 271531883.584   [s; MET]
               UTC: 2009-08-09T17:31:14.504600    [includes UTCF correction]
       Where From?: TDRSS position message

  BAT
    RA: 328.645008350626   Dec: -0.0832895616909542  [deg; J2000]

     Catalogged Source?: NO
     Point Source?:      YES
     GRB Indicated?:     YES    [ by BAT flight software ]
     Image S/N Ratio:    8.62
     Image Trigger?:     NO
     Rate S/N Ratio:     10.6770782520313  [ if not an image trigger ]
     Image S/N Ratio:    8.62

  Analysis Position:   [ source = BAT ]
    RA: 328.645008350626   Dec: -0.0832895616909542  [deg; J2000]

  Refined Position:   [ source = BAT pre-slew burst ]
    RA: 328.676295114875   Dec: -0.0960883536527028  [deg; J2000]
        { 21h 54m 42.3s , -00d 05' 45.9" }
         +/- 2.1456530547026 [arcmin] (estimated 90% radius based on SNR)
         +/- 1.0829894810255 [arcmin] (formal 1-sigma fit error)
    SNR: 10.2202601934028

  Angular difference between the analysis and refined position is 2.028203 arcmin

  Partial Coding Fraction: 0.4335938    [ including projection effects ]

  Duration
     T90: 8.86799997091293 +/- 2.87484886958812
        Measured from: -0.143999993801117
                   to: 8.72399997711182     [s; relative to TRIGTIME]
     T50: 3.00799995660782 +/- 1.41738346896597
        Measured from: 1.95600003004074
                   to: 4.96399998664856     [s; relative to TRIGTIME]


  Fluence
     Peak Flux  (peak 1 second)
        Measured from: 2.26399999856949
                   to: 3.26399999856949     [s; relative to TRIGTIME]
     Total Fluence
        Measured from: -0.711999952793121
                   to: 9.25600004196167     [s; relative to TRIGTIME]

             Band 1     Band 2     Band 3     Band 4
              15-25      25-50     50-100    100-350     keV
 Total     0.124350   0.229186   0.164849   0.063783
           0.027404   0.028801   0.025708   0.023247 [error]
 Peak      0.040525   0.040887   0.046027   0.017960
           0.009225   0.009043   0.008491   0.007288 [error]

     [ fluence units of on-axis counts / fully illuminated detector ]

======================================================================


====== Table of the duration information =============================

        Value   tstart    tstop
T100    9.968   -0.712    9.256
T90     8.868   -0.144    8.724
T50     3.008    1.956    4.964
Peak    1.000    2.264    3.264


====== Spectral Analysis Summary =====================================

Model      : spectral model: simple power-law (PL) and cutoff power-law (CPL)
Ph_index   : photon index: E^{Ph_index}
Ph_90err   : 90% error of the photon index
Epeak      : Epeak in keV
Epeak_90err: 90% error of Epeak
Norm       : normalization at 50 keV in both the PL model and CPL model
Nomr_90err : 90% error of the normalization
chi2       : Chi-Squared
dof        : degree of freedo

=== Time-averaged spectral analysis ===
(Best model with acceptable fit: PL)

Model Ph_index Ph_90err_low Ph_90err_hi  Epeak  Epeak_90err_low  Epeak_90err_hi  Norm       Nomr_90err_low    Norm_90err_hi    chi2    dof
PL      -1.348    -0.255      0.258       -           -               -         3.75e-03     -5.60e-04          5.58e-04      55.470   57
CPL     -1.143    -0.981      1.088      202.490    -202.490      -202.490      4.81e-03     -1.59e-03          1.29e-02      55.320   56


=== 1-s peak spectral analysis ===
(Best model with acceptable fit: PL)

Model Ph_index Ph_90err_low Ph_90err_hi  Epeak  Epeak_90err_low  Epeak_90err_hi  Norm       Nomr_90err_low    Norm_90err_hi    chi2    dof
PL      -1.378     -0.361     0.362       -           -               -         8.88e-03     -1.77e-03          1.76e-03      62.380   57
CPL     -1.233     -1.979     1.264      280.419    -280.419      -280.419      1.04e-02        N/A               N/A         62.400   56


=== Fluence/Peak Flux Summary ===

              Model    Band1     Band2     Band3     Band4     Band5     Total
                       15-25     25-50    50-100    100-350    15-150    15-350    keV
Fluence         PL   4.14e-08  8.35e-08  1.31e-07  4.56e-07  3.65e-07  7.12e-07   erg/cm2
      90%_error_low -1.04e-08 -1.34e-08 -2.48e-08 -1.61e-07 -6.07e-08 -1.83e-07   erg/cm2
      90%_error_hi   1.10e-08  1.32e-08  2.46e-08  2.14e-07  6.16e-08  2.28e-07   erg/cm2
Peak flux       PL   3.25e-01  3.52e-01  2.71e-01  3.41e-01  1.08e+00  1.29e+00   ph/cm2/s
      90%_error_low -1.12e-01 -7.82e-02 -6.74e-02 -1.50e-01 -2.16e-01 -2.60e-01   ph/cm2/s
      90%_error_hi   1.24e-01  7.61e-02  6.58e-02  2.11e-01  2.17e-01  2.65e-01   ph/cm2/s

Fluence        CPL   4.03e-08  8.57e-08  1.33e-07  3.21e-07  3.58e-07  5.79e-07   erg/cm2
      90%_error_low -1.17e-08 -1.50e-08 -2.56e-08 -2.47e-07 -7.00e-08 -2.58e-07   erg/cm2
      90%_error_hi   1.17e-08  8.28e-09  2.65e-08  1.81e-07  6.69e-08  2.00e-07   erg/cm2
Peak flux      CPL   3.24e-01  3.53e-01  2.72e-01  3.22e-01  1.07e+00  1.28e+00   ph/cm2/s
      90%_error_low -1.39e-01 -7.92e-02 -6.84e-02 -3.22e-01 -2.24e-01 -3.64e-01   ph/cm2/s
      90%_error_hi   9.58e-02  8.50e-02  7.56e-02  1.35e-01  2.19e-01  2.70e-01   ph/cm2/s

======================================================================
Image
Pre-slew 15.0-350.0 keV image (Event data)
#   RAcent    DECcent   POSerr    Theta     Phi              Peak Cts       SNR   Name
  328.6763    -0.0961   0.0188    27.7288    99.2232         0.5730937     10.220 TRIG_00359530

Foreground time interval of the image:
 -0.712   9.256 (delta_t =   9.968 [sec])
Background time interval of the image:
-239.488  -0.712 (delta_t = 238.776 [sec])
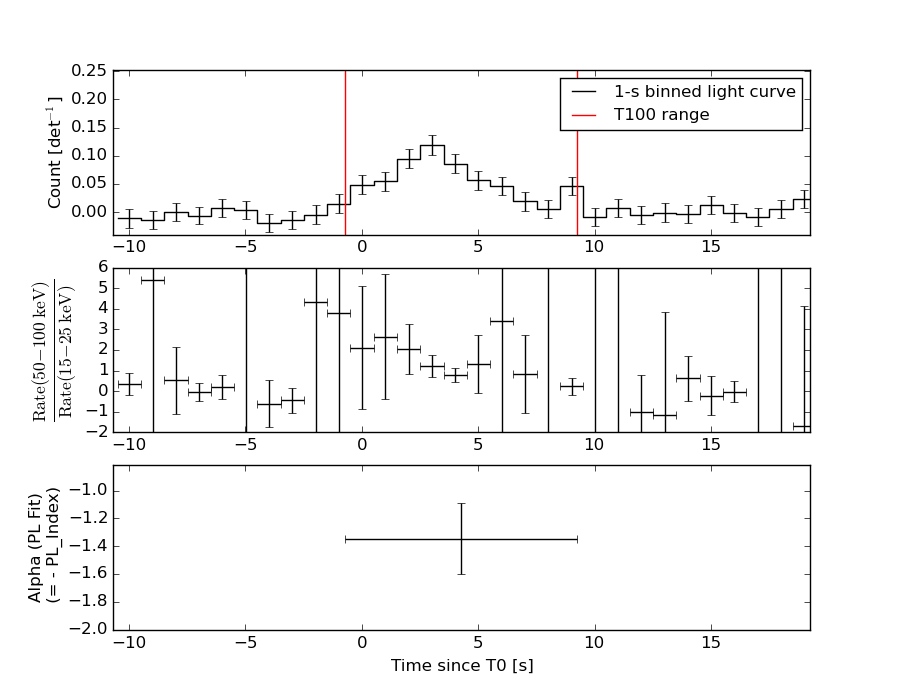
Light Curves
Note: The mask-weighted lightcurves have units of either count/det or counts/sec/det, where a det is 0.4 x 0.4 = 0.16 sq cm.
Full-time range; 1 s binning
Other quick-look light curves:
- 64 ms binning (zoomed)
- 16 ms binning (zoomed)
- 8 ms binning (zoomed)
- 2 ms binning (zoomed)
- SN=5 or 10 s binning (full-time range)
- Raw light curve
Spectra
- 64 ms binning (zoomed)
- 16 ms binning (zoomed)
- 8 ms binning (zoomed)
- 2 ms binning (zoomed)
- SN=5 or 10 s binning (full-time range)
- Raw light curve
Spectra
Notes:
- 1) The fitting includes the systematic errors.
- 2) When the burst includes telescope slew time periods, the fitting uses an average response file made from multiple 5-s response files through out the slew time plus single time preiod for the non-slew times, and weighted by the total counts in the corresponding time period using addrmf. An average response file is needed becuase a spectral fit using the pre-slew DRM will introduce some errors in both a spectral shape and a normalization if the PHA file contains a lot of the slew/post-slew time interval.
- 3) For fits to more complicated models (e.g. a power-law over a cutoff power-law), the BAT team has decided to require a chi-square improvement of more than 6 for each extra dof.
Time averaged spectrum fit using the average DRM
Power-law model

Time interval is from   -0.712 sec. to    9.256 sec.

Spectral model in power-law:
------------------------------------------------------------
Parameters  : value       lower 90%   higher 90%
Photon index: -1.34833     ( -0.254538   0.25807 )
Norm@50keV  : 3.75158E-03    ( -0.000560267   0.000558343 )
------------------------------------------------------------
#Fit statistic : Chi-Squared =          55.47 using 59 PHA bins.
# Reduced chi-squared =         0.9732 for     57 degrees of freedom
# Null hypothesis probability =   5.326170e-01

Photon flux (15-150 keV)    in 9.968 sec: 0.451808 ( -0.067793  0.067905 ) ph/cm2/s
Energy fluence (15-150 keV)             : 3.65416e-07 ( -6.06699e-08  6.15842e-08 ) ergs/cm2
Cutoff power-law model
Time interval is from   -0.712 sec. to    9.256 sec.
Spectral model in the cutoff power-law:
------------------------------------------------------------
Parameters  : value       lower 90%   higher 90%
Photon index: -1.14254     ( -0.98103   1.08837 )
Epeak [keV] : 202.490      ( -202.596 -202.596 )
Norm@50keV  : 4.80765E-03    ( -0.00158615   0.0128517 )
------------------------------------------------------------
#Fit statistic : Chi-Squared =          55.32 using 59 PHA bins.
# Reduced chi-squared =         0.9879 for     56 degrees of freedom
# Null hypothesis probability =   5.004860e-01

Photon flux (15-150 keV)    in 9.968 sec: 0.448318 ( -0.069597  0.069467 ) ph/cm2/s
Energy fluence (15-150 keV)             : 3.58343e-07 ( -7.00271e-08  6.68523e-08 ) ergs/cm2
1-s peak spectrum fit
Power-law model
Time interval is from    2.264 sec. to    3.264 sec.

Spectral model in power-law:
------------------------------------------------------------
Parameters  : value       lower 90%   higher 90%
Photon index: -1.37779     ( -0.361166   0.36215 )
Norm@50keV  : 8.87545E-03    ( -0.00176857   0.0017582 )
------------------------------------------------------------
#Fit statistic : Chi-Squared =          62.38 using 59 PHA bins.
# Reduced chi-squared =          1.094 for     57 degrees of freedom
# Null hypothesis probability =   2.908985e-01

Photon flux (15-150 keV)    in 1 sec: 1.07556 ( -0.216207  0.2171 ) ph/cm2/s
Energy fluence (15-150 keV)             : 8.61688e-08 ( -1.90306e-08  1.93743e-08 ) ergs/cm2
Cutoff power-law model
Time interval is from    2.264 sec. to    3.264 sec.
Spectral model in the cutoff power-law:
------------------------------------------------------------
Parameters  : value       lower 90%   higher 90%
Photon index: -1.37443     ( -1.96745   1.27515 )
Epeak [keV] : 9986.50      ( -9984.42 -9984.42 )
Norm@50keV  : 8.90890E-03    (     )
------------------------------------------------------------
#Fit statistic : Chi-Squared =          62.38 using 59 PHA bins.
# Reduced chi-squared =          1.114 for     56 degrees of freedom
# Null hypothesis probability =   2.598930e-01

Photon flux (15-150 keV)    in 1 sec: 1.07309 ( -0.224118  0.21877 ) ph/cm2/s
Energy fluence (15-150 keV)             : 4.14639e-08 ( -2.42571e-08  1.71891e-08 ) ergs/cm2
Time-resolved spectra
Distribution
T90 vs. Hardness ratio plot
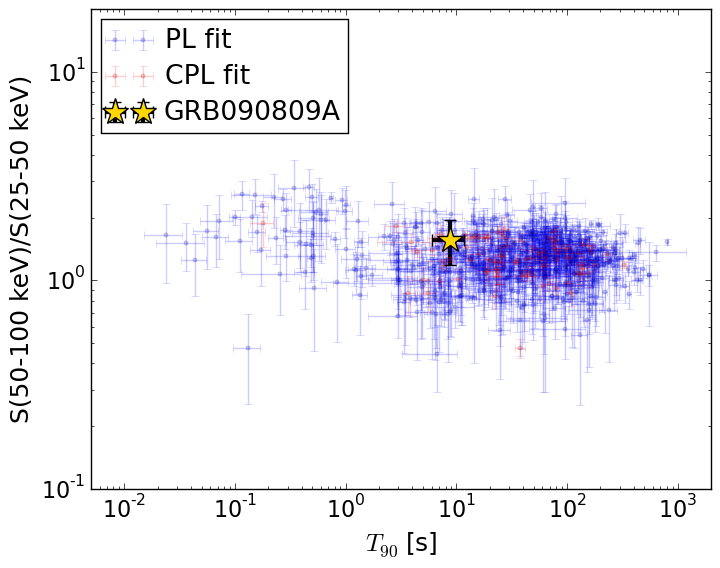
T90                                   = 8.868 sec.
Hardness ratio (energy fluence ratio) = 1.57101426515
S(15-50 keV) vs. S(50-150 keV) plot
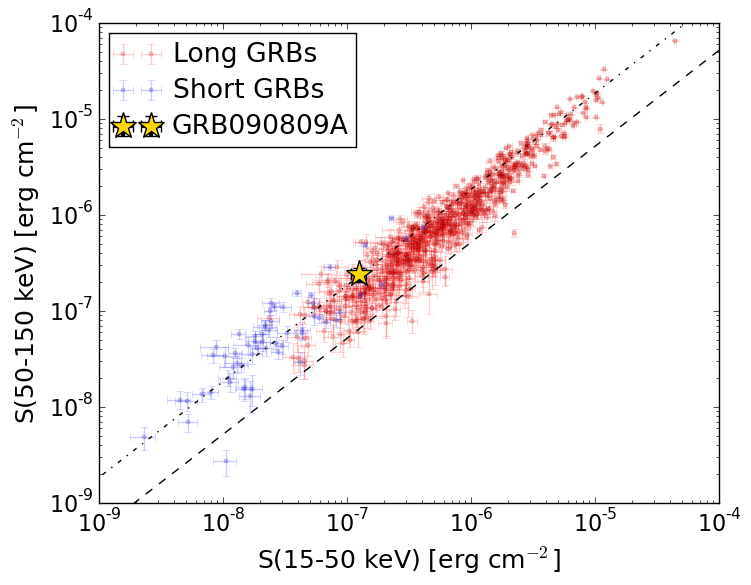
S(15-50 keV)  = 1.2497098e-07
S(50-150 keV) = 2.404474e-07
The dash-dotted line and the dashed line traces the fluences calculated from the Band function with Epeak = 15 and 150 keV, respectively. Both lines assume a canonical values of alpha = -1 and beta = -2.5.
Mask shadow pattern
IMX = -8.425224750239850E-02, IMY = -5.188565261520907E-01
Spacecraft aspect plot
Bright source in the pre-burst/pre-slew/post-slew images
Pre-burst image of 15-350 keV band
Time interval of the image:
-239.488000 -0.712000

# RAcent  DECcent POSerr Theta    Phi  PeakCts   SNR AngSep     Name
#  [deg]    [deg]    ['] [deg]  [deg]                   [']
288.8188  10.9283    3.2  49.8  158.4   2.6387   3.6    1.6	GRS 1915+105
299.5852  35.2092    0.3  35.2 -168.7   9.9282  37.8    0.5	Cyg X-1
308.1454  41.0078    1.7  29.9 -155.4   1.5713   6.9    3.7	Cyg X-3
326.2951  38.1648    2.9  16.6 -142.1   0.8410   4.1   11.1	Cyg X-2
304.4947  14.8024    2.4  34.3  154.3   1.4926   4.8 ------	UNKNOWN
316.8222  16.6847    2.2  22.7  147.1   1.1519   5.2 ------	UNKNOWN
 29.0217  -2.2681    1.8  55.6    8.4   6.9384   6.6 ------	UNKNOWN
358.5518  45.0889    2.6  24.8  -70.3   1.1570   4.4 ------	UNKNOWN
271.9558  39.9135    3.4  57.0 -161.6   3.2372   3.4 ------	UNKNOWN
337.4745  54.8703    3.3  29.2 -106.1   1.0816   3.6 ------	UNKNOWN
Pre-slew background subtracted image of 15-350 keV band
Time interval of the image:
-0.712000 9.256000

# RAcent  DECcent POSerr Theta    Phi  PeakCts   SNR AngSep     Name
#  [deg]    [deg]    ['] [deg]  [deg]                   [']
288.8202  10.8365    6.3  49.8  158.3  -0.2241  -1.8    6.7	GRS 1915+105
299.7834  35.1015    0.0  35.1 -168.8  -0.0322  -0.7   11.2	Cyg X-1
307.9183  40.8008    0.0  30.0 -155.9   0.0348   0.9   12.6	Cyg X-3
326.2550  38.4619    7.3  16.8 -141.5  -0.0538  -1.6    9.3	Cyg X-2
328.6763  -0.0961    1.1  27.7   99.2   0.5732  10.3 ------	UNKNOWN
Post-slew image of 15-350 keV band
Time interval of the image:
88.212590 193.412600

# RAcent  DECcent POSerr Theta    Phi  PeakCts   SNR AngSep     Name
#  [deg]    [deg]    ['] [deg]  [deg]                   [']
288.7087  11.1244    0.0  41.3  168.2   0.2470   1.2   12.0	GRS 1915+105
299.6475  35.2202    2.4  44.5 -153.4   0.9865   4.8    3.0	Cyg X-1
308.1586  40.9959    3.1  45.1 -140.8   0.9770   3.7    3.4	Cyg X-3
326.2099  38.3147   40.6  38.5 -122.0   0.0653   0.3    1.8	Cyg X-2
327.6882 -39.8954    2.5  39.8   62.3   1.6905   4.5 ------	UNKNOWN
284.7940  40.7833    2.5  57.0 -157.7   2.5284   4.7 ------	UNKNOWN