Analysis Summary
Notes:
- 1) No attempt has been made to eliminate the non-significant decimal places.
- 2) This batgrbproduct analysis is done using the HEASARC data.
- 3) This batgrbproduct analysis is using the flight position for the mask-weighting calculation.
======================================================================
BAT GRB EVENT DATA PROCESSING REPORT
Process Script Ver: batgrbproduct v2.46
Process Start Time: Sun Jan 19 14:37:43 EST 2014
Host Name: batevent1
Current Working Dir: /local/data/batevent/batevent_reproc/trigger359711
======================================================================
Trigger: 00359711 Segment: 000
BAT Trigger Time: 271749733.888 [s; MET]
Trigger Stop: 271749734.912 [s; MET]
UTC: 2009-08-12T06:02:08.897520 [includes UTCF correction]
Where From?: TDRSS position message
BAT
RA: 353.194081792447 Dec: -10.5945573605417 [deg; J2000]
Catalogged Source?: NO
Point Source?: YES
GRB Indicated?: YES [ by BAT flight software ]
Image S/N Ratio: 10.25
Image Trigger?: NO
Rate S/N Ratio: 23.388031127053 [ if not an image trigger ]
Image S/N Ratio: 10.25
Analysis Position: [ source = BAT ]
RA: 353.194081792447 Dec: -10.5945573605417 [deg; J2000]
Refined Position: [ source = BAT pre-slew burst ]
RA: 353.200640692419 Dec: -10.6103031693898 [deg; J2000]
{ 23h 32m 48.2s , -10d 36' 37.1" }
+/- 0.736804038461972 [arcmin] (estimated 90% radius based on SNR)
+/- 0.217492457408143 [arcmin] (formal 1-sigma fit error)
SNR: 47.0560562478732
Angular difference between the analysis and refined position is 1.020870 arcmin
Partial Coding Fraction: 0.78125 [ including projection effects ]
Duration
T90: 74.4959999918938 +/- 15.2868744039961
Measured from: -1.74800002574921
to: 72.7479999661446 [s; relative to TRIGTIME]
T50: 24.2639999389648 +/- 1.34571912144514
Measured from: 7.68400001525879
to: 31.9479999542236 [s; relative to TRIGTIME]
Fluence
Peak Flux (peak 1 second)
Measured from: 26.8240000009537
to: 27.8240000009537 [s; relative to TRIGTIME]
Total Fluence
Measured from: -5.43999999761581
to: 113.884000003338 [s; relative to TRIGTIME]
Band 1 Band 2 Band 3 Band 4
15-25 25-50 50-100 100-350 keV
Total 1.835128 2.946024 2.635923 0.899099
0.062624 0.064592 0.059081 0.051420 [error]
Peak 0.080606 0.136323 0.174052 0.075662
0.007078 0.008251 0.008537 0.007089 [error]
[ fluence units of on-axis counts / fully illuminated detector ]
======================================================================
====== Table of the duration information =============================
Value tstart tstop
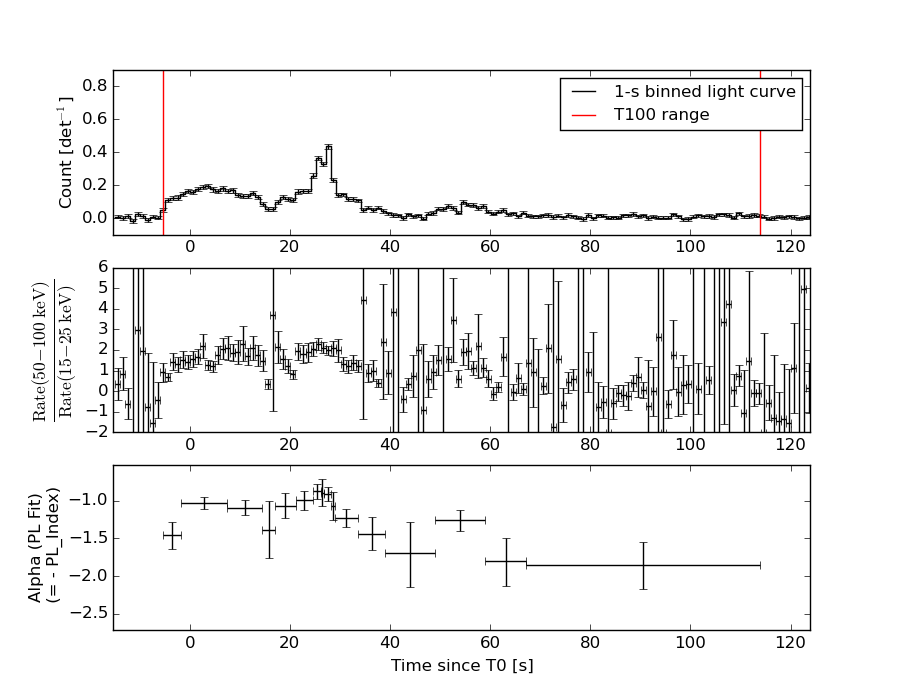
T100 119.324 -5.440 113.884
T90 74.496 -1.748 72.748
T50 24.264 7.684 31.948
Peak 1.000 26.824 27.824
====== Spectral Analysis Summary =====================================
Model : spectral model: simple power-law (PL) and cutoff power-law (CPL)
Ph_index : photon index: E^{Ph_index}
Ph_90err : 90% error of the photon index
Epeak : Epeak in keV
Epeak_90err: 90% error of Epeak
Norm : normalization at 50 keV in both the PL model and CPL model
Nomr_90err : 90% error of the normalization
chi2 : Chi-Squared
dof : degree of freedo
=== Time-averaged spectral analysis ===
(Best model with acceptable fit: PL)
Model Ph_index Ph_90err_low Ph_90err_hi Epeak Epeak_90err_low Epeak_90err_hi Norm Nomr_90err_low Norm_90err_hi chi2 dof
PL -1.218 -0.050 0.050 - - - 4.76e-03 -1.23e-04 1.23e-04 51.520 57
CPL -1.217 -0.047 0.054 9999.360 -9999.360 -9999.360 4.78e-03 -1.20e-04 5.06e-04 51.620 56
=== 1-s peak spectral analysis ===
(Best model with acceptable fit: PL)
Model Ph_index Ph_90err_low Ph_90err_hi Epeak Epeak_90err_low Epeak_90err_hi Norm Nomr_90err_low Norm_90err_hi chi2 dof
PL -0.862 -0.103 0.105 - - - 3.09e-02 -1.78e-03 1.77e-03 43.040 57
CPL -0.858 -0.102 0.190 9999.360 -9999.360 -9999.360 3.11e-02 -1.75e-03 1.04e-02 43.070 56
=== Fluence/Peak Flux Summary ===
Model Band1 Band2 Band3 Band4 Band5 Total
15-25 25-50 50-100 100-350 15-150 15-350 keV
Fluence PL 5.57e-07 1.22e-06 2.09e-06 8.31e-06 5.73e-06 1.22e-05 erg/cm2
90%_error_low -3.13e-08 -3.95e-08 -6.15e-08 -5.79e-07 -1.56e-07 -6.04e-07 erg/cm2
90%_error_hi 3.21e-08 3.94e-08 6.14e-08 6.10e-07 1.56e-07 6.31e-07 erg/cm2
Peak flux PL 6.93e-01 1.02e+00 1.12e+00 2.32e+00 3.55e+00 5.16e+00 ph/cm2/s
90%_error_low -8.45e-02 -7.63e-02 -6.80e-02 -3.04e-01 -2.03e-01 -3.39e-01 ph/cm2/s
90%_error_hi 8.85e-02 7.55e-02 6.76e-02 3.34e-01 2.03e-01 3.50e-01 ph/cm2/s
Fluence CPL 5.56e-07 1.22e-06 2.09e-06 8.26e-06 5.77e-06 1.26e-05 erg/cm2
90%_error_low N/A -3.96e-08 N/A N/A -1.93e-07 -1.56e-06 erg/cm2
90%_error_hi N/A 3.94e-08 N/A N/A 1.18e-07 7.23e-08 erg/cm2
Peak flux CPL 6.92e-01 1.02e+00 1.11e+00 2.31e+00 3.56e+00 5.37e+00 ph/cm2/s
90%_error_low N/A -7.24e-02 N/A N/A N/A -9.18e-01 ph/cm2/s
90%_error_hi N/A 7.95e-02 N/A N/A N/A 5.18e-01 ph/cm2/s
======================================================================
Image
Pre-slew 15.0-350.0 keV image (Event data)
#   RAcent    DECcent   POSerr    Theta     Phi              Peak Cts       SNR   Name
  353.2006   -10.6103   0.0041    26.5164   -36.6891         2.8026076     47.056 TRIG_00359711

Foreground time interval of the image:
 -5.440  12.413 (delta_t =  17.853 [sec])
Background time interval of the image:
-239.888  -5.440 (delta_t = 234.448 [sec])
Light Curves
Note: The mask-weighted lightcurves have units of either count/det or counts/sec/det, where a det is 0.4 x 0.4 = 0.16 sq cm.
Full-time range; 1 s binning
Other quick-look light curves:
- 64 ms binning (zoomed)
- 16 ms binning (zoomed)
- 8 ms binning (zoomed)
- 2 ms binning (zoomed)
- SN=5 or 10 s binning (full-time range)
- Raw light curve
Spectra
- 64 ms binning (zoomed)
- 16 ms binning (zoomed)
- 8 ms binning (zoomed)
- 2 ms binning (zoomed)
- SN=5 or 10 s binning (full-time range)
- Raw light curve
Spectra
Notes:
- 1) The fitting includes the systematic errors.
- 2) When the burst includes telescope slew time periods, the fitting uses an average response file made from multiple 5-s response files through out the slew time plus single time preiod for the non-slew times, and weighted by the total counts in the corresponding time period using addrmf. An average response file is needed becuase a spectral fit using the pre-slew DRM will introduce some errors in both a spectral shape and a normalization if the PHA file contains a lot of the slew/post-slew time interval.
- 3) For fits to more complicated models (e.g. a power-law over a cutoff power-law), the BAT team has decided to require a chi-square improvement of more than 6 for each extra dof.
Time averaged spectrum fit using the average DRM
Power-law model
Time interval is from   -5.440 sec. to  113.884 sec.

Spectral model in power-law:
------------------------------------------------------------
Parameters  : value       lower 90%   higher 90%
Photon index: -1.21816     ( -0.0499509   0.0501944 )
Norm@50keV  : 4.75791E-03    ( -0.000123078   0.000122919 )
------------------------------------------------------------
#Fit statistic : Chi-Squared =          51.52 using 59 PHA bins.
# Reduced chi-squared =         0.9039 for     57 degrees of freedom
# Null hypothesis probability =   6.799890e-01

Photon flux (15-150 keV)    in 119.3 sec: 0.559954 ( -0.01569  0.015749 ) ph/cm2/s
Energy fluence (15-150 keV)             : 5.73021e-06 ( -1.55647e-07  1.56068e-07 ) ergs/cm2
Cutoff power-law model

Time interval is from   -5.440 sec. to  113.884 sec.
Spectral model in the cutoff power-law:
------------------------------------------------------------
Parameters  : value       lower 90%   higher 90%
Photon index: -1.21661     ( -0.0481708   0.0529067 )
Epeak [keV] : 9999.36      ( -9999.36 -9999.36 )
Norm@50keV  : 4.77778E-03    ( -0.000122499   0.000503098 )
------------------------------------------------------------
#Fit statistic : Chi-Squared =          51.62 using 59 PHA bins.
# Reduced chi-squared =         0.9218 for     56 degrees of freedom
# Null hypothesis probability =   6.412306e-01

Photon flux (15-150 keV)    in 119.3 sec: 0.564065 ( -0.019974  0.011445 ) ph/cm2/s
Energy fluence (15-150 keV)             : 5.76582e-06 ( -1.93055e-07  1.18424e-07 ) ergs/cm2
1-s peak spectrum fit
Power-law model

Time interval is from   26.824 sec. to   27.824 sec.

Spectral model in power-law:
------------------------------------------------------------
Parameters  : value       lower 90%   higher 90%
Photon index: -0.862179     ( -0.103147   0.104912 )
Norm@50keV  : 3.09051E-02    ( -0.00177817   0.00177152 )
------------------------------------------------------------
#Fit statistic : Chi-Squared =          43.04 using 59 PHA bins.
# Reduced chi-squared =         0.7551 for     57 degrees of freedom
# Null hypothesis probability =   9.144651e-01

Photon flux (15-150 keV)    in 1 sec: 3.54715 ( -0.20289  0.20314 ) ph/cm2/s
Energy fluence (15-150 keV)             : 3.52087e-07 ( -2.19076e-08  2.19977e-08 ) ergs/cm2
Cutoff power-law model
Time interval is from   26.824 sec. to   27.824 sec.
Spectral model in the cutoff power-law:
------------------------------------------------------------
Parameters  : value       lower 90%   higher 90%
Photon index: -0.857521     ( -0.102026   0.189385 )
Epeak [keV] : 9999.36      ( -9999.36 -9999.36 )
Norm@50keV  : 3.11046E-02    ( -0.00176833   0.0103368 )
------------------------------------------------------------
#Fit statistic : Chi-Squared =          43.07 using 59 PHA bins.
# Reduced chi-squared =         0.7691 for     56 degrees of freedom
# Null hypothesis probability =   8.973803e-01

Photon flux (15-150 keV)    in 1 sec: 3.55904 (    ) ph/cm2/s
Energy fluence (15-150 keV)             : 3.53248e-07 ( -2.50167e-08  2.25634e-08 ) ergs/cm2
Time-resolved spectra
Distribution
T90 vs. Hardness ratio plot
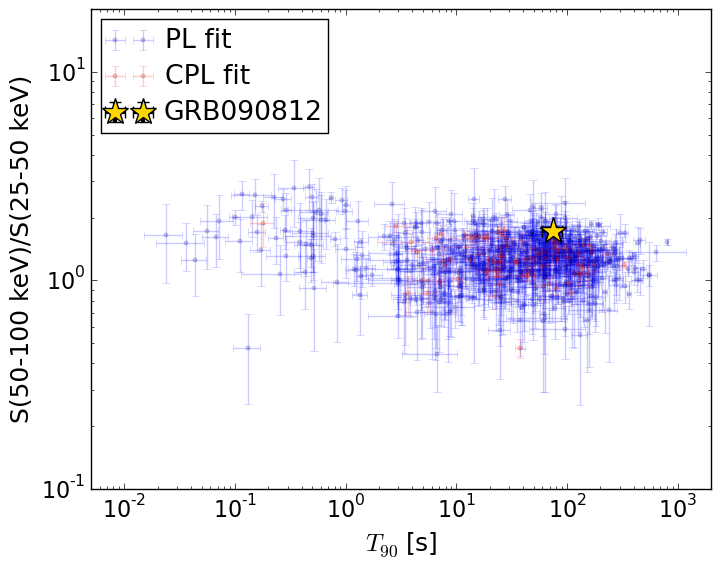
T90                                   = 74.496 sec.
Hardness ratio (energy fluence ratio) = 1.71937281308
S(15-50 keV) vs. S(50-150 keV) plot
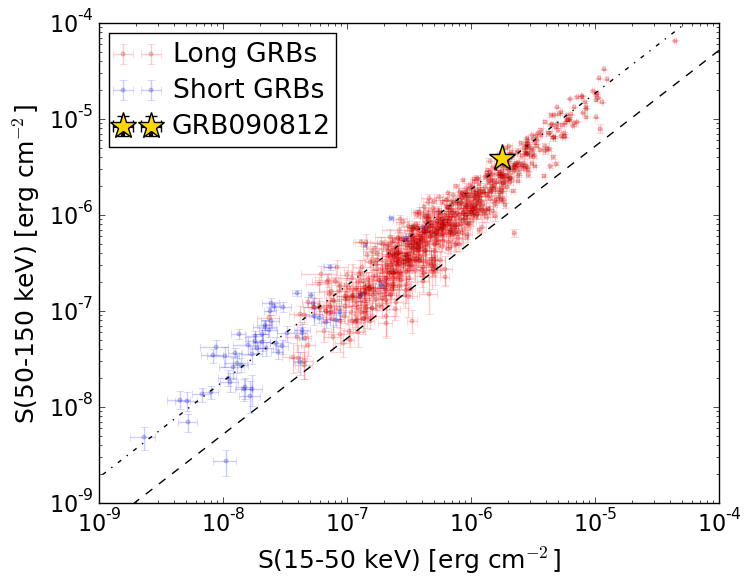
S(15-50 keV)  = 1.7735367e-06
S(50-150 keV) = 3.956765e-06
The dash-dotted line and the dashed line traces the fluences calculated from the Band function with Epeak = 15 and 150 keV, respectively. Both lines assume a canonical values of alpha = -1 and beta = -2.5.
Mask shadow pattern
IMX = 4.000946854737244E-01, IMY = 2.981031347701597E-01
Spacecraft aspect plot
Bright source in the pre-burst/pre-slew/post-slew images
Pre-burst image of 15-350 keV band
Time interval of the image:
-239.888000 -5.440000

# RAcent  DECcent POSerr Theta    Phi  PeakCts   SNR AngSep     Name
#  [deg]    [deg]    ['] [deg]  [deg]                   [']
288.8472  11.0122    4.9  41.1  136.3   1.3139   2.4    4.9	GRS 1915+105
299.5852  35.1962    0.5  44.5  174.7   8.1539  21.2    0.4	Cyg X-1
308.1010  40.9352    3.4  45.1 -172.8   1.2289   3.4    1.1	Cyg X-3
326.1336  38.3503    4.8  38.5 -154.0   0.7256   2.4    2.5	Cyg X-2
326.7038 -14.0430    2.8  14.1   37.2   0.8042   4.1 ------	UNKNOWN
322.3076   7.4779    2.5   9.9  169.4   0.8512   4.6 ------	UNKNOWN
349.8392  16.1781    2.6  26.5  -99.8   1.1320   4.4 ------	UNKNOWN
321.3945  54.1162    2.3  54.6 -156.0   3.5816   5.0 ------	UNKNOWN
354.5164  37.2697    2.4  44.4 -121.1   4.7078   4.8 ------	UNKNOWN
  8.2062  11.0605    3.1  40.8  -78.0   3.0376   3.7 ------	UNKNOWN
Pre-slew background subtracted image of 15-350 keV band
Time interval of the image:
-5.440000 12.412590

# RAcent  DECcent POSerr Theta    Phi  PeakCts   SNR AngSep     Name
#  [deg]    [deg]    ['] [deg]  [deg]                   [']
288.8113  10.9378    4.2  41.2  136.1  -0.3742  -2.7    0.9	GRS 1915+105
299.5911  35.3807   23.7  44.7  174.9  -0.0485  -0.5   10.7	Cyg X-1
308.1139  40.9047    4.0  45.1 -172.8  -0.2719  -2.9    2.9	Cyg X-3
326.4283  38.2562    0.0  38.4 -153.6  -0.1371  -1.8   12.7	Cyg X-2
295.7883  32.1724    2.7  44.8  168.5   0.4371   4.2 ------	UNKNOWN
347.6830 -17.5540    2.3  25.5  -16.8   0.2845   5.0 ------	UNKNOWN
353.2006 -10.6103    0.2  26.5  -36.7   2.8027  47.1 ------	UNKNOWN
312.9077  47.2515    2.1  49.3 -164.9   0.6484   5.4 ------	UNKNOWN
Post-slew image of 15-350 keV band
Time interval of the image:
65.612600 962.222000

# RAcent  DECcent POSerr Theta    Phi  PeakCts   SNR AngSep     Name
#  [deg]    [deg]    ['] [deg]  [deg]                   [']
326.1496  38.3443   41.2  55.1  165.8   0.8708   0.3    1.7	Cyg X-2
 26.2690  19.4009    4.4  44.3 -120.9   6.1408   2.6 ------	UNKNOWN
 23.7158  27.1608    3.4  48.0 -130.9   7.7839   3.4 ------	UNKNOWN