Analysis Summary
Notes:
- 1) No attempt has been made to eliminate the non-significant decimal places.
- 2) This batgrbproduct analysis is done using the HEASARC data.
- 3) This batgrbproduct analysis is using the flight position for the mask-weighting calculation.
======================================================================
BAT GRB EVENT DATA PROCESSING REPORT
Process Script Ver: batgrbproduct v2.46
Process Start Time: Sun Jan 19 14:33:08 EST 2014
Host Name: batevent1
Current Working Dir: /local/data/batevent/batevent_reproc/trigger359884
======================================================================
Trigger: 00359884 Segment: 000
BAT Trigger Time: 271829448.148 [s; MET]
Trigger Stop: 271829448.212 [s; MET]
UTC: 2009-08-13T04:10:43.154900 [includes UTCF correction]
Where From?: (*SHORT BURST*) TDRSS scaled map message
BAT
RA: 227.017184468102 Dec: 88.572588434289 [deg; J2000]
Catalogged Source?: NO
Point Source?: YES
GRB Indicated?: YES [ by BAT flight software ]
Image S/N Ratio: 7.75
Image Trigger?: NO
Rate S/N Ratio: 32.5576411921994 [ if not an image trigger ]
Image S/N Ratio: 7.75
Analysis Position: [ source = BAT ]
RA: 227.017184468102 Dec: 88.572588434289 [deg; J2000]
Refined Position: [ source = BAT pre-slew burst ]
RA: 225.094055131741 Dec: 88.5716313244324 [deg; J2000]
{ 15h 00m 22.6s , +88d 34' 17.9" }
+/- 1.30692015386469 [arcmin] (estimated 90% radius based on SNR)
+/- 0.454301302513962 [arcmin] (formal 1-sigma fit error)
SNR: 20.7514429676429
Angular difference between the analysis and refined position is 2.875763 arcmin
Partial Coding Fraction: 0.1835938 [ including projection effects ]
Duration
T90: 7.14399993419647 +/- 0.565416659857746
Measured from: -0.163999974727631
to: 6.97999995946884 [s; relative to TRIGTIME]
T50: 5.95999997854233 +/- 0.215295152888328
Measured from: 0.227999985218048
to: 6.18799996376038 [s; relative to TRIGTIME]
Fluence
Peak Flux (peak 1 second)
Measured from: -0.0400000214576721
to: 0.959999978542328 [s; relative to TRIGTIME]
Total Fluence
Measured from: -0.804000020027161
to: 7.32400000095367 [s; relative to TRIGTIME]
Band 1 Band 2 Band 3 Band 4
15-25 25-50 50-100 100-350 keV
Total 0.660525 0.754893 0.559937 0.171106
0.042693 0.044811 0.039935 0.031660 [error]
Peak 0.244082 0.344715 0.347778 0.108963
0.019336 0.022726 0.021628 0.015790 [error]
[ fluence units of on-axis counts / fully illuminated detector ]
======================================================================
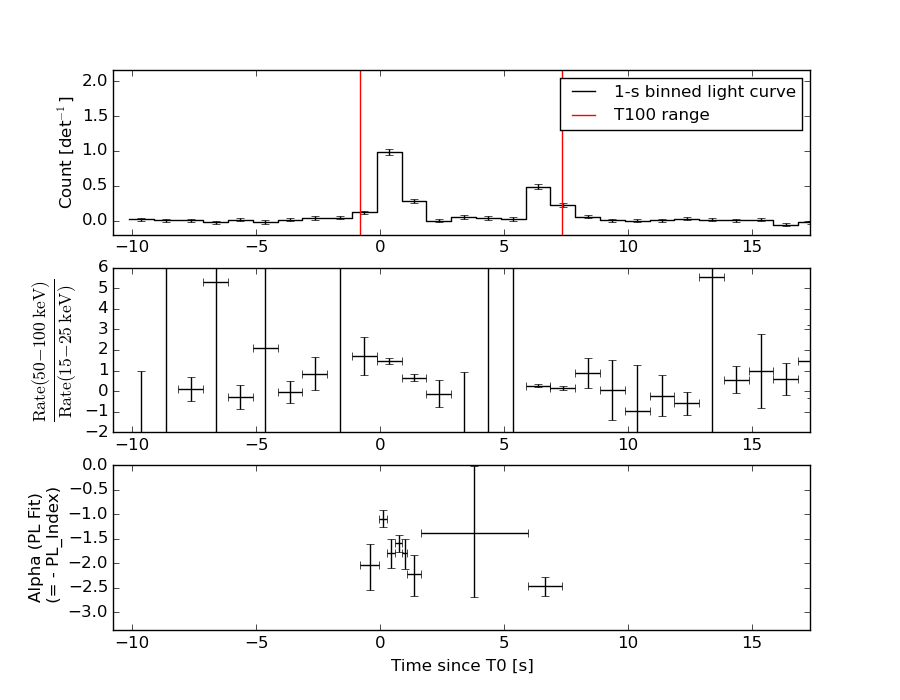
====== Table of the duration information =============================
Value tstart tstop
T100 8.128 -0.804 7.324
T90 7.144 -0.164 6.980
T50 5.960 0.228 6.188
Peak 1.000 -0.040 0.960
====== Spectral Analysis Summary =====================================
Model : spectral model: simple power-law (PL) and cutoff power-law (CPL)
Ph_index : photon index: E^{Ph_index}
Ph_90err : 90% error of the photon index
Epeak : Epeak in keV
Epeak_90err: 90% error of Epeak
Norm : normalization at 50 keV in both the PL model and CPL model
Nomr_90err : 90% error of the normalization
chi2 : Chi-Squared
dof : degree of freedo
=== Time-averaged spectral analysis ===
(Best model with acceptable fit: PL)
Model Ph_index Ph_90err_low Ph_90err_hi Epeak Epeak_90err_low Epeak_90err_hi Norm Nomr_90err_low Norm_90err_hi chi2 dof
PL -1.699 -0.117 0.116 - - - 1.76e-02 -1.20e-03 1.19e-03 55.160 57
CPL -1.672 -0.418 0.386 584.495 -584.484 -584.495 1.82e-02 -6.60e-03 1.02e-02 55.190 56
=== 1-s peak spectral analysis ===
(Best model with acceptable fit: N/A)
Model Ph_index Ph_90err_low Ph_90err_hi Epeak Epeak_90err_low Epeak_90err_hi Norm Nomr_90err_low Norm_90err_hi chi2 dof
PL -1.331 -0.114 0.114 - - - 7.11e-02 -4.75e-03 4.75e-03 72.250 57
CPL -1.217 -0.174 0.437 367.478 -367.478 -367.478 8.08e-02 -1.39e-02 4.90e-02 72.030 56
=== Fluence/Peak Flux Summary ===
Model Band1 Band2 Band3 Band4 Band5 Total
15-25 25-50 50-100 100-350 15-150 15-350 keV
Fluence PL 2.21e-07 3.59e-07 4.42e-07 1.07e-06 1.33e-06 2.10e-06 erg/cm2
90%_error_low -2.35e-08 -2.37e-08 -4.00e-08 -1.93e-07 -9.42e-08 -2.29e-07 erg/cm2
90%_error_hi 2.42e-08 2.37e-08 3.99e-08 2.20e-07 9.48e-08 2.49e-07 erg/cm2
Peak flux PL 2.49e+00 2.77e+00 2.20e+00 2.90e+00 8.54e+00 1.04e+01 ph/cm2/s
90%_error_low -3.04e-01 -2.13e-01 -1.74e-01 -4.50e-01 -5.91e-01 -7.08e-01 ph/cm2/s
90%_error_hi 3.15e-01 2.11e-01 1.73e-01 4.98e-01 5.92e-01 7.11e-01 ph/cm2/s
Fluence CPL 2.21e-07 3.58e-07 4.41e-07 1.08e-06 1.33e-06 2.12e-06 erg/cm2
90%_error_low N/A -2.34e-08 -4.07e-08 N/A -1.02e-07 -5.58e-07 erg/cm2
90%_error_hi N/A 1.44e-08 4.27e-08 N/A 9.43e-08 1.18e-07 erg/cm2
Peak flux CPL 1.67e+00 1.13e+00 5.23e-01 4.08e-01 3.50e+00 3.72e+00 ph/cm2/s
90%_error_low -4.49e-01 -3.07e-01 -1.79e-01 -1.88e-01 -7.61e-01 -6.78e-01 ph/cm2/s
90%_error_hi 4.25e-01 3.18e-01 1.73e-01 1.76e-01 8.26e-01 8.77e-01 ph/cm2/s
======================================================================
Image
Pre-slew 15.0-350.0 keV image (Event data)
#   RAcent    DECcent   POSerr    Theta     Phi              Peak Cts       SNR   Name
  225.0941    88.5716   0.0093    41.1401   -56.2264         2.3869696     20.751 TRIG_00359884

Foreground time interval of the image:
 -0.804   7.324 (delta_t =   8.128 [sec])
Background time interval of the image:
 -8.847  -0.804 (delta_t =   8.043 [sec])
Light Curves
Note: The mask-weighted lightcurves have units of either count/det or counts/sec/det, where a det is 0.4 x 0.4 = 0.16 sq cm.
Full-time range; 1 s binning
Other quick-look light curves:
- 64 ms binning (zoomed)
- 16 ms binning (zoomed)
- 8 ms binning (zoomed)
- 2 ms binning (zoomed)
- SN=5 or 10 s binning (full-time range)
- Raw light curve
Spectra
- 64 ms binning (zoomed)
- 16 ms binning (zoomed)
- 8 ms binning (zoomed)
- 2 ms binning (zoomed)
- SN=5 or 10 s binning (full-time range)
- Raw light curve
Spectra
Notes:
- 1) The fitting includes the systematic errors.
- 2) When the burst includes telescope slew time periods, the fitting uses an average response file made from multiple 5-s response files through out the slew time plus single time preiod for the non-slew times, and weighted by the total counts in the corresponding time period using addrmf. An average response file is needed becuase a spectral fit using the pre-slew DRM will introduce some errors in both a spectral shape and a normalization if the PHA file contains a lot of the slew/post-slew time interval.
- 3) For fits to more complicated models (e.g. a power-law over a cutoff power-law), the BAT team has decided to require a chi-square improvement of more than 6 for each extra dof.
Time averaged spectrum fit using the average DRM
Power-law model
Time interval is from   -0.804 sec. to    7.324 sec.

Spectral model in power-law:
------------------------------------------------------------
Parameters  : value       lower 90%   higher 90%
Photon index: -1.69947     ( -0.117479   0.116053 )
Norm@50keV  : 1.76139E-02    ( -0.00119792   0.00118968 )
------------------------------------------------------------
#Fit statistic : Chi-Squared =          55.16 using 59 PHA bins.
# Reduced chi-squared =         0.9676 for     57 degrees of freedom
# Null hypothesis probability =   5.446038e-01

Photon flux (15-150 keV)    in 8.128 sec: 2.33899 ( -0.15555  0.15589 ) ph/cm2/s
Energy fluence (15-150 keV)             : 1.32579e-06 ( -9.42076e-08  9.4783e-08 ) ergs/cm2
Cutoff power-law model

Time interval is from   -0.804 sec. to    7.324 sec.
Spectral model in the cutoff power-law:
------------------------------------------------------------
Parameters  : value       lower 90%   higher 90%
Photon index: -1.67244     ( -0.391838   0.412083 )
Epeak [keV] : 584.495      ( -9996.57 -9996.58 )
Norm@50keV  : 1.81950E-02    ( -0.00605171   0.0107294 )
------------------------------------------------------------
#Fit statistic : Chi-Squared =          55.19 using 59 PHA bins.
# Reduced chi-squared =         0.9856 for     56 degrees of freedom
# Null hypothesis probability =   5.053160e-01

Photon flux (15-150 keV)    in 8.128 sec: 2.34023 ( -0.16066  0.15536 ) ph/cm2/s
Energy fluence (15-150 keV)             : 1.32667e-06 ( -1.02154e-07  9.42653e-08 ) ergs/cm2
1-s peak spectrum fit
Power-law model
Time interval is from   -0.040 sec. to    0.960 sec.

Spectral model in power-law:
------------------------------------------------------------
Parameters  : value       lower 90%   higher 90%
Photon index: -1.33056     ( -0.113727   0.114303 )
Norm@50keV  : 7.11259E-02    ( -0.00475482   0.00475298 )
------------------------------------------------------------
#Fit statistic : Chi-Squared =          72.25 using 59 PHA bins.
# Reduced chi-squared =          1.268 for     57 degrees of freedom
# Null hypothesis probability =   8.394271e-02

Photon flux (15-150 keV)    in 1 sec: 8.53524 ( -0.59142  0.59212 ) ph/cm2/s
Energy fluence (15-150 keV)             : 6.97847e-07 ( -5.09279e-08  5.11326e-08 ) ergs/cm2
Cutoff power-law model
Time interval is from   -0.040 sec. to    0.960 sec.
Spectral model in the cutoff power-law:
------------------------------------------------------------
Parameters  : value       lower 90%   higher 90%
Photon index: -1.21717     ( -0.174185   0.437539 )
Epeak [keV] : 367.478      ( -367.725 -367.725 )
Norm@50keV  : 8.07669E-02    ( -0.0138462   0.0489807 )
------------------------------------------------------------
#Fit statistic : Chi-Squared =          72.03 using 59 PHA bins.
# Reduced chi-squared =          1.286 for     56 degrees of freedom
# Null hypothesis probability =   7.329674e-02

Photon flux (15-150 keV)    in 1 sec: 3.50385 ( -0.76124  0.82645 ) ph/cm2/s
Energy fluence (15-150 keV)             : 6.93777e-07 ( -5.33642e-08  5.25343e-08 ) ergs/cm2
Time-resolved spectra
Distribution
T90 vs. Hardness ratio plot
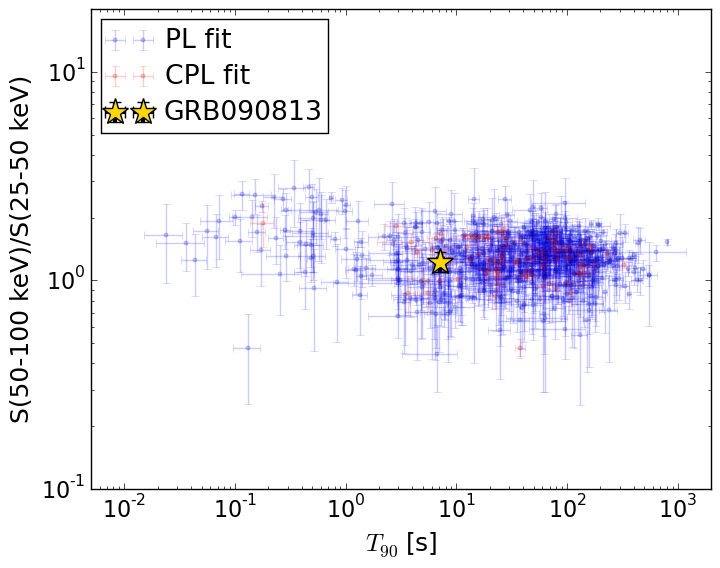
T90                                   = 7.144 sec.
Hardness ratio (energy fluence ratio) = 1.23162938496
S(15-50 keV) vs. S(50-150 keV) plot
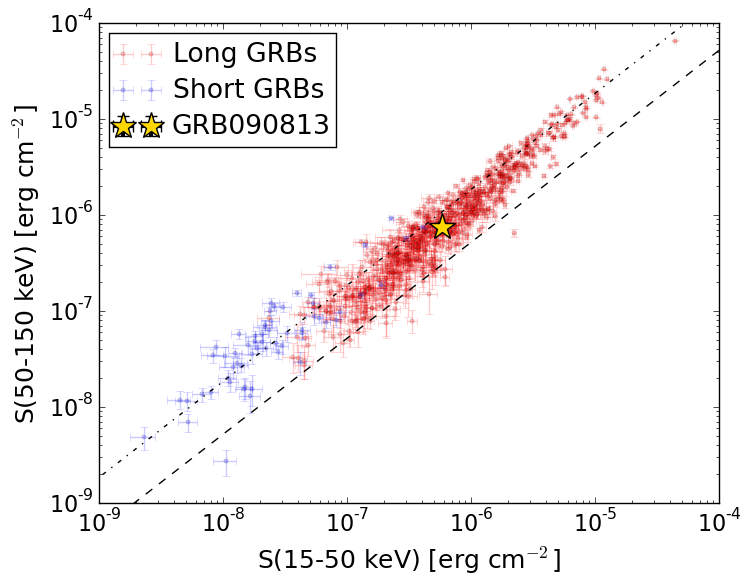
S(15-50 keV)  = 5.793253e-07
S(50-150 keV) = 7.464699e-07
The dash-dotted line and the dashed line traces the fluences calculated from the Band function with Epeak = 15 and 150 keV, respectively. Both lines assume a canonical values of alpha = -1 and beta = -2.5.
Mask shadow pattern
IMX = 4.856386814430063E-01, IMY = 7.261623316437079E-01
Spacecraft aspect plot
Bright source in the pre-burst/pre-slew/post-slew images
Pre-burst image of 15-350 keV band
Time interval of the image:
-8.847400 -0.804000

# RAcent  DECcent POSerr Theta    Phi  PeakCts   SNR AngSep     Name
#  [deg]    [deg]    ['] [deg]  [deg]                   [']
254.3372  35.2871    3.6  22.7 -169.3   0.0870   3.2    6.8	Her X-1
288.9072  10.9705    3.8  37.9  110.7   0.2657   3.0    6.6	GRS 1915+105
299.6620  35.2103    1.3  19.6   69.2   0.2599   8.6    3.6	Cyg X-1
308.2726  40.8720    7.6  21.5   44.4   0.0478   1.5    8.8	Cyg X-3
325.9911  38.3361    9.5  34.6   34.4   0.0520   1.2    8.5	Cyg X-2
Pre-slew background subtracted image of 15-350 keV band
Time interval of the image:
-0.804000 7.324000

# RAcent  DECcent POSerr Theta    Phi  PeakCts   SNR AngSep     Name
#  [deg]    [deg]    ['] [deg]  [deg]                   [']
254.2960  35.3979    4.2  22.6 -169.1  -0.1196  -2.7    8.6	Her X-1
288.7987  11.1096   12.9  37.7  110.8  -0.1120  -0.9    9.8	GRS 1915+105
299.4060  35.2989   20.5  19.4   69.4   0.0260   0.6   10.8	Cyg X-1
307.8938  41.0323    7.2  21.2   44.4   0.0732   1.6   10.9	Cyg X-3
326.3543  38.3463   34.0  34.8   34.1   0.0225   0.3    8.7	Cyg X-2
343.7394  30.3914    2.7  51.1   31.3   0.9062   4.3 ------	UNKNOWN
355.7444  57.4601    2.5  44.5   -6.3   0.3147   4.6 ------	UNKNOWN
349.1115  73.6778    2.2  38.8  -29.6   0.3507   5.3 ------	UNKNOWN
250.0376  62.9303    2.3  22.1  -91.2   0.2519   5.0 ------	UNKNOWN
225.0935  88.5716    0.6  41.1  -56.2   2.3870  20.8 ------	UNKNOWN
Post-slew image of 15-350 keV band
Time interval of the image:
67.552600 962.917100

# RAcent  DECcent POSerr Theta    Phi  PeakCts   SNR AngSep     Name
#  [deg]    [deg]    ['] [deg]  [deg]                   [']
254.5449  35.3278    5.3  53.4  157.8   5.8654   2.2    4.4	Her X-1
340.0399  50.4534    3.0  40.1   71.2   7.9336   3.8 ------	UNKNOWN
320.6169  57.9260    2.7  32.2   89.9   4.1183   4.2 ------	UNKNOWN
 47.6820  36.0760    3.9  55.3    5.1   6.4275   3.0 ------	UNKNOWN