Analysis Summary
Notes:
- 1) No attempt has been made to eliminate the non-significant decimal places.
- 2) This batgrbproduct analysis is done using the HEASARC data.
- 3) This batgrbproduct analysis is using the flight position for the mask-weighting calculation.
==========================================================================
           BAT GROUND-DETECTED GRB DATA PROCESSING REPORT
    Process Script Ver: batgrbproduct v2.46
    Process Start Time: Sun Jan 19 14:26:13 EST 2014
             Host Name: batevent1
   Current Working Dir: /local/data/batevent/batevent_reproc/trigger360068
======================================================================

  Trigger: 00360068      Segment: 000

  BAT Trigger Time: 272071304.224
               UTC: 2009-08-15T23:21:39.223   [includes UTCF correction]
       Where From?: Ground analysis (best_duration.txt)
  NOTE: BAT trigger time for ground-detected burst is the T100 start time.

  Analysis Position:   [ source = GCN ]
    RA: 64.473057422274   Dec: -65.9079370199645  [deg; J2000]

  Refined Position:   [ source = BAT pre-slew image ]
    RA: 64.4731   Dec: -65.9079  [deg; J2000]
        { 04h 17m 53.5s , -65d -54' -28.4" }
        +/- 2.8644758294 [arcmin] (estimated 90% radius based on SNR)
    SNR: 6.76477782494


  Angular difference between the analysis and refined position is 0.002454 arcmin

  Partial Coding Fraction: 0.765625    [ including projection effects ]

  Duration
     T90: 0.576000034809113 +/- 0.271529006335861
        Measured from: 0
                   to: 0.576     [s; relative to TRIGTIME]
     T50: 0.255999982357025 +/- 0.181019365655138
        Measured from: 0.192
                   to: 0.448     [s; relative to TRIGTIME]


====== Table of the duration information =============================

        Value   tstart    tstop
T100    0.704    0.000    0.704
T90     0.576    0.000    0.576
T50     0.256    0.192    0.448
Peak    1.000   -0.148    0.852


====== Spectral Analysis Summary =====================================

Model      : spectral model: simple power-law (PL) and cutoff power-law (CPL)
Ph_index   : photon index: E^{Ph_index}
Ph_90err   : 90% error of the photon index
Epeak      : Epeak in keV
Epeak_90err: 90% error of Epeak
Norm       : normalization at 50 keV in both the PL model and CPL model
Nomr_90err : 90% error of the normalization
chi2       : Chi-Squared
dof        : degree of freedo

=== Time-averaged spectral analysis ===
(Best model with acceptable fit: PL)

Model Ph_index Ph_90err_low Ph_90err_hi  Epeak  Epeak_90err_low  Epeak_90err_hi  Norm       Nomr_90err_low    Norm_90err_hi    chi2    dof
PL      -0.871    -0.432      0.485       -           -               -         5.55e-03     -1.52e-03          1.47e-03      56.900   57
CPL      0.102    -1.350      3.556      131.178    -131.178      -131.178      1.40e-02     -1.40e-02          2.42e-01      56.290   56


=== 1-s peak spectral analysis ===
(Best model with acceptable fit: PL)

Model Ph_index Ph_90err_low Ph_90err_hi  Epeak  Epeak_90err_low  Epeak_90err_hi  Norm       Nomr_90err_low    Norm_90err_hi    chi2    dof
PL      -0.752     -0.490     0.573       -           -               -         3.96e-03     -1.29e-03          1.22e-03      51.440   57
CPL      0.536     -1.712     3.859      126.719    -126.719      -126.719      1.23e-02     -1.23e-02          8.42e-01      50.810   56


=== Fluence/Peak Flux Summary ===

              Model    Band1     Band2     Band3     Band4     Band5     Total
                       15-25     25-50    50-100    100-350    15-150    15-350    keV
Fluence         PL   2.78e-09  7.53e-09  1.65e-08  9.45e-08  4.44e-08  1.21e-07   erg/cm2
      90%_error_low -1.39e-09 -2.58e-09 -4.37e-09 -4.63e-08 -1.17e-08 -4.94e-08   erg/cm2
      90%_error_hi   1.70e-09  2.50e-09  4.31e-09  7.39e-08  1.18e-08  7.36e-08   erg/cm2
Peak flux       PL   8.00e-02  1.26e-01  1.50e-01  3.46e-01  4.56e-01  7.02e-01   ph/cm2/s
      90%_error_low -4.64e-02 -5.29e-02 -4.18e-02 -1.70e-01 -1.36e-01 -2.08e-01   ph/cm2/s
      90%_error_hi   6.20e-02  5.27e-02  4.16e-02  2.68e-01  1.38e-01  2.39e-01   ph/cm2/s

Fluence        CPL   2.08e-09  7.78e-09  1.82e-08  3.49e-08  4.27e-08  6.30e-08   erg/cm2
      90%_error_low -1.68e-09 -3.04e-09 -5.35e-09 -2.84e-08 -1.27e-08 -3.11e-08   erg/cm2
      90%_error_hi   2.18e-09  2.93e-09  6.06e-09  1.03e-07  1.24e-08  7.85e-08   erg/cm2
Peak flux      CPL   5.03e-02  1.24e-01  1.72e-01  1.47e-01  4.30e-01  4.92e-01   ph/cm2/s
      90%_error_low -5.03e-02 -7.36e-02 -2.97e-02 -1.47e-01 -1.48e-01 -2.04e-01   ph/cm2/s
      90%_error_hi   8.30e-02  6.05e-02  6.57e-02  2.66e-01  1.50e-01  4.11e-01   ph/cm2/s

======================================================================
Image
15.0-350.0 keV image (Event data)
#RAcent DECcent POSerr Theta  Phi  Peak_Cts  SNR Name
64.473 -65.908 0.000 20.140 126.128 0.066 6.765 TRIG_00360068

Foreground time interval of the image: 0.000 to 0.704 [sec]
Background time interval of the image: -59.968 to 0.000 [sec]
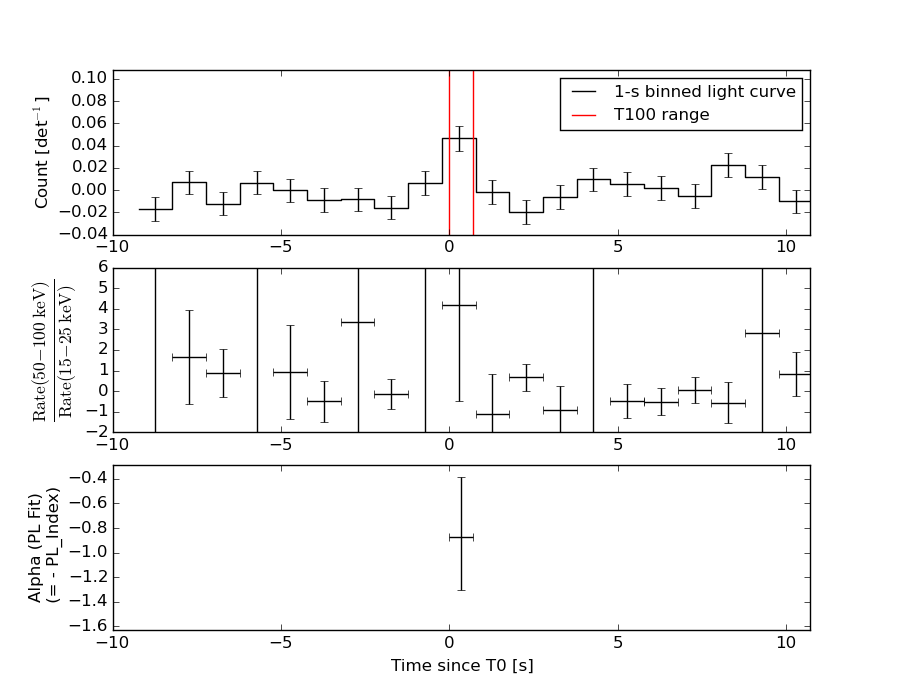
Light Curves
Note: The mask-weighted lightcurves have units of either count/det or counts/sec/det, where a det is 0.4 x 0.4 = 0.16 sq cm.
Best duration plot
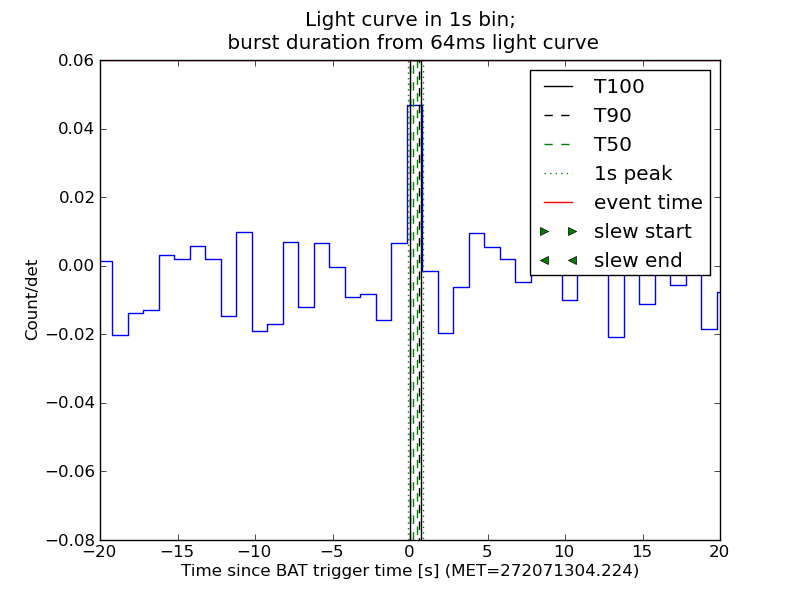
Full-time range; 1 s binning
Other quick-look light curves:
- 64 ms binning (zoomed)
- 16 ms binning (zoomed)
- 8 ms binning (zoomed)
- 2 ms binning (zoomed)
- SN=5 or 10 s binning (full-time range)
- Raw light curve
Spectra
- 64 ms binning (zoomed)
- 16 ms binning (zoomed)
- 8 ms binning (zoomed)
- 2 ms binning (zoomed)
- SN=5 or 10 s binning (full-time range)
- Raw light curve
Spectra
Notes:
- 1) The fitting includes the systematic errors.
- 2) When the burst includes telescope slew time periods, the fitting uses an average response file made from multiple 5-s response files through out the slew time plus single time preiod for the non-slew times, and weighted by the total counts in the corresponding time period using addrmf. An average response file is needed becuase a spectral fit using the pre-slew DRM will introduce some errors in both a spectral shape and a normalization if the PHA file contains a lot of the slew/post-slew time interval.
- 3) For fits to more complicated models (e.g. a power-law over a cutoff power-law), the BAT team has decided to require a chi-square improvement of more than 6 for each extra dof.
Time averaged spectrum fit using the average DRM
Power-law model
Time interval is from    0.000 sec. to    0.704 sec.

Spectral model in power-law:
------------------------------------------------------------
Parameters  : value       lower 90%   higher 90%
Photon index: -0.871042     ( -0.432356   0.484856 )
Norm@50keV  : 5.55413E-03    ( -0.00151806   0.00147005 )
------------------------------------------------------------
#Fit statistic : Chi-Squared =          56.90 using 59 PHA bins.
# Reduced chi-squared =         0.9982 for     57 degrees of freedom
# Null hypothesis probability =   4.789418e-01

Photon flux (15-150 keV)    in 0.704 sec: 0.637445 ( -0.168771  0.170742 ) ph/cm2/s
Energy fluence (15-150 keV)             : 4.43887e-08 ( -1.1668e-08  1.17629e-08 ) ergs/cm2
Cutoff power-law model
Time interval is from    0.000 sec. to    0.704 sec.
Spectral model in the cutoff power-law:
------------------------------------------------------------
Parameters  : value       lower 90%   higher 90%
Photon index: 0.102342     ( -1.34968   3.55555 )
Epeak [keV] : 131.178      ( -131.171 -131.171 )
Norm@50keV  : 1.40483E-02    ( -0.0140496   0.241909 )
------------------------------------------------------------
#Fit statistic : Chi-Squared =          56.29 using 59 PHA bins.
# Reduced chi-squared =          1.005 for     56 degrees of freedom
# Null hypothesis probability =   4.639199e-01

Photon flux (15-150 keV)    in 0.704 sec: 0.611278 ( -0.181219  0.18052 ) ph/cm2/s
Energy fluence (15-150 keV)             : 4.27379e-08 ( -1.26776e-08  1.24371e-08 ) ergs/cm2
1-s peak spectrum fit
Power-law model
Time interval is from   -0.148 sec. to    0.852 sec.

Spectral model in power-law:
------------------------------------------------------------
Parameters  : value       lower 90%   higher 90%
Photon index: -0.751514     ( -0.489665   0.572986 )
Norm@50keV  : 3.96075E-03    ( -0.00128996   0.00121924 )
------------------------------------------------------------
#Fit statistic : Chi-Squared =          51.44 using 59 PHA bins.
# Reduced chi-squared =         0.9025 for     57 degrees of freedom
# Null hypothesis probability =   6.827511e-01

Photon flux (15-150 keV)    in 1 sec: 0.456228 ( -0.135662  0.138454 ) ph/cm2/s
Energy fluence (15-150 keV)             : 4.72596e-08 ( -1.34648e-08  1.35427e-08 ) ergs/cm2
Cutoff power-law model
Time interval is from   -0.148 sec. to    0.852 sec.
Spectral model in the cutoff power-law:
------------------------------------------------------------
Parameters  : value       lower 90%   higher 90%
Photon index: 0.535785     ( -1.71288   3.85862 )
Epeak [keV] : 126.719      ( -126.683 -126.683 )
Norm@50keV  : 1.23244E-02    ( -0.0123328   0.842291 )
------------------------------------------------------------
#Fit statistic : Chi-Squared =          50.81 using 59 PHA bins.
# Reduced chi-squared =         0.9074 for     56 degrees of freedom
# Null hypothesis probability =   6.709195e-01

Photon flux (15-150 keV)    in 1 sec: 0.429913 ( -0.148389  0.149521 ) ph/cm2/s
Energy fluence (15-150 keV)             : 4.53618e-08 ( -1.4873e-08  1.4361e-08 ) ergs/cm2
Time-resolved spectra
Distribution
T90 vs. Hardness ratio plot
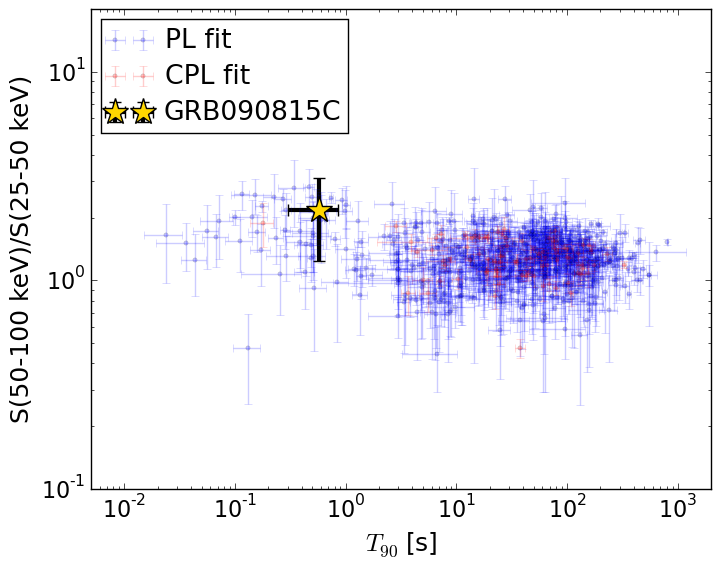
T90                                   = 0.576 sec.
Hardness ratio (energy fluence ratio) = 2.18700535843
S(15-50 keV) vs. S(50-150 keV) plot
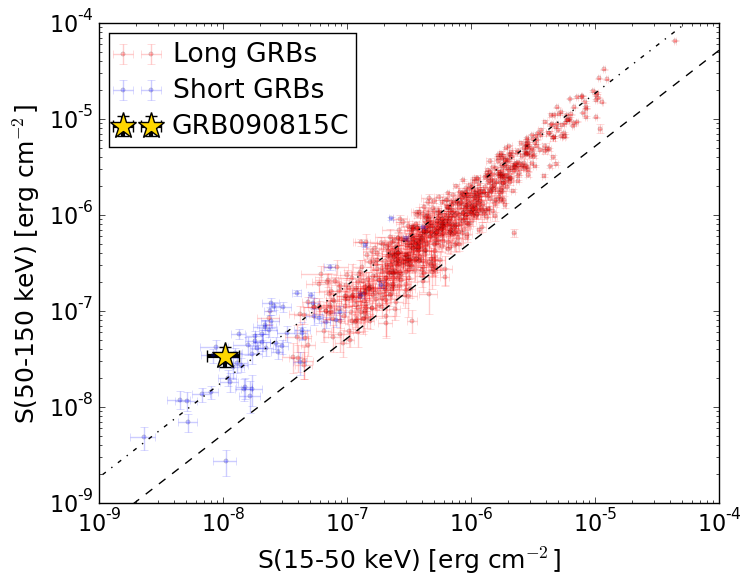
S(15-50 keV)  = 1.0309556e-08
S(50-150 keV) = 3.40795e-08
The dash-dotted line and the dashed line traces the fluences calculated from the Band function with Epeak = 15 and 150 keV, respectively. Both lines assume a canonical values of alpha = -1 and beta = -2.5.
Mask shadow pattern
IMX = -0.216228511386, IMY = -0.29621946837
Spacecraft aspect plot
Bright source in the event data image
Event data image of 15-350 keV band
Time interval of the image:
0.000000 0.704000

# RAcent  DECcent POSerr Theta    Phi  PeakCts   SNR AngSep     Name
#  [deg]    [deg]    ['] [deg]  [deg]                   [']
135.3741 -40.4933    4.6  29.1  -94.9   0.0327   2.6    8.0	Vela X-1
170.0175 -60.5111    7.4  23.3  -26.5  -0.0136  -1.6   11.1	Cen X-3
186.5425 -62.9510    9.3  27.7  -10.4  -0.0116  -1.2   11.3	GX 301-2
 64.4995 -65.9451    1.7  20.1  126.0   0.0684   6.9 ------	UNKNOWN
156.8843 -32.3192    2.5  42.2  -70.8   0.1560   4.6 ------	UNKNOWN
Webpage updated on:
Wed Nov 25 14:24:50 EST 2015