Analysis Summary
Notes:
- 1) No attempt has been made to eliminate the non-significant decimal places.
- 2) This batgrbproduct analysis is done using the HEASARC data.
- 3) This batgrbproduct analysis is using the flight position for the mask-weighting calculation.
==========================================================================
           BAT GROUND-DETECTED GRB DATA PROCESSING REPORT
            (This burst occurred during telescope slew)
    Process Script Ver: batgrbproduct v2.46
    Process Start Time: Mon Mar 23 14:19:40 EDT 2015
             Host Name: bat1
   Current Working Dir: /local/data/bat1/alien/Swift_3rdBATcatalog/event/batevent_reproc/GRB090823
======================================================================

  Trigger: 00036390      Segment: 005

  BAT Trigger Time: 272736676.8
               UTC: 2009-08-23T16:11:11.777   [includes UTCF correction]
       Where From?: Ground analysis (best_duration.txt)
  NOTE: BAT trigger time for ground-detected burst during slew is the T100 start time.

  Refined Position:   [ source = BAT mosaic image ]
    RA: 128.701911074135   Dec: 60.6029026479423  [deg; J2000]
        { 08h 34m 48.5s , +60d 36' 10.4" }
        +/- 2.06054729292 [arcmin] (estimated 90% radius based on SNR)
    SNR: 10.830004702


  Angular difference between the analysis and refined position is Usage: arcmin

  Partial Coding Fraction: Unavailable because the burst occurred during slew.

  Duration
     T90: 25.6000000238419 +/- 1.6
        Measured from: 0
                   to: 25.6     [s; relative to TRIGTIME]
     T50: 14.4000000357628 +/- 1.6
        Measured from: 3.2
                   to: 17.6     [s; relative to TRIGTIME]


====== Table of the duration information =============================

        Value   tstart    tstop
T100   27.200    0.000   27.200
T90    25.600    0.000   25.600
T50    14.400    3.200   17.600
Peak    1.000    3.500    4.500


====== Spectral Analysis Summary =====================================

Model      : spectral model: simple power-law (PL) and cutoff power-law (CPL)
Ph_index   : photon index: E^{Ph_index}
Ph_90err   : 90% error of the photon index
Epeak      : Epeak in keV
Epeak_90err: 90% error of Epeak
Norm       : normalization at 50 keV in both the PL model and CPL model
Nomr_90err : 90% error of the normalization
chi2       : Chi-Squared
dof        : degree of freedo

=== Time-averaged spectral analysis ===
(Best model with acceptable fit: PL)

Model Ph_index Ph_90err_low Ph_90err_hi  Epeak  Epeak_90err_low  Epeak_90err_hi  Norm       Nomr_90err_low    Norm_90err_hi    chi2    dof
PL      -2.263    -0.323      0.291       -           -               -         1.27e-03     -2.92e-04          2.87e-04      43.690   57
CPL     -2.352    -0.294      1.870      159.682      N/A           N/A         1.11e-03        N/A               N/A         43.690   56


=== 1-s peak spectral analysis ===
(Best model with acceptable fit: N/A)

Model Ph_index Ph_90err_low Ph_90err_hi  Epeak  Epeak_90err_low  Epeak_90err_hi  Norm       Nomr_90err_low    Norm_90err_hi    chi2    dof
PL      N/A         N/A       N/A          -           -               -           N/A           N/A               N/A         N/A        N/A
CPL     N/A         N/A       N/A          N/A         N/A           N/A           N/A           N/A               N/A         N/A        N/A


=== Fluence/Peak Flux Summary ===

              Model    Band1     Band2     Band3     Band4     Band5     Total
                       15-25     25-50    50-100    100-350    15-150    15-350    keV
Fluence         PL   5.32e-08  6.17e-08  5.14e-08  7.22e-08  1.92e-07  2.38e-07   erg/cm2
      90%_error_low -9.29e-09 -9.87e-09 -1.55e-08 -3.44e-08 -3.57e-08 -5.74e-08   erg/cm2
      90%_error_hi   9.36e-09  9.59e-09  1.69e-08  5.21e-08  3.77e-08  7.18e-08   erg/cm2
Peak flux       PL     N/A      N/A      N/A      N/A      N/A      N/A     ph/cm2/s
Image
Note1: The mosaic image is made with timebin = 0.10 s; energybin = 15-350 keV
Note2: The mosaic image uses Galactic coordinate.
#RAcent DECcent POSerr Theta  Phi  Peak_Cts  SNR Name
128.702 60.603 0.006 35.833 -119.222 0.024 10.830 UNKNOWN

Image time interval: 11.200 to 27.200 [sec]
Light Curves
Note: The mask-weighted lightcurves have units of either count/det or counts/sec/det, where a det is 0.4 x 0.4 = 0.16 sq cm.
Best duration plot
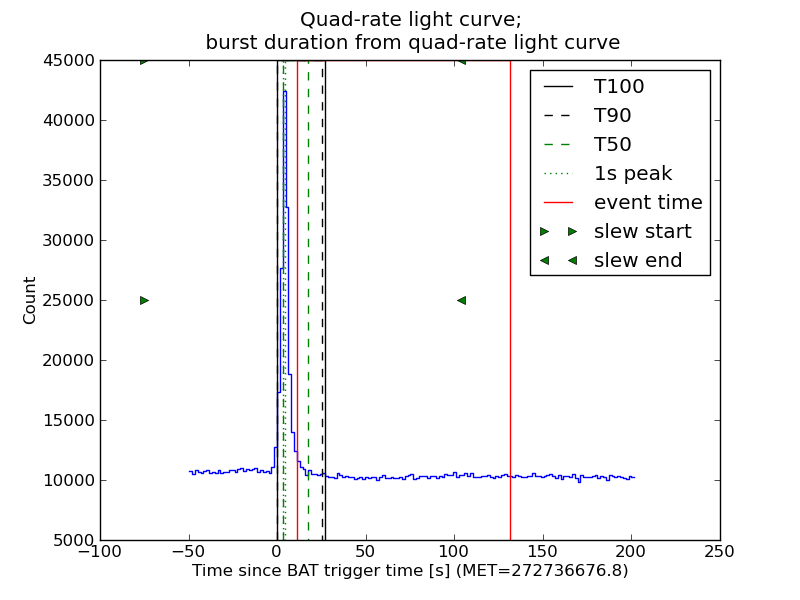
Full-time range; 1 s binning
Other quick-look light curves:
- 64 ms binning (zoomed)
- 16 ms binning (zoomed)
- 8 ms binning (zoomed)
- 2 ms binning (zoomed)
- SN=5 or 10 s binning (full-time range)
- Raw light curve
Spectra
- 64 ms binning (zoomed)
- 16 ms binning (zoomed)
- 8 ms binning (zoomed)
- 2 ms binning (zoomed)
- SN=5 or 10 s binning (full-time range)
- Raw light curve
Spectra
Notes:
- 1) The fitting includes the systematic errors.
- 2) When the burst includes telescope slew time periods, the fitting uses an average response file made from multiple 5-s response files through out the slew time plus single time preiod for the non-slew times, and weighted by the total counts in the corresponding time period using addrmf. An average response file is needed becuase a spectral fit using the pre-slew DRM will introduce some errors in both a spectral shape and a normalization if the PHA file contains a lot of the slew/post-slew time interval.
- 3) For fits to more complicated models (e.g. a power-law over a cutoff power-law), the BAT team has decided to require a chi-square improvement of more than 6 for each extra dof.
Time averaged spectrum fit using the average DRM
Power-law model
Time interval is from   11.200 sec. to   27.200 sec.

Spectral model in power-law:
------------------------------------------------------------
Parameters  : value       lower 90%   higher 90%
Photon index: -2.2629     ( -0.323365   0.290953 )
Norm@50keV  : 1.26576E-03    ( -0.000291943   0.000286924 )
------------------------------------------------------------
#Fit statistic : Chi-Squared =          43.69 using 59 PHA bins.
# Reduced chi-squared =         0.7665 for     57 degrees of freedom
# Null hypothesis probability =   9.024593e-01

Photon flux (15-150 keV)    in 16 sec: 0.216752 ( -0.030316  0.030339 ) ph/cm2/s
Energy fluence (15-150 keV)             : 1.92314e-07 ( -3.56962e-08  3.77299e-08 ) ergs/cm2
Cutoff power-law model
Time interval is from   11.200 sec. to   27.200 sec.
Spectral model in the cutoff power-law:
------------------------------------------------------------
Parameters  : value       lower 90%   higher 90%
Photon index: -2.35236     ( -0.294517   1.8697 )
Epeak [keV] : 159.682      (   )
Norm@50keV  : 1.11275E-03    (     )
------------------------------------------------------------
#Fit statistic : Chi-Squared =          43.69 using 59 PHA bins.
# Reduced chi-squared =         0.7802 for     56 degrees of freedom
# Null hypothesis probability =   8.843664e-01

Photon flux (15-150 keV)    in 16 sec: 0.214598 ( -0.0302  0.030024 ) ph/cm2/s
Energy fluence (15-150 keV)             : 1.93344e-07 ( -3.62933e-08  3.89618e-08 ) ergs/cm2
1-s peak spectrum fit
1-s peak spectrum unavailable, likely because there are no event data in the 1-s peak range.
Time-resolved spectra
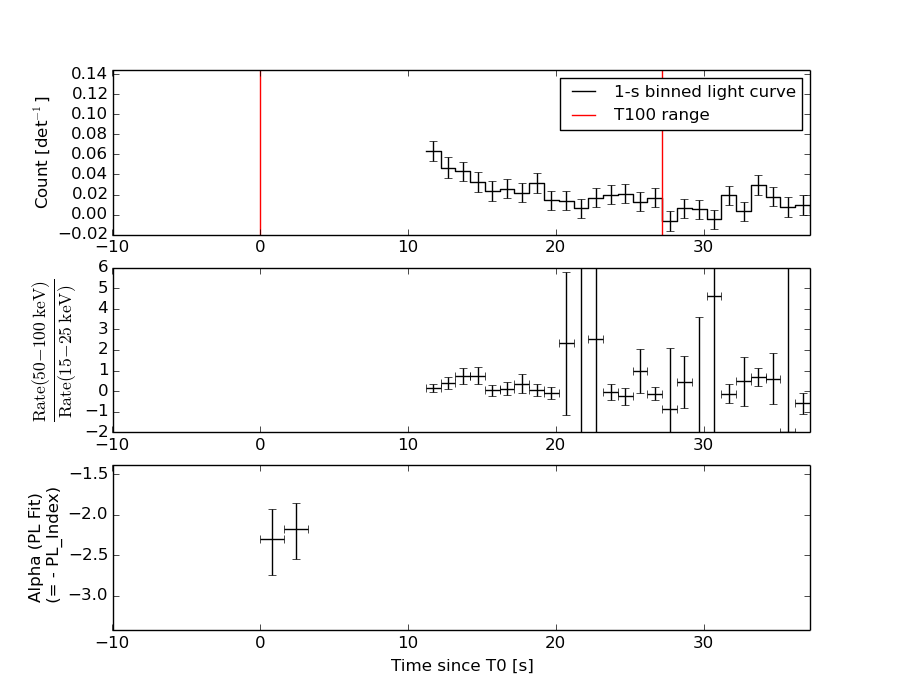
Distribution
T90 vs. Hardness ratio plot
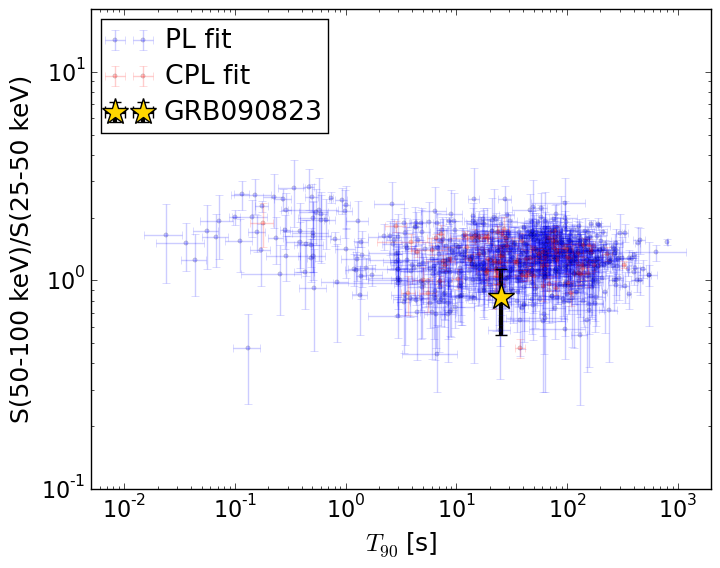
T90                                   = 25.6 sec.
Hardness ratio (energy fluence ratio) = 0.833470115945
S(15-50 keV) vs. S(50-150 keV) plot
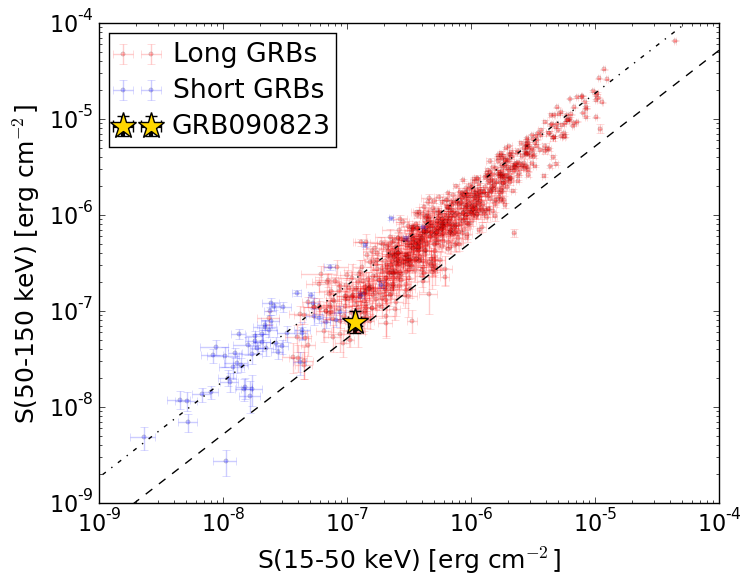
S(15-50 keV)  = 1.1490124e-07
S(50-150 keV) = 7.741131e-08
The dash-dotted line and the dashed line traces the fluences calculated from the Band function with Epeak = 15 and 150 keV, respectively. Both lines assume a canonical values of alpha = -1 and beta = -2.5.
Mask shadow pattern
Mask shadow pattern unavailable because this burst occurs during telescope slews.Spacecraft aspect plot