Analysis Summary
Notes:
- 1) No attempt has been made to eliminate the non-significant decimal places.
- 2) This batgrbproduct analysis is done using the HEASARC data.
- 3) This batgrbproduct analysis is using the flight position for the mask-weighting calculation.
======================================================================
BAT GRB EVENT DATA PROCESSING REPORT
Process Script Ver: batgrbproduct v2.46
Process Start Time: Sun Jan 19 14:23:21 EST 2014
Host Name: batevent1
Current Working Dir: /local/data/batevent/batevent_reproc/trigger361489
======================================================================
Trigger: 00361489 Segment: 000
BAT Trigger Time: 273447030.976 [s; MET]
Trigger Stop: 273447036.48 [s; MET]
UTC: 2009-08-31T21:30:25.929900 [includes UTCF correction]
Where From?: TDRSS position message
BAT
RA: 108.278334509616 Dec: -25.1000128821772 [deg; J2000]
Catalogged Source?: NO
Point Source?: YES
GRB Indicated?: YES [ by BAT flight software ]
Image S/N Ratio: 8.36
Image Trigger?: NO
Rate S/N Ratio: 10 [ if not an image trigger ]
Image S/N Ratio: 8.36
Analysis Position: [ source = BAT ]
RA: 108.278334509616 Dec: -25.1000128821772 [deg; J2000]
Refined Position: [ source = BAT pre-slew burst ]
RA: 108.278 Dec: -25.1 [deg; J2000]
{ 07h 13m 06.7s , -25d -6' -0.0" }
+/- 2.4320250741 [arcmin] (estimated 90% radius based on SNR)
SNR: 8.54657821917
Angular difference between the analysis and refined position is 0.018192 arcmin
Partial Coding Fraction: 0.84375 [ including projection effects ]
Duration
T90: 77.9520000219345 +/- 14.7999221917989
Measured from: 1.11199998855591
to: 79.0640000104904 [s; relative to TRIGTIME]
T50: 53.3120000362396 +/- 27.6332553388862
Measured from: 3.28799998760223
to: 56.6000000238419 [s; relative to TRIGTIME]
Fluence
Peak Flux (peak 1 second)
Measured from: 1.92399996519089
to: 2.92399996519089 [s; relative to TRIGTIME]
Total Fluence
Measured from: 0.407999992370605
to: 81.1759999990463 [s; relative to TRIGTIME]
Band 1 Band 2 Band 3 Band 4
15-25 25-50 50-100 100-350 keV
Total 0.178726 0.187652 0.151548 0.083633
0.050343 0.051848 0.045372 0.039819 [error]
Peak 0.013926 0.026721 0.019108 0.009898
0.005856 0.005873 0.005415 0.004544 [error]
[ fluence units of on-axis counts / fully illuminated detector ]
======================================================================
====== Table of the duration information =============================
Value tstart tstop
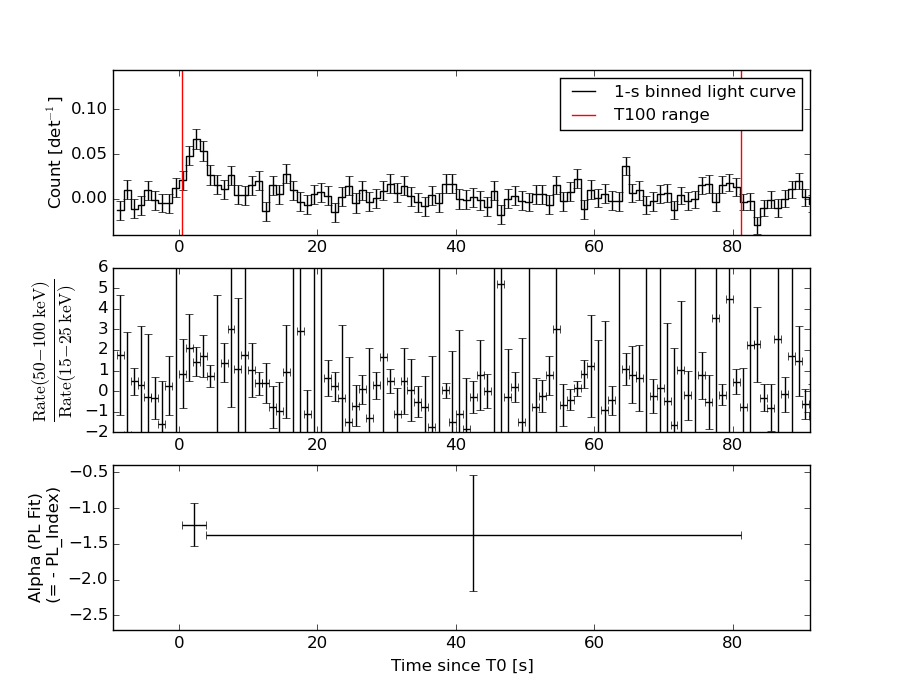
T100 80.768 0.408 81.176
T90 77.952 1.112 79.064
T50 53.312 3.288 56.600
Peak 1.000 1.924 2.924
====== Spectral Analysis Summary =====================================
Model : spectral model: simple power-law (PL) and cutoff power-law (CPL)
Ph_index : photon index: E^{Ph_index}
Ph_90err : 90% error of the photon index
Epeak : Epeak in keV
Epeak_90err: 90% error of Epeak
Norm : normalization at 50 keV in both the PL model and CPL model
Nomr_90err : 90% error of the normalization
chi2 : Chi-Squared
dof : degree of freedo
=== Time-averaged spectral analysis ===
(Best model with acceptable fit: PL)
Model Ph_index Ph_90err_low Ph_90err_hi Epeak Epeak_90err_low Epeak_90err_hi Norm Nomr_90err_low Norm_90err_hi chi2 dof
PL -1.311 -0.495 0.519 - - - 4.78e-04 -1.24e-04 1.23e-04 59.360 57
CPL -1.325 -0.481 0.539 9999.340 -9999.340 -9999.340 4.79e-04 -1.23e-04 1.17e-03 59.370 56
=== 1-s peak spectral analysis ===
(Best model with acceptable fit: PL)
Model Ph_index Ph_90err_low Ph_90err_hi Epeak Epeak_90err_low Epeak_90err_hi Norm Nomr_90err_low Norm_90err_hi chi2 dof
PL -1.180 -0.459 0.496 - - - 4.66e-03 -1.16e-03 1.16e-03 39.530 57
CPL -1.191 1.191 1.086 9999.350 N/A N/A 4.68e-03 N/A N/A 39.540 56
=== Fluence/Peak Flux Summary ===
Model Band1 Band2 Band3 Band4 Band5 Total
15-25 25-50 50-100 100-350 15-150 15-350 keV
Fluence PL 4.13e-08 8.52e-08 1.37e-07 4.96e-07 3.80e-07 7.59e-07 erg/cm2
90%_error_low -1.90e-08 -2.51e-08 -4.66e-08 -2.88e-07 -1.11e-07 -3.32e-07 erg/cm2
90%_error_hi 2.12e-08 2.38e-08 4.52e-08 5.13e-07 1.14e-07 5.23e-07 erg/cm2
Peak flux PL 1.41e-01 1.72e-01 1.52e-01 2.30e-01 5.45e-01 6.95e-01 ph/cm2/s
90%_error_low -6.65e-02 -5.39e-02 -4.46e-02 -1.18e-01 -1.40e-01 -1.80e-01 ph/cm2/s
90%_error_hi 7.65e-02 5.08e-02 4.31e-02 1.86e-01 1.41e-01 1.90e-01 ph/cm2/s
Fluence CPL 4.13e-08 8.52e-08 1.37e-07 5.72e-07 3.83e-07 7.86e-07 erg/cm2
90%_error_low N/A N/A N/A -4.62e-07 N/A -4.78e-07 erg/cm2
90%_error_hi N/A N/A N/A 1.23e-07 N/A 3.57e-07 erg/cm2
Peak flux CPL 1.41e-01 1.72e-01 1.51e-01 2.29e-01 5.50e-01 7.00e-01 ph/cm2/s
90%_error_low N/A N/A N/A N/A -1.62e-01 -2.10e-01 ph/cm2/s
90%_error_hi N/A N/A N/A N/A 1.65e-01 1.64e-01 ph/cm2/s
======================================================================
Image
Pre-slew 25.0-100.0 keV image (Event data)
#RAcent DECcent POSerr Theta  Phi  Peak_Cts  SNR Name
108.278 -25.100 0.000 23.376 -39.373 0.160 8.547 TRIG_00361489

Image time interval: 0.000 to 5.504 [sec]
Light Curves
Note: The mask-weighted lightcurves have units of either count/det or counts/sec/det, where a det is 0.4 x 0.4 = 0.16 sq cm.
Full-time range; 1 s binning
Other quick-look light curves:
- 64 ms binning (zoomed)
- 16 ms binning (zoomed)
- 8 ms binning (zoomed)
- 2 ms binning (zoomed)
- SN=5 or 10 s binning (full-time range)
- Raw light curve
Spectra
- 64 ms binning (zoomed)
- 16 ms binning (zoomed)
- 8 ms binning (zoomed)
- 2 ms binning (zoomed)
- SN=5 or 10 s binning (full-time range)
- Raw light curve
Spectra
Notes:
- 1) The fitting includes the systematic errors.
- 2) When the burst includes telescope slew time periods, the fitting uses an average response file made from multiple 5-s response files through out the slew time plus single time preiod for the non-slew times, and weighted by the total counts in the corresponding time period using addrmf. An average response file is needed becuase a spectral fit using the pre-slew DRM will introduce some errors in both a spectral shape and a normalization if the PHA file contains a lot of the slew/post-slew time interval.
- 3) For fits to more complicated models (e.g. a power-law over a cutoff power-law), the BAT team has decided to require a chi-square improvement of more than 6 for each extra dof.
Time averaged spectrum fit using the average DRM
Power-law model
Time interval is from    0.408 sec. to   81.176 sec.

Spectral model in power-law:
------------------------------------------------------------
Parameters  : value       lower 90%   higher 90%
Photon index: -1.3113     ( -0.495123   0.518873 )
Norm@50keV  : 4.77831E-04    ( -0.00012434   0.00012331 )
------------------------------------------------------------
#Fit statistic : Chi-Squared =          59.36 using 59 PHA bins.
# Reduced chi-squared =          1.041 for     57 degrees of freedom
# Null hypothesis probability =   3.895380e-01

Photon flux (15-150 keV)    in 80.77 sec: 5.71272E-02 ( -0.0150076  0.0150378 ) ph/cm2/s
Energy fluence (15-150 keV)             : 3.80391e-07 ( -1.11269e-07  1.14147e-07 ) ergs/cm2
Cutoff power-law model
Time interval is from    0.408 sec. to   81.176 sec.
Spectral model in the cutoff power-law:
------------------------------------------------------------
Parameters  : value       lower 90%   higher 90%
Photon index: -1.3251     ( -0.482484   0.538277 )
Epeak [keV] : 9999.34      ( -9999.36 -9999.36 )
Norm@50keV  : 4.78959E-04    ( -0.000123613   0.00116785 )
------------------------------------------------------------
#Fit statistic : Chi-Squared =          59.37 using 59 PHA bins.
# Reduced chi-squared =          1.060 for     56 degrees of freedom
# Null hypothesis probability =   3.537623e-01

Photon flux (15-150 keV)    in 80.77 sec: 5.73345E-02 ( -0.0153883  0.014981 ) ph/cm2/s
Energy fluence (15-150 keV)             : 3.83054e-07 ( 0  0 ) ergs/cm2
1-s peak spectrum fit
Power-law model
Time interval is from    1.924 sec. to    2.924 sec.

Spectral model in power-law:
------------------------------------------------------------
Parameters  : value       lower 90%   higher 90%
Photon index: -1.18024     ( -0.459058   0.496432 )
Norm@50keV  : 4.65709E-03    ( -0.00115817   0.00115718 )
------------------------------------------------------------
#Fit statistic : Chi-Squared =          39.53 using 59 PHA bins.
# Reduced chi-squared =         0.6935 for     57 degrees of freedom
# Null hypothesis probability =   9.622621e-01

Photon flux (15-150 keV)    in 1 sec: 0.545177 ( -0.140497  0.140973 ) ph/cm2/s
Energy fluence (15-150 keV)             : 4.75215e-08 ( -1.30532e-08  1.32668e-08 ) ergs/cm2
Cutoff power-law model
Time interval is from    1.924 sec. to    2.924 sec.
Spectral model in the cutoff power-law:
------------------------------------------------------------
Parameters  : value       lower 90%   higher 90%
Photon index: -2.77795     ( 2.77713   2.67262 )
Epeak [keV] : 230.076      (   )
Norm@50keV  : 5.46021E-04    (     )
------------------------------------------------------------
#Fit statistic : Chi-Squared =          39.36 using 59 PHA bins.
# Reduced chi-squared =         0.7029 for     56 degrees of freedom
# Null hypothesis probability =   9.551530e-01

Photon flux (15-150 keV)    in 1 sec: 0.549999 ( -0.162176  0.164871 ) ph/cm2/s
Energy fluence (15-150 keV)             : 4.81837e-08 ( -1.38572e-08  1.23964e-08 ) ergs/cm2
Time-resolved spectra
Distribution
T90 vs. Hardness ratio plot
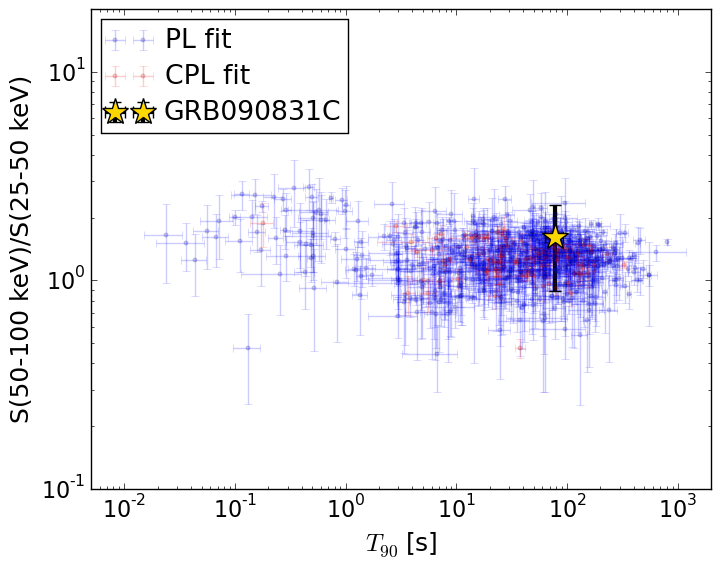
T90                                   = 77.952 sec.
Hardness ratio (energy fluence ratio) = 1.61190646849
S(15-50 keV) vs. S(50-150 keV) plot
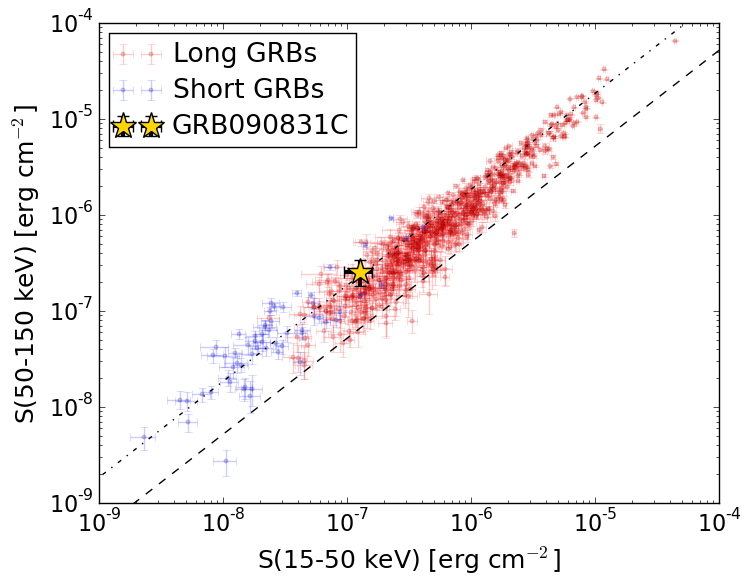
S(15-50 keV)  = 1.2650494e-07
S(50-150 keV) = 2.538845e-07
The dash-dotted line and the dashed line traces the fluences calculated from the Band function with Epeak = 15 and 150 keV, respectively. Both lines assume a canonical values of alpha = -1 and beta = -2.5.
Mask shadow pattern
IMX = 0.334132621021, IMY = 0.274198475222
Spacecraft aspect plot
Bright source in the pre-burst/pre-slew/post-slew images
Pre-burst image of 15-350 keV band
Time interval of the image:
-239.976000 0.408000

# RAcent  DECcent POSerr Theta    Phi  PeakCts   SNR AngSep     Name
#  [deg]    [deg]    ['] [deg]  [deg]                   [']
 83.6448  22.0147    0.3  32.8  179.4   9.7479  39.6    0.6	Crab
135.5127 -40.5983    2.2  50.8  -36.2   4.1535   5.3    2.7	Vela X-1
 96.2037   1.5188    3.1  13.8 -140.2   0.6907   3.8 ------	UNKNOWN
135.9203 -27.3662    3.2  47.1  -53.1   3.4014   3.7 ------	UNKNOWN
Pre-slew background subtracted image of 15-350 keV band
Time interval of the image:
0.408000 54.524600

# RAcent  DECcent POSerr Theta    Phi  PeakCts   SNR AngSep     Name
#  [deg]    [deg]    ['] [deg]  [deg]                   [']
 83.5060  21.9544    8.2  32.8  179.2   0.1361   1.4    7.9	Crab
135.6260 -40.3996    6.3  50.8  -36.5   0.5570   1.8   10.3	Vela X-1
 50.7460  14.5348    2.6  45.5  131.4   1.5700   4.4 ------	UNKNOWN
 52.0311 -47.2824    2.1  48.4   42.1   1.9772   5.5 ------	UNKNOWN
 70.0226  31.2833    2.6  45.5  165.8   0.8001   4.5 ------	UNKNOWN
108.3298 -25.1560    1.9  23.4  -39.3   0.5489   6.0 ------	UNKNOWN
Post-slew image of 15-350 keV band
Time interval of the image:
101.524580 962.066100

# RAcent  DECcent POSerr Theta    Phi  PeakCts   SNR AngSep     Name
#  [deg]    [deg]    ['] [deg]  [deg]                   [']
 83.6390  22.0182    0.6  52.8  177.8  32.6171  19.0    0.4	Crab
135.5204 -40.5576    0.3  27.4  -22.2  16.6772  34.4    0.4	Vela X-1
170.3666 -60.6540   12.6  54.7   -5.2  -1.2820  -0.9    2.4	Cen X-3
 62.8100 -28.1591    3.7  40.5  102.1   6.0871   3.2 ------	UNKNOWN
 72.4185 -41.0040    2.5  33.7   79.7   4.3278   4.6 ------	UNKNOWN
 78.7116  22.8248    2.8  55.9  173.5  11.4031   4.2 ------	UNKNOWN
173.6351 -63.7362    2.9  56.8   -1.9   9.9465   4.0 ------	UNKNOWN
139.0214 -53.2853    2.7  36.4   -4.2   3.2061   4.3 ------	UNKNOWN
176.6833 -57.4672    2.7  57.5   -9.5   9.2828   4.3 ------	UNKNOWN
100.8424  26.8958    3.6  52.5 -161.6   4.8308   3.2 ------	UNKNOWN
161.0139 -42.5269    3.5  46.3  -27.4   2.9311   3.3 ------	UNKNOWN
165.7237 -40.8739    2.2  49.7  -29.8   6.1525   5.2 ------	UNKNOWN
160.3025 -23.9089    3.2  47.0  -53.1   9.1808   3.7 ------	UNKNOWN