Analysis Summary
Notes:
- 1) No attempt has been made to eliminate the non-significant decimal places.
- 2) This batgrbproduct analysis is done using the HEASARC data.
- 3) This batgrbproduct analysis is using the flight position for the mask-weighting calculation.
======================================================================
                  BAT GRB EVENT DATA PROCESSING REPORT
    Process Script Ver: batgrbproduct v2.46
    Process Start Time: Sun Jan 19 14:17:27 EST 2014
             Host Name: batevent1
   Current Working Dir: /local/data/batevent/batevent_reproc/trigger361830
======================================================================

  Trigger: 00361830      Segment: 000

  BAT Trigger Time: 273718872   [s; MET]
      Trigger Stop: 273718936   [s; MET]
               UTC: 2009-09-04T01:01:06.945020    [includes UTCF correction]
       Where From?: TDRSS position message

  BAT
    RA: 100.882120511926   Dec: 50.206547663391  [deg; J2000]

     Catalogged Source?: NO
     Point Source?:      YES
     GRB Indicated?:     YES    [ by BAT flight software ]
     Image S/N Ratio:    10.83
     Image Trigger?:     YES
     Rate S/N Ratio:     0  [ if not an image trigger ]
     Image S/N Ratio:    10.83

  Analysis Position:   [ source = BAT ]
    RA: 100.882120511926   Dec: 50.206547663391  [deg; J2000]

  Refined Position:   [ source = BAT pre-slew burst ]
    RA: 100.860611094417   Dec: 50.2215415600482  [deg; J2000]
        { 06h 43m 26.5s , +50d 13' 17.5" }
         +/- 2.45933842266833 [arcmin] (estimated 90% radius based on SNR)
         +/- 1.36102978618278 [arcmin] (formal 1-sigma fit error)
    SNR: 8.41020399714158

  Angular difference between the analysis and refined position is 1.221223 arcmin

  Partial Coding Fraction: 0.75    [ including projection effects ]

  Duration
     T90: 129.531999945641 +/- 9.36527313930396
        Measured from: 44.1639999747276
                   to: 173.695999920368     [s; relative to TRIGTIME]
     T50: 20.9439999461174 +/- 3.04971336258371
        Measured from: 126.48400002718
                   to: 147.427999973297     [s; relative to TRIGTIME]


  Fluence
     Peak Flux  (peak 1 second)
        Measured from: 127.068000018597
                   to: 128.068000018597     [s; relative to TRIGTIME]
     Total Fluence
        Measured from: 29.5199999809265
                   to: 186.399999976158     [s; relative to TRIGTIME]

             Band 1     Band 2     Band 3     Band 4
              15-25      25-50     50-100    100-350     keV
 Total     2.095755   2.172650   1.172908   0.091631
           0.074999   0.078656   0.072205   0.071786 [error]
 Peak      0.066170   0.088008   0.053844   0.019479
           0.006503   0.007014   0.006140   0.005696 [error]

     [ fluence units of on-axis counts / fully illuminated detector ]

======================================================================


====== Table of the duration information =============================

        Value   tstart    tstop
T100  156.880   29.520  186.400
T90   129.532   44.164  173.696
T50    20.944  126.484  147.428
Peak    1.000  127.068  128.068


====== Spectral Analysis Summary =====================================

Model      : spectral model: simple power-law (PL) and cutoff power-law (CPL)
Ph_index   : photon index: E^{Ph_index}
Ph_90err   : 90% error of the photon index
Epeak      : Epeak in keV
Epeak_90err: 90% error of Epeak
Norm       : normalization at 50 keV in both the PL model and CPL model
Nomr_90err : 90% error of the normalization
chi2       : Chi-Squared
dof        : degree of freedo

=== Time-averaged spectral analysis ===
(Best model with acceptable fit: PL)

Model Ph_index Ph_90err_low Ph_90err_hi  Epeak  Epeak_90err_low  Epeak_90err_hi  Norm       Nomr_90err_low    Norm_90err_hi    chi2    dof
PL      -2.010    -0.096      0.094       -           -               -         2.08e-03     -1.16e-04          1.15e-04      47.390   57
CPL     -1.668    -0.344      0.397       42.358     -40.705       -42.358      3.21e-03     -1.33e-03          2.06e-03      44.740   56


=== 1-s peak spectral analysis ===
(Best model with acceptable fit: PL)

Model Ph_index Ph_90err_low Ph_90err_hi  Epeak  Epeak_90err_low  Epeak_90err_hi  Norm       Nomr_90err_low    Norm_90err_hi    chi2    dof
PL      -1.547     -0.172     0.169       -           -               -         1.39e-02     -1.36e-03          1.34e-03      57.510   57
CPL     -1.554     -0.164     0.179     9999.360    -9999.360      -9999.360      1.38e-02     -1.07e-02          -5.30e-03      57.530   56


=== Fluence/Peak Flux Summary ===

              Model    Band1     Band2     Band3     Band4     Band5     Total
                       15-25     25-50    50-100    100-350    15-150    15-350    keV
Fluence         PL   6.75e-07  9.10e-07  9.03e-07  1.62e-06  3.01e-06  4.10e-06   erg/cm2
      90%_error_low -4.99e-08 -4.17e-08 -7.06e-08 -2.48e-07 -1.57e-07 -3.17e-07   erg/cm2
      90%_error_hi   5.10e-08  4.17e-08  7.14e-08  2.79e-07  1.59e-07  3.40e-07   erg/cm2
Peak flux       PL   5.97e-01  5.84e-01  4.00e-01  4.30e-01  1.75e+00  2.01e+00   ph/cm2/s
      90%_error_low -9.04e-02 -5.47e-02 -5.16e-02 -1.04e-01 -1.59e-01 -1.88e-01   ph/cm2/s
      90%_error_hi   9.35e-02  5.44e-02  5.14e-02  1.25e-01  1.59e-01  1.90e-01   ph/cm2/s

Fluence        CPL   6.45e-07  9.39e-07  8.92e-07  8.95e-07  2.90e-06  3.37e-06   erg/cm2
      90%_error_low -5.84e-08 -5.17e-08 -7.71e-08 -3.93e-07 -1.95e-07 -4.53e-07   erg/cm2
      90%_error_hi   5.91e-08  5.25e-08  7.58e-08  7.66e-07  1.98e-07  7.95e-07   erg/cm2
Peak flux      CPL   5.96e-01  5.84e-01  4.00e-01  4.28e-01  1.75e+00  2.02e+00   ph/cm2/s
      90%_error_low -9.05e-02     N/A   -5.16e-02     N/A   -1.58e-01 -2.34e-01   ph/cm2/s
      90%_error_hi   9.36e-02     N/A    5.15e-02     N/A    1.59e-01  1.81e-01   ph/cm2/s

======================================================================
Image
Pre-slew 15.0-350.0 keV image (Event data)
#   RAcent    DECcent   POSerr    Theta     Phi              Peak Cts       SNR   Name
  100.8606    50.2215   0.0230    29.5329    12.1761         0.8022519      8.410 TRIG_00361830

Foreground time interval of the image:
 29.520  73.301 (delta_t =  43.781 [sec])
Background time interval of the image:
-136.299  29.520 (delta_t = 165.819 [sec])
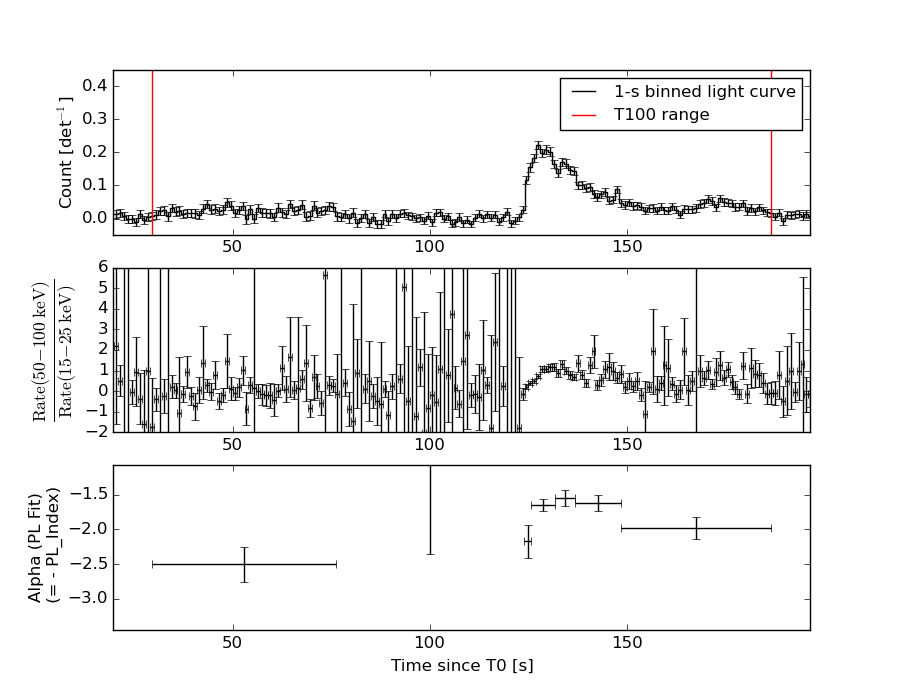
Light Curves
Note: The mask-weighted lightcurves have units of either count/det or counts/sec/det, where a det is 0.4 x 0.4 = 0.16 sq cm.
Full-time range; 1 s binning
Other quick-look light curves:
- 64 ms binning (zoomed)
- 16 ms binning (zoomed)
- 8 ms binning (zoomed)
- 2 ms binning (zoomed)
- SN=5 or 10 s binning (full-time range)
- Raw light curve
Spectra
- 64 ms binning (zoomed)
- 16 ms binning (zoomed)
- 8 ms binning (zoomed)
- 2 ms binning (zoomed)
- SN=5 or 10 s binning (full-time range)
- Raw light curve
Spectra
Notes:
- 1) The fitting includes the systematic errors.
- 2) When the burst includes telescope slew time periods, the fitting uses an average response file made from multiple 5-s response files through out the slew time plus single time preiod for the non-slew times, and weighted by the total counts in the corresponding time period using addrmf. An average response file is needed becuase a spectral fit using the pre-slew DRM will introduce some errors in both a spectral shape and a normalization if the PHA file contains a lot of the slew/post-slew time interval.
- 3) For fits to more complicated models (e.g. a power-law over a cutoff power-law), the BAT team has decided to require a chi-square improvement of more than 6 for each extra dof.
Time averaged spectrum fit using the average DRM
Power-law model
Time interval is from   29.520 sec. to  186.400 sec.

Spectral model in power-law:
------------------------------------------------------------
Parameters  : value       lower 90%   higher 90%
Photon index: -2.01042     ( -0.0960164   0.0941712 )
Norm@50keV  : 2.08111E-03    ( -0.000115836   0.00011467 )
------------------------------------------------------------
#Fit statistic : Chi-Squared =          47.39 using 59 PHA bins.
# Reduced chi-squared =         0.8314 for     57 degrees of freedom
# Null hypothesis probability =   8.140167e-01

Photon flux (15-150 keV)    in 156.9 sec: 0.313695 ( -0.014925  0.014958 ) ph/cm2/s
Energy fluence (15-150 keV)             : 3.01344e-06 ( -1.57405e-07  1.58927e-07 ) ergs/cm2
Cutoff power-law model
Time interval is from   29.520 sec. to  186.400 sec.
Spectral model in the cutoff power-law:
------------------------------------------------------------
Parameters  : value       lower 90%   higher 90%
Photon index: -1.66754     ( -0.343917   0.396791 )
Epeak [keV] : 42.3583      ( -40.7052 -42.3583 )
Norm@50keV  : 3.21175E-03    ( -0.00132995   0.00206077 )
------------------------------------------------------------
#Fit statistic : Chi-Squared =          44.74 using 59 PHA bins.
# Reduced chi-squared =         0.7990 for     56 degrees of freedom
# Null hypothesis probability =   8.600747e-01

Photon flux (15-150 keV)    in 156.9 sec: 0.306585 ( -0.016579  0.016603 ) ph/cm2/s
Energy fluence (15-150 keV)             : 2.89677e-06 ( -1.95279e-07  1.97823e-07 ) ergs/cm2
1-s peak spectrum fit
Power-law model
Time interval is from  127.068 sec. to  128.068 sec.

Spectral model in power-law:
------------------------------------------------------------
Parameters  : value       lower 90%   higher 90%
Photon index: -1.54677     ( -0.171591   0.16936 )
Norm@50keV  : 1.38580E-02    ( -0.00135999   0.00134153 )
------------------------------------------------------------
#Fit statistic : Chi-Squared =          57.51 using 59 PHA bins.
# Reduced chi-squared =          1.009 for     57 degrees of freedom
# Null hypothesis probability =   4.562199e-01

Photon flux (15-150 keV)    in 1 sec: 1.75276 ( -0.1588  0.15891 ) ph/cm2/s
Energy fluence (15-150 keV)             : 1.30539e-07 ( -1.4105e-08  1.43449e-08 ) ergs/cm2
Cutoff power-law model
Time interval is from  127.068 sec. to  128.068 sec.
Spectral model in the cutoff power-law:
------------------------------------------------------------
Parameters  : value       lower 90%   higher 90%
Photon index: -2.31661     ( -0.164446   0.178718 )
Epeak [keV] : 111.827      ( -9999.36 -9999.36 )
Norm@50keV  : 5.45729E-03    ( -0.00234753   0.00305843 )
------------------------------------------------------------
#Fit statistic : Chi-Squared =          57.37 using 59 PHA bins.
# Reduced chi-squared =          1.025 for     56 degrees of freedom
# Null hypothesis probability =   4.240301e-01

Photon flux (15-150 keV)    in 1 sec: 1.75261 ( -0.15789  0.15885 ) ph/cm2/s
Energy fluence (15-150 keV)             : 7.54397e-08 ( -1.53154e-08  1.29436e-08 ) ergs/cm2
Time-resolved spectra
Distribution
T90 vs. Hardness ratio plot
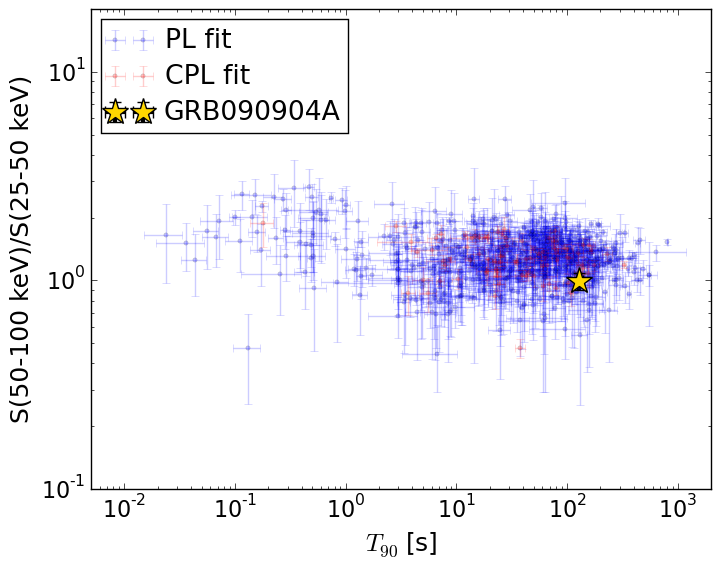
T90                                   = 129.532 sec.
Hardness ratio (energy fluence ratio) = 0.992841673742
S(15-50 keV) vs. S(50-150 keV) plot
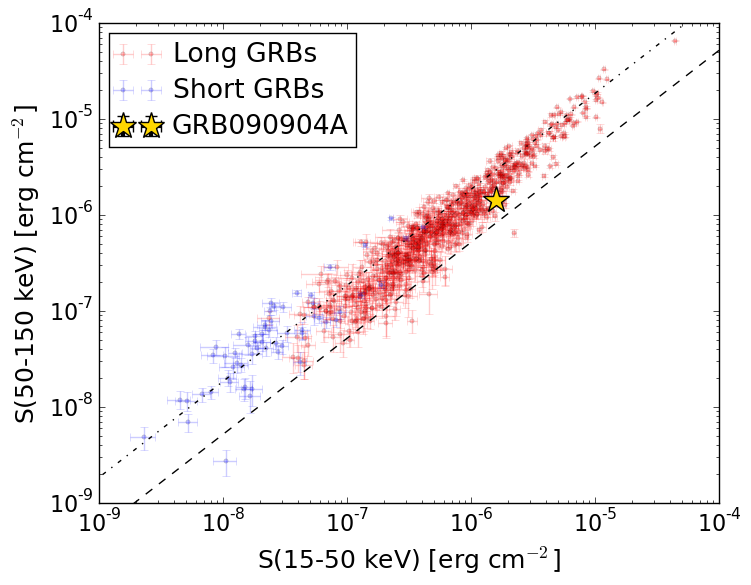
S(15-50 keV)  = 1.5847053e-06
S(50-150 keV) = 1.4287678e-06
The dash-dotted line and the dashed line traces the fluences calculated from the Band function with Epeak = 15 and 150 keV, respectively. Both lines assume a canonical values of alpha = -1 and beta = -2.5.
Mask shadow pattern
IMX = 5.537870990773772E-01, IMY = -1.194910957188284E-01
Spacecraft aspect plot
Bright source in the pre-burst/pre-slew/post-slew images
Pre-burst image of 15-350 keV band
Time interval of the image:
-136.299400 29.520000

# RAcent  DECcent POSerr Theta    Phi  PeakCts   SNR AngSep     Name
#  [deg]    [deg]    ['] [deg]  [deg]                   [']
 80.3366  30.3150    2.8  54.3   18.8   3.9463   4.1 ------	UNKNOWN
257.1442  43.3349    2.6  55.9  173.3   4.1745   4.5 ------	UNKNOWN
224.4950  68.1533    2.3  25.8  172.6   0.8282   5.0 ------	UNKNOWN
206.6799  32.4924    3.3  48.5 -135.3   2.2934   3.5 ------	UNKNOWN
208.6108  30.8783    3.3  50.6 -136.5   3.0840   3.5 ------	UNKNOWN
157.8533  27.8179    2.2  41.6  -75.0   3.4986   5.2 ------	UNKNOWN
134.5558  19.5083    2.8  50.4  -45.4   3.6560   4.1 ------	UNKNOWN
Pre-slew background subtracted image of 15-350 keV band
Time interval of the image:
29.520000 73.300580

# RAcent  DECcent POSerr Theta    Phi  PeakCts   SNR AngSep     Name
#  [deg]    [deg]    ['] [deg]  [deg]                   [']
266.9128  58.7308    1.9  44.6  157.5   1.1581   6.2 ------	UNKNOWN
100.8607  50.2216    1.4  29.5   12.2   0.8024   8.4 ------	UNKNOWN
Post-slew image of 15-350 keV band
Time interval of the image:
123.300600 963.040000

# RAcent  DECcent POSerr Theta    Phi  PeakCts   SNR AngSep     Name
#  [deg]    [deg]    ['] [deg]  [deg]                   [']
 83.6249  22.0208    0.2  31.3   14.8  33.7413  48.5    0.6	Crab
247.7737  76.1908    2.7  51.8  172.3   9.2842   4.2 ------	UNKNOWN
 86.9131  18.5287    2.6  33.6    7.2   3.2676   4.5 ------	UNKNOWN
220.0167  76.9054    2.4  47.3  178.4   5.4740   4.8 ------	UNKNOWN
100.8227  50.1844    1.2   0.0   64.6   5.4761   9.7 ------	UNKNOWN
 92.9654  14.4587    2.5  36.3   -4.2   3.8444   4.7 ------	UNKNOWN