Analysis Summary
Notes:
- 1) No attempt has been made to eliminate the non-significant decimal places.
- 2) This batgrbproduct analysis is done using the HEASARC data.
- 3) This batgrbproduct analysis is using the flight position for the mask-weighting calculation.
==========================================================================
BAT GROUND-DETECTED GRB DATA PROCESSING REPORT
Process Script Ver: batgrbproduct v2.46
Process Start Time: Sun May 10 03:04:20 EDT 2015
Host Name: bat1
Current Working Dir: /local/data/bat1/alien/Swift_3rdBATcatalog/event/ground_detect_bursts/scripts
======================================================================
Trigger: 00362785 Segment: 000
BAT Trigger Time: 274721739.2
UTC: 2009-09-15T15:35:34.112 [includes UTCF correction]
Where From?: Ground analysis (best_duration.txt)
NOTE: BAT trigger time for ground-detected burst is the T100 start time.
Analysis Position: [ source = GCN ]
RA: 237.991 Dec: 15.483 [deg; J2000]
Refined Position: [ source = BAT pre-slew image ]
RA: 237.991 Dec: 15.483 [deg; J2000]
{ 15h 51m 57.8s , +15d 28' 58.8" }
+/- 2.95711299957 [arcmin] (estimated 90% radius based on SNR)
SNR: 6.46408025625
Angular difference between the analysis and refined position is 0.000000 arcmin
Partial Coding Fraction: 0.08789062 [ including projection effects ]
Duration
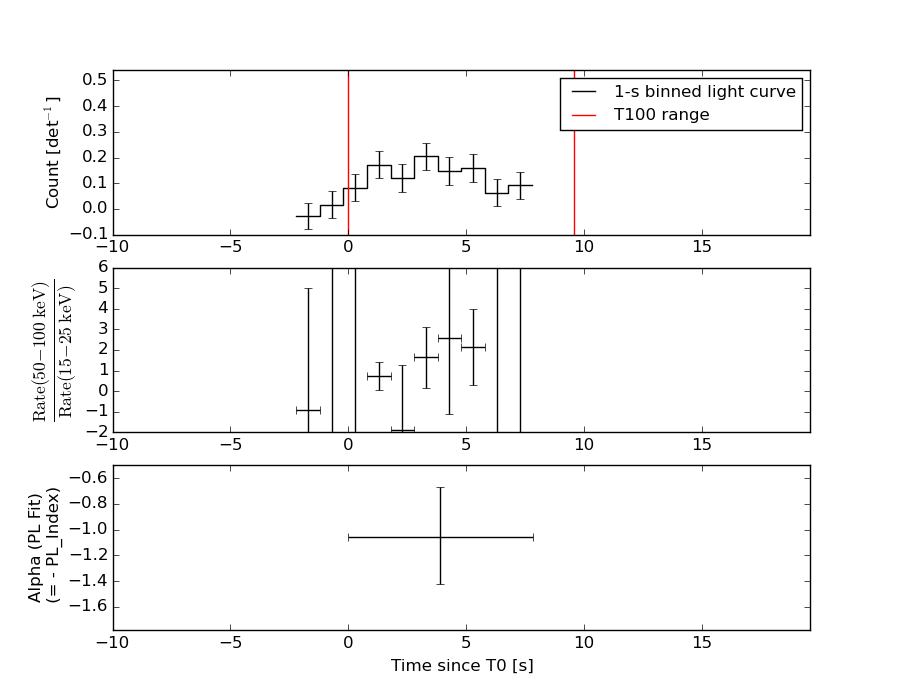
T90: 9.60000002384186 +/- 1.6
Measured from: 0
to: 9.6 [s; relative to TRIGTIME]
T50: 6.40000003576279 +/- 1.6
Measured from: 1.6
to: 8 [s; relative to TRIGTIME]
====== Table of the duration information =============================
Value tstart tstop
T100 9.600 0.000 9.600
T90 9.600 0.000 9.600
T50 6.400 1.600 8.000
Peak 1.000 3.500 4.500
====== Spectral Analysis Summary =====================================
Model : spectral model: simple power-law (PL) and cutoff power-law (CPL)
Ph_index : photon index: E^{Ph_index}
Ph_90err : 90% error of the photon index
Epeak : Epeak in keV
Epeak_90err: 90% error of Epeak
Norm : normalization at 50 keV in both the PL model and CPL model
Nomr_90err : 90% error of the normalization
chi2 : Chi-Squared
dof : degree of freedo
=== Time-averaged spectral analysis ===
(Best model with acceptable fit: PL)
Model Ph_index Ph_90err_low Ph_90err_hi Epeak Epeak_90err_low Epeak_90err_hi Norm Nomr_90err_low Norm_90err_hi chi2 dof
PL -1.059 -0.364 0.390 - - - 9.84e-03 -2.30e-03 2.27e-03 54.850 57
CPL 1.696 -2.361 5.630 80.704 -17.148 113.381 1.30e-01 -1.30e-01 1.23e+01 50.580 56
=== 1-s peak spectral analysis ===
(Best model with acceptable fit: N/A)
Model Ph_index Ph_90err_low Ph_90err_hi Epeak Epeak_90err_low Epeak_90err_hi Norm Nomr_90err_low Norm_90err_hi chi2 dof
PL -0.515 -0.904 0.515 - - - 9.89e-03 -7.20e-03 6.61e-03 66.910 57
CPL 0.769 -0.769 -0.769 148.455 -148.455 -148.455 2.81e-02 -2.81e-02 1.11e+02 66.520 56
=== Fluence/Peak Flux Summary ===
Model Band1 Band2 Band3 Band4 Band5 Total
15-25 25-50 50-100 100-350 15-150 15-350 keV
Fluence PL 6.51e-08 1.57e-07 3.02e-07 1.42e-06 8.16e-07 1.94e-06 erg/cm2
90%_error_low -2.76e-08 -4.54e-08 -6.95e-08 -6.04e-07 -1.83e-07 -6.52e-07 erg/cm2
90%_error_hi 3.35e-08 4.52e-08 6.89e-08 8.69e-07 1.84e-07 8.71e-07 erg/cm2
Peak flux PL 1.60e-01 2.91e-01 4.07e-01 1.19e+00 1.17e+00 2.05e+00 ph/cm2/s
90%_error_low -1.60e-01 -2.91e-01 -4.07e-01 -1.19e+00 -1.17e+00 -1.06e+00 ph/cm2/s
90%_error_hi 3.25e-01 2.87e-01 2.07e-01 3.78e+00 7.27e-01 3.09e+00 ph/cm2/s
Fluence CPL 2.75e-08 1.63e-07 3.74e-07 2.16e-07 7.27e-07 7.80e-07 erg/cm2
90%_error_low -2.47e-08 -6.46e-08 -9.47e-08 -1.70e-07 -2.01e-07 -2.51e-07 erg/cm2
90%_error_hi 4.20e-08 5.66e-08 1.01e-07 7.23e-07 2.05e-07 7.09e-07 erg/cm2
Peak flux CPL 7.40e-02 2.70e-01 4.98e-01 4.00e-01 1.10e+00 1.24e+00 ph/cm2/s
90%_error_low -7.40e-02 -2.70e-01 -2.87e-01 -4.00e-01 -6.29e-01 -7.73e-01 ph/cm2/s
90%_error_hi 3.76e-01 3.26e-01 3.28e-01 1.75e+00 7.41e-01 2.24e+00 ph/cm2/s
======================================================================
Image
15.0-350.0 keV image (Event data)
#RAcent DECcent POSerr Theta  Phi  Peak_Cts  SNR Name
237.991 15.483 0.000 54.520 -28.267 1.046 6.464 TRIG_00362785

Image time interval: 0.000 to 7.824 [sec]
Light Curves
Note: The mask-weighted lightcurves have units of either count/det or counts/sec/det, where a det is 0.4 x 0.4 = 0.16 sq cm.
Best duration plot
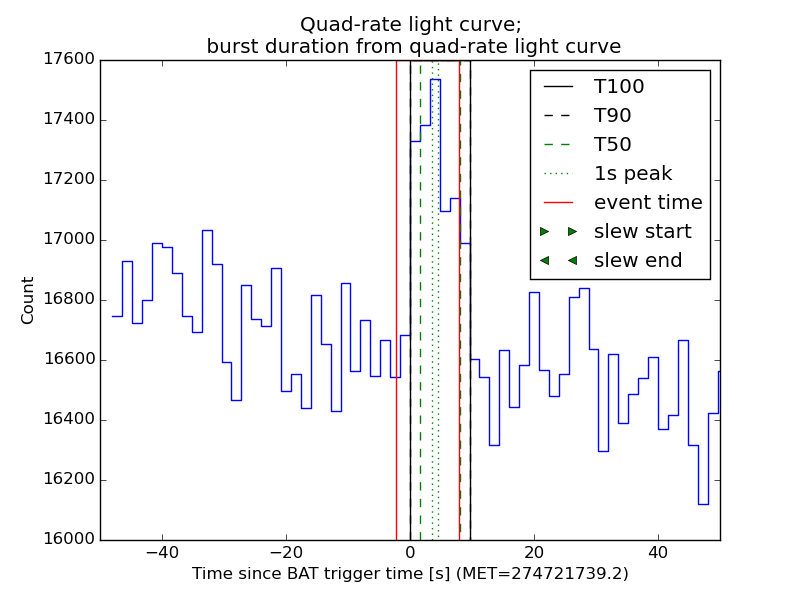
Full-time range; 1 s binning
Other quick-look light curves:
- 64 ms binning (zoomed)
- 16 ms binning (zoomed)
- 8 ms binning (zoomed)
- 2 ms binning (zoomed)
- SN=5 or 10 s binning (full-time range)
- Raw light curve
Spectra
- 64 ms binning (zoomed)
- 16 ms binning (zoomed)
- 8 ms binning (zoomed)
- 2 ms binning (zoomed)
- SN=5 or 10 s binning (full-time range)
- Raw light curve
Spectra
Notes:
- 1) The fitting includes the systematic errors.
- 2) When the burst includes telescope slew time periods, the fitting uses an average response file made from multiple 5-s response files through out the slew time plus single time preiod for the non-slew times, and weighted by the total counts in the corresponding time period using addrmf. An average response file is needed becuase a spectral fit using the pre-slew DRM will introduce some errors in both a spectral shape and a normalization if the PHA file contains a lot of the slew/post-slew time interval.
- 3) For fits to more complicated models (e.g. a power-law over a cutoff power-law), the BAT team has decided to require a chi-square improvement of more than 6 for each extra dof.
Time averaged spectrum fit using the average DRM
Power-law model
Time interval is from    0.000 sec. to    7.824 sec.

Spectral model in power-law:
------------------------------------------------------------
Parameters  : value       lower 90%   higher 90%
Photon index: -1.05874     ( -0.364644   0.390199 )
Norm@50keV  : 9.84124E-03    ( -0.00230339   0.00226739 )
------------------------------------------------------------
#Fit statistic : Chi-Squared =          54.85 using 59 PHA bins.
# Reduced chi-squared =         0.9624 for     57 degrees of freedom
# Null hypothesis probability =   5.559899e-01

Photon flux (15-150 keV)    in 7.824 sec: 1.13732 ( -0.272072  0.2789 ) ph/cm2/s
Energy fluence (15-150 keV)             : 8.16051e-07 ( -1.82999e-07  1.83647e-07 ) ergs/cm2
Cutoff power-law model
Time interval is from    0.000 sec. to    7.824 sec.
Spectral model in the cutoff power-law:
------------------------------------------------------------
Parameters  : value       lower 90%   higher 90%
Photon index: 1.6965     ( -2.36687   5.62386 )
Epeak [keV] : 80.7036      ( -17.0895 113.44 )
Norm@50keV  : 0.129578    ( -0.130637   12.3317 )
------------------------------------------------------------
#Fit statistic : Chi-Squared =          50.58 using 59 PHA bins.
# Reduced chi-squared =         0.9032 for     56 degrees of freedom
# Null hypothesis probability =   6.794616e-01

Photon flux (15-150 keV)    in 7.824 sec: 0.986664 ( -0.291102  0.302286 ) ph/cm2/s
Energy fluence (15-150 keV)             : 7.27309e-07 ( -2.01366e-07  2.05363e-07 ) ergs/cm2
1-s peak spectrum fit
Power-law model
Time interval is from    3.500 sec. to    4.500 sec.

Spectral model in power-law:
------------------------------------------------------------
Parameters  : value       lower 90%   higher 90%
Photon index: -0.515155     ( -0.90442   0.515155 )
Norm@50keV  : 9.88590E-03    ( -0.00720468   0.00661275 )
------------------------------------------------------------
#Fit statistic : Chi-Squared =          66.91 using 59 PHA bins.
# Reduced chi-squared =          1.174 for     57 degrees of freedom
# Null hypothesis probability =   1.734910e-01

Photon flux (15-150 keV)    in 1 sec: 1.16798 ( -1.16798  0.72732 ) ph/cm2/s
Energy fluence (15-150 keV)             : 1.31817e-07 ( -6.56121e-08  6.56343e-08 ) ergs/cm2
Cutoff power-law model
Time interval is from    3.500 sec. to    4.500 sec.
Spectral model in the cutoff power-law:
------------------------------------------------------------
Parameters  : value       lower 90%   higher 90%
Photon index: 0.768697     ( -0.811707   -0.811707 )
Epeak [keV] : 148.455      ( -143.165 -143.165 )
Norm@50keV  : 2.80525E-02    ( -0.031109   110.918 )
------------------------------------------------------------
#Fit statistic : Chi-Squared =          66.52 using 59 PHA bins.
# Reduced chi-squared =          1.188 for     56 degrees of freedom
# Null hypothesis probability =   1.585994e-01

Photon flux (15-150 keV)    in 1 sec: 1.09589 ( -0.6285  0.74064 ) ph/cm2/s
Energy fluence (15-150 keV)             : 1.26579e-07 ( -7.47587e-08  6.86346e-08 ) ergs/cm2
Time-resolved spectra
Distribution
T90 vs. Hardness ratio plot
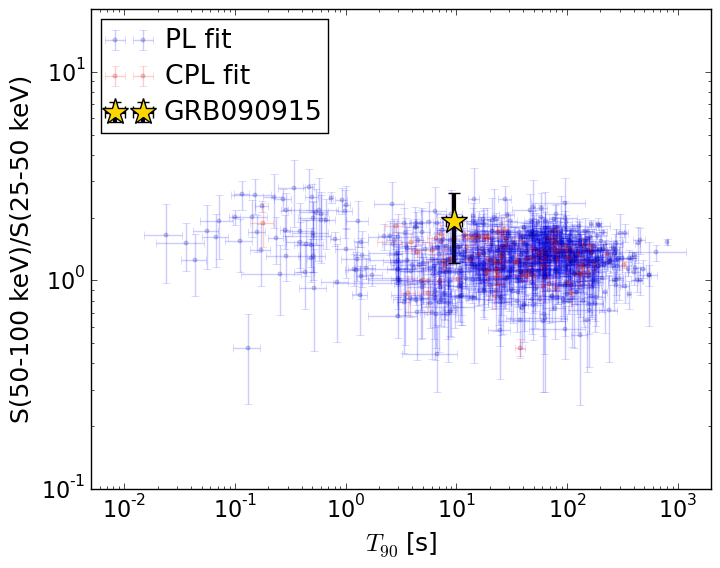
T90                                   = 9.6 sec.
Hardness ratio (energy fluence ratio) = 1.92048128925
S(15-50 keV) vs. S(50-150 keV) plot
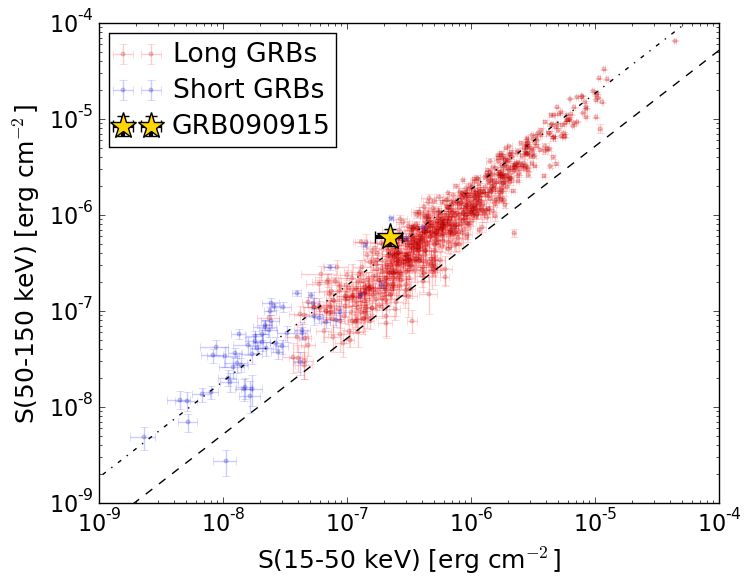
S(15-50 keV)  = 2.2212697e-07
S(50-150 keV) = 5.939297e-07
The dash-dotted line and the dashed line traces the fluences calculated from the Band function with Epeak = 15 and 150 keV, respectively. Both lines assume a canonical values of alpha = -1 and beta = -2.5.
Mask shadow pattern
IMX = 1.23569112544, IMY = 0.664425214753
Spacecraft aspect plot
Bright source in the event data image
Event data image of 15-350 keV band
Time interval of the image:
1.888000 7.823800

# RAcent  DECcent POSerr Theta    Phi  PeakCts   SNR AngSep     Name
#  [deg]    [deg]    ['] [deg]  [deg]                   [']
244.9701 -15.6278    1.5  25.8  -51.1   0.2957   7.7    0.9	Sco X-1
255.8780 -37.6995    6.6  11.9 -120.2  -0.0566  -1.7   10.1	4U 1700-377
256.5822 -36.4424    8.3  10.8 -116.0   0.0444   1.4    7.2	GX 349+2
262.9847 -24.5973   16.0   7.6  -27.1   0.0222   0.7    9.0	GX 1+4
264.9101 -44.5555    6.0  13.8 -163.8  -0.0588  -1.9    9.6	4U 1735-44
268.3495  -1.4661    5.6  29.5    8.9   0.0792   2.0    1.4	SW J1753.5-0127
270.4445 -25.0417    5.1   6.4   30.4   0.0705   2.3    9.0	GX 5-1
270.1264 -25.6966    7.5   5.6   30.1   0.0480   1.5    9.9	GRS 1758-258
274.1227 -13.8683    0.0  18.0   28.1   0.0469   1.5   12.2	GX 17+2
276.0595 -30.1904    0.0   7.2   93.9   0.0477   1.5   12.7	H1820-303
285.0935 -24.8525    3.3  16.5   80.3   0.1264   3.5    5.1	HT1900.1-2455
288.8903  10.9199    7.2  46.5   36.9   0.1748   1.6    5.6	GRS 1915+105
262.9842 -33.9852    5.1   5.0 -120.8   0.0659   2.2    9.0	GX 354-0
279.2708 -65.1665    2.6  35.0  179.3   0.1887   4.4 ------	UNKNOWN
234.0497 -54.5511    2.0  33.6 -136.8   0.2544   5.7 ------	UNKNOWN
238.4227 -30.2314    2.7  25.2  -88.3   0.1880   4.3 ------	UNKNOWN
237.9899  15.4815    1.9  54.5  -28.3   0.8805   6.2 ------	UNKNOWN
Webpage updated on:
Wed Nov 25 14:11:02 EST 2015