Analysis Summary
Notes:
- 1) No attempt has been made to eliminate the non-significant decimal places.
- 2) This batgrbproduct analysis is done using the HEASARC data.
- 3) This batgrbproduct analysis is using the flight position for the mask-weighting calculation.
======================================================================
                  BAT GRB EVENT DATA PROCESSING REPORT
    Process Script Ver: batgrbproduct v2.46
    Process Start Time: Sun Jan 19 13:58:27 EST 2014
             Host Name: batevent1
   Current Working Dir: /local/data/batevent/batevent_reproc/trigger370791
======================================================================

  Trigger: 00370791      Segment: 000

  BAT Trigger Time: 275694953.536   [s; MET]
      Trigger Stop: 275694954.56   [s; MET]
               UTC: 2009-09-26T21:55:48.416220    [includes UTCF correction]
       Where From?: TDRSS position message

  BAT
    RA: 46.3178528437853   Dec: -39.0113731127945  [deg; J2000]

     Catalogged Source?: NO
     Point Source?:      YES
     GRB Indicated?:     YES    [ by BAT flight software ]
     Image S/N Ratio:    6.74
     Image Trigger?:     NO
     Rate S/N Ratio:     14.6969384566991  [ if not an image trigger ]
     Image S/N Ratio:    6.74

  Analysis Position:   [ source = BAT ]
    RA: 46.3178528437853   Dec: -39.0113731127945  [deg; J2000]

  Refined Position:   [ source = BAT pre-slew burst ]
    RA: 46.3124822664893   Dec: -38.9970842177631  [deg; J2000]
        { 03h 05m 15.0s , -38d 59' 49.5" }
         +/- 0.838705255882944 [arcmin] (estimated 90% radius based on SNR)
         +/- 0.251014504303666 [arcmin] (formal 1-sigma fit error)
    SNR: 39.1064018893157

  Angular difference between the analysis and refined position is 0.893155 arcmin

  Partial Coding Fraction: 0.265625    [ including projection effects ]

  Duration
     T90: 99.2839999198914 +/- 11.2994351566689
        Measured from: -16.9359999895096
                   to: 82.3479999303818     [s; relative to TRIGTIME]
     T50: 29.1279999613762 +/- 2.44140943779479
        Measured from: -3.20800000429153
                   to: 25.9199999570847     [s; relative to TRIGTIME]


  Fluence
     Peak Flux  (peak 1 second)
        Measured from: -1.31200003623962
                   to: -0.312000036239624     [s; relative to TRIGTIME]
     Total Fluence
        Measured from: -21.6119999885559
                   to: 130.339999973774     [s; relative to TRIGTIME]

             Band 1     Band 2     Band 3     Band 4
              15-25      25-50     50-100    100-350     keV
 Total     2.463953   4.469433   3.494782   0.610908
           0.088319   0.096341   0.085921   0.069487 [error]
 Peak      0.069238   0.145905   0.123211   0.044687
           0.011114   0.013348   0.012193   0.009195 [error]

     [ fluence units of on-axis counts / fully illuminated detector ]

======================================================================


====== Table of the duration information =============================

        Value   tstart    tstop
T100  151.952  -21.612  130.340
T90    99.284  -16.936   82.348
T50    29.128   -3.208   25.920
Peak    1.000   -1.312   -0.312


====== Spectral Analysis Summary =====================================

Model      : spectral model: simple power-law (PL) and cutoff power-law (CPL)
Ph_index   : photon index: E^{Ph_index}
Ph_90err   : 90% error of the photon index
Epeak      : Epeak in keV
Epeak_90err: 90% error of Epeak
Norm       : normalization at 50 keV in both the PL model and CPL model
Nomr_90err : 90% error of the normalization
chi2       : Chi-Squared
dof        : degree of freedo

=== Time-averaged spectral analysis ===
(Best model with acceptable fit: CPL)

Model Ph_index Ph_90err_low Ph_90err_hi  Epeak  Epeak_90err_low  Epeak_90err_hi  Norm       Nomr_90err_low    Norm_90err_hi    chi2    dof
PL      -1.505     N/A       N/A          -           -               -         5.23e-03        N/A               N/A        121.110   57
CPL     -0.516    -0.228      0.239       80.545      -6.341         9.009      1.52e-02     -3.22e-03          4.34e-03      56.770   56


=== 1-s peak spectral analysis ===
(Best model with acceptable fit: PL)

Model Ph_index Ph_90err_low Ph_90err_hi  Epeak  Epeak_90err_low  Epeak_90err_hi  Norm       Nomr_90err_low    Norm_90err_hi    chi2    dof
PL      -1.216     -0.166     0.169       -           -               -         2.68e-02     -2.67e-03          2.67e-03      45.660   57
CPL     -0.886     -0.414     0.716      190.291    -190.291      -190.291      3.81e-02     -1.33e-02          4.05e-02      44.870   56


=== Fluence/Peak Flux Summary ===

              Model    Band1     Band2     Band3     Band4     Band5     Total
                       15-25     25-50    50-100    100-350    15-150    15-350    keV
Fluence         PL   1.02e-06  1.87e-06  2.63e-06  7.79e-06  7.54e-06  1.33e-05   erg/cm2
      90%_error_low    N/A       N/A       N/A       N/A       N/A       N/A      erg/cm2
      90%_error_hi     N/A       N/A       N/A       N/A       N/A       N/A      erg/cm2
Peak flux       PL   8.42e-01  1.00e+00  8.64e-01  1.27e+00  3.16e+00  3.98e+00   ph/cm2/s
      90%_error_low -1.57e-01 -1.20e-01 -9.62e-02 -2.72e-01 -3.28e-01 -4.05e-01   ph/cm2/s
      90%_error_hi   1.67e-01  1.19e-01  9.52e-02  3.14e-01  3.29e-01  4.09e-01   ph/cm2/s

Fluence        CPL   8.17e-07  2.00e-06  2.84e-06  2.67e-06  7.12e-06  8.32e-06   erg/cm2
      90%_error_low -6.41e-08 -6.77e-08 -1.03e-07 -4.91e-07 -2.38e-07 -5.34e-07   erg/cm2
      90%_error_hi   6.54e-08  6.81e-08  1.04e-07  6.22e-07  2.38e-07  6.45e-07   erg/cm2
Peak flux      CPL   7.78e-01  1.03e+00  9.01e-01  9.20e-01  3.12e+00  3.63e+00   ph/cm2/s
      90%_error_low -1.95e-01 -1.30e-01 -1.18e-01 -4.09e-01 -3.35e-01 -5.48e-01   ph/cm2/s
      90%_error_hi   2.00e-01  1.33e-01  1.22e-01  4.50e-01  3.35e-01  5.93e-01   ph/cm2/s

======================================================================
Image
Pre-slew 15.0-350.0 keV image (Event data)
#   RAcent    DECcent   POSerr    Theta     Phi              Peak Cts       SNR   Name
   46.3125   -38.9971   0.0049    40.0827   144.2779         6.6672451     39.106 TRIG_00370791

Foreground time interval of the image:
-21.612  10.365 (delta_t =  31.977 [sec])
Background time interval of the image:
-542.035 -442.376 (delta_t =  99.659 [sec])
-239.536 -21.612 (delta_t = 217.924 [sec])
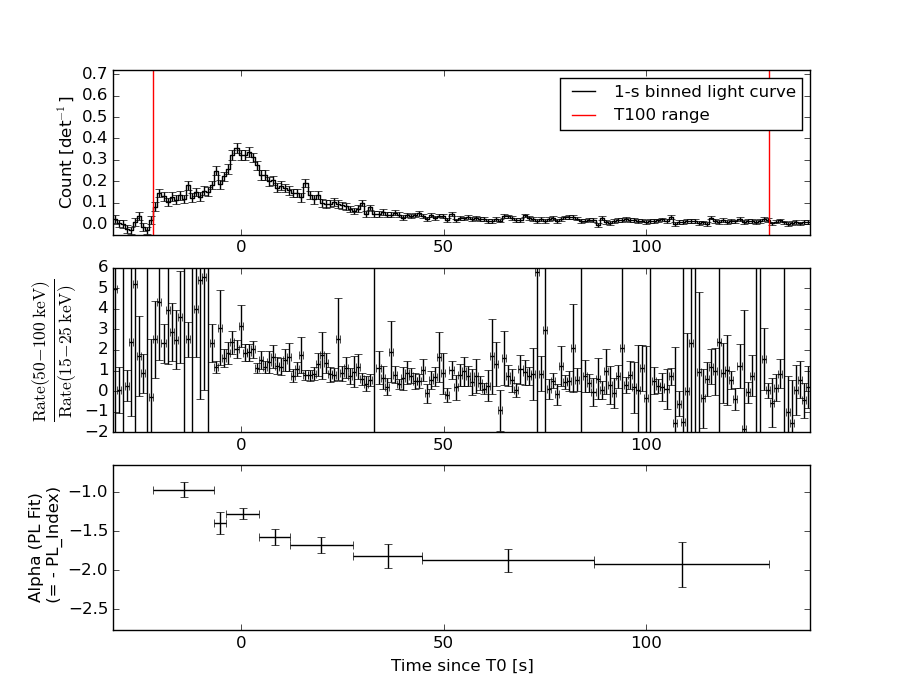
Light Curves
Note: The mask-weighted lightcurves have units of either count/det or counts/sec/det, where a det is 0.4 x 0.4 = 0.16 sq cm.
Full-time range; 1 s binning
Other quick-look light curves:
- 64 ms binning (zoomed)
- 16 ms binning (zoomed)
- 8 ms binning (zoomed)
- 2 ms binning (zoomed)
- SN=5 or 10 s binning (full-time range)
- Raw light curve
Spectra
- 64 ms binning (zoomed)
- 16 ms binning (zoomed)
- 8 ms binning (zoomed)
- 2 ms binning (zoomed)
- SN=5 or 10 s binning (full-time range)
- Raw light curve
Spectra
Notes:
- 1) The fitting includes the systematic errors.
- 2) When the burst includes telescope slew time periods, the fitting uses an average response file made from multiple 5-s response files through out the slew time plus single time preiod for the non-slew times, and weighted by the total counts in the corresponding time period using addrmf. An average response file is needed becuase a spectral fit using the pre-slew DRM will introduce some errors in both a spectral shape and a normalization if the PHA file contains a lot of the slew/post-slew time interval.
- 3) For fits to more complicated models (e.g. a power-law over a cutoff power-law), the BAT team has decided to require a chi-square improvement of more than 6 for each extra dof.
Time averaged spectrum fit using the average DRM
Power-law model
Time interval is from  -21.612 sec. to  130.340 sec.

Spectral model in power-law:
------------------------------------------------------------
Parameters  : value       lower 90%   higher 90%
Photon index: -1.5052     (       )
Norm@50keV  : 5.23010E-03    (     )
------------------------------------------------------------
#Fit statistic : Chi-Squared =         121.11 using 59 PHA bins.
# Reduced chi-squared =         2.1248 for     57 degrees of freedom
# Null hypothesis probability =   1.601540e-06

Photon flux (15-150 keV)    in 152 sec: 0.653855 (    ) ph/cm2/s
Energy fluence (15-150 keV)             : 7.53622e-06 ( 0  0 ) ergs/cm2
Cutoff power-law model
Time interval is from  -21.612 sec. to  130.340 sec.
Spectral model in the cutoff power-law:
------------------------------------------------------------
Parameters  : value       lower 90%   higher 90%
Photon index: -0.516398     ( -0.227511   0.239312 )
Epeak [keV] : 80.5453      ( -6.34117 9.00894 )
Norm@50keV  : 1.51859E-02    ( -0.00322385   0.00433624 )
------------------------------------------------------------
#Fit statistic : Chi-Squared =          56.77 using 59 PHA bins.
# Reduced chi-squared =          1.014 for     56 degrees of freedom
# Null hypothesis probability =   4.461669e-01

Photon flux (15-150 keV)    in 152 sec: 0.617314 ( -0.020761  0.020831 ) ph/cm2/s
Energy fluence (15-150 keV)             : 7.12334e-06 ( -2.37556e-07  2.37772e-07 ) ergs/cm2
1-s peak spectrum fit
Power-law model
Time interval is from   -1.312 sec. to   -0.312 sec.

Spectral model in power-law:
------------------------------------------------------------
Parameters  : value       lower 90%   higher 90%
Photon index: -1.21632     ( -0.166149   0.168588 )
Norm@50keV  : 2.68341E-02    ( -0.00266885   0.00266625 )
------------------------------------------------------------
#Fit statistic : Chi-Squared =          45.66 using 59 PHA bins.
# Reduced chi-squared =         0.8010 for     57 degrees of freedom
# Null hypothesis probability =   8.596015e-01

Photon flux (15-150 keV)    in 1 sec: 3.15721 ( -0.32795  0.32872 ) ph/cm2/s
Energy fluence (15-150 keV)             : 2.71038e-07 ( -2.88459e-08  2.89335e-08 ) ergs/cm2
Cutoff power-law model
Time interval is from   -1.312 sec. to   -0.312 sec.
Spectral model in the cutoff power-law:
------------------------------------------------------------
Parameters  : value       lower 90%   higher 90%
Photon index: -0.886271     ( -0.413867   0.715845 )
Epeak [keV] : 190.291      ( -190.291 -190.291 )
Norm@50keV  : 3.80579E-02    ( -0.0133008   0.0405112 )
------------------------------------------------------------
#Fit statistic : Chi-Squared =          44.87 using 59 PHA bins.
# Reduced chi-squared =         0.8013 for     56 degrees of freedom
# Null hypothesis probability =   8.568479e-01

Photon flux (15-150 keV)    in 1 sec: 3.12230 ( -0.33512  0.3354 ) ph/cm2/s
Energy fluence (15-150 keV)             : 2.67942e-07 ( -2.98965e-08  2.96971e-08 ) ergs/cm2
Time-resolved spectra
Distribution
T90 vs. Hardness ratio plot
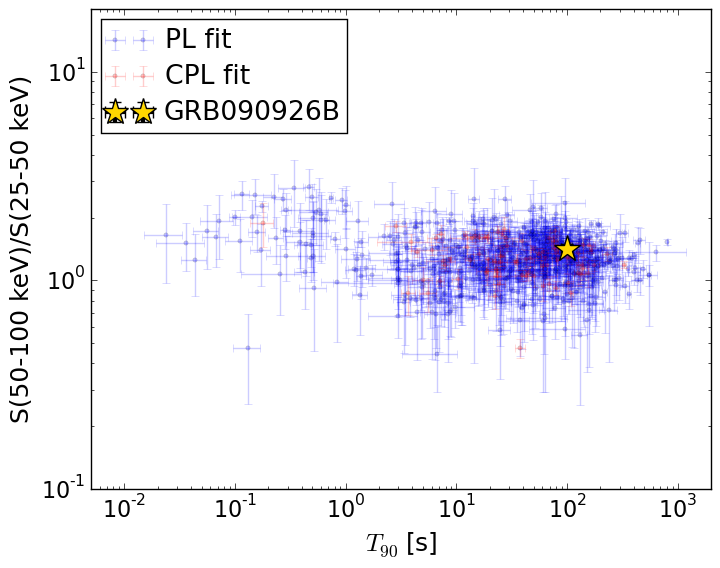
T90                                   = 99.284 sec.
Hardness ratio (energy fluence ratio) = 1.42095386278
S(15-50 keV) vs. S(50-150 keV) plot
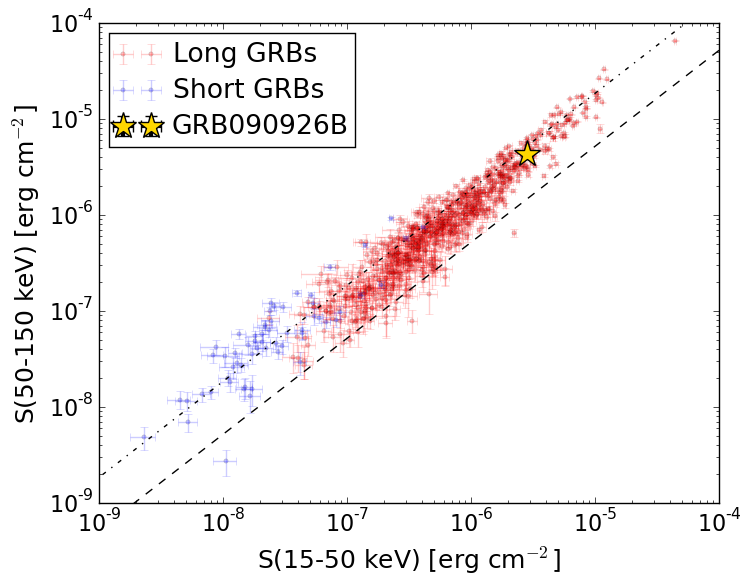
S(15-50 keV)  = 2.8161052e-06
S(50-150 keV) = 4.307344e-06
The dash-dotted line and the dashed line traces the fluences calculated from the Band function with Epeak = 15 and 150 keV, respectively. Both lines assume a canonical values of alpha = -1 and beta = -2.5.
Mask shadow pattern
IMX = -6.832285345832823E-01, IMY = -4.913492988858728E-01
Spacecraft aspect plot
Bright source in the pre-burst/pre-slew/post-slew images
Pre-burst image of 15-350 keV band
Time interval of the image:
-542.035390 -442.376000
-239.536000 -21.612000

# RAcent  DECcent POSerr Theta    Phi  PeakCts   SNR AngSep     Name
#  [deg]    [deg]    ['] [deg]  [deg]                   [']
264.9804 -44.3459   15.7  49.7  -40.0   0.7022   0.7   11.9	4U 1735-44
275.9520 -30.3359   10.1  57.5  -22.0   1.1134   1.1    2.3	H1820-303
285.0407 -24.9186   19.1  58.7  -10.6   0.7004   0.6    0.3	HT1900.1-2455
  0.7613 -27.7115    2.4  38.9   80.5   3.3344   4.8 ------	UNKNOWN
 60.5203 -41.6207    2.5  43.5  160.2   1.8562   4.6 ------	UNKNOWN
 91.3591 -38.4132    3.1  58.3 -175.6   4.3664   3.7 ------	UNKNOWN
248.6708 -57.4370    3.4  44.2  -61.5   3.6102   3.4 ------	UNKNOWN
Pre-slew background subtracted image of 15-350 keV band
Time interval of the image:
-21.612000 10.364600

# RAcent  DECcent POSerr Theta    Phi  PeakCts   SNR AngSep     Name
#  [deg]    [deg]    ['] [deg]  [deg]                   [']
264.7122 -44.3817   37.4  49.7  -40.2   0.0757   0.3    4.3	4U 1735-44
275.9877 -30.3570    3.0  57.5  -21.9   1.0239   3.9    3.3	H1820-303
285.1411 -25.0432    0.0  58.6  -10.6  -0.3663  -1.1    9.3	HT1900.1-2455
 46.3125 -38.9971    0.3  40.1  144.3   6.6672  39.1 ------	UNKNOWN
 63.4244 -42.4480    2.1  44.0  163.5   0.7993   5.5 ------	UNKNOWN
Post-slew image of 15-350 keV band
Time interval of the image:
77.164600 962.575700

# RAcent  DECcent POSerr Theta    Phi  PeakCts   SNR AngSep     Name
#  [deg]    [deg]    ['] [deg]  [deg]                   [']
 24.0827 -44.0175    2.8  17.3   30.8   1.4511   4.1 ------	UNKNOWN
 65.8489   4.5738    2.7  47.2  171.7   3.7543   4.2 ------	UNKNOWN
346.0628 -65.4431    2.7  42.9   -3.3   3.1123   4.3 ------	UNKNOWN