Analysis Summary
Notes:
- 1) No attempt has been made to eliminate the non-significant decimal places.
- 2) This batgrbproduct analysis is done using the HEASARC data.
- 3) This batgrbproduct analysis is using the flight position for the mask-weighting calculation.
======================================================================
BAT GRB EVENT DATA PROCESSING REPORT
Process Script Ver: batgrbproduct v2.46
Process Start Time: Sun Jan 19 13:26:35 EST 2014
Host Name: batevent1
Current Working Dir: /local/data/batevent/batevent_reproc/trigger373674
======================================================================
Trigger: 00373674 Segment: 000
BAT Trigger Time: 278067366.464 [s; MET]
Trigger Stop: 278067367.488 [s; MET]
UTC: 2009-10-24T08:56:01.265340 [includes UTCF correction]
Where From?: TDRSS position message
BAT
RA: 339.206654153892 Dec: 56.8745686910293 [deg; J2000]
Catalogged Source?: NO
Point Source?: YES
GRB Indicated?: YES [ by BAT flight software ]
Image S/N Ratio: 9.06
Image Trigger?: NO
Rate S/N Ratio: 19.3907194296653 [ if not an image trigger ]
Image S/N Ratio: 9.06
Analysis Position: [ source = BAT ]
RA: 339.206654153892 Dec: 56.8745686910293 [deg; J2000]
Refined Position: [ source = BAT pre-slew burst ]
RA: 339.238898339272 Dec: 56.8853563019734 [deg; J2000]
{ 22h 36m 57.3s , +56d 53' 07.3" }
+/- 0.964013417042147 [arcmin] (estimated 90% radius based on SNR)
+/- 0.302222774092929 [arcmin] (formal 1-sigma fit error)
SNR: 32.0521258577268
Angular difference between the analysis and refined position is 1.239503 arcmin
Partial Coding Fraction: 0.390625 [ including projection effects ]
Duration
T90: 112.27999997139 +/- 13.7684445322825
Measured from: -5.69999998807907
to: 106.579999983311 [s; relative to TRIGTIME]
T50: 48.5239999294281 +/- 4.76534155566373
Measured from: 3.15200001001358
to: 51.6759999394417 [s; relative to TRIGTIME]
Fluence
Peak Flux (peak 1 second)
Measured from: 0.75600004196167
to: 1.75600004196167 [s; relative to TRIGTIME]
Total Fluence
Measured from: -15.2039999961853
to: 134.98400002718 [s; relative to TRIGTIME]
Band 1 Band 2 Band 3 Band 4
15-25 25-50 50-100 100-350 keV
Total 1.644294 2.808311 2.731903 1.120494
0.112252 0.118203 0.107217 0.095590 [error]
Peak 0.054027 0.067451 0.099847 0.052562
0.009811 0.010683 0.010445 0.009120 [error]
[ fluence units of on-axis counts / fully illuminated detector ]
======================================================================
====== Table of the duration information =============================
Value tstart tstop
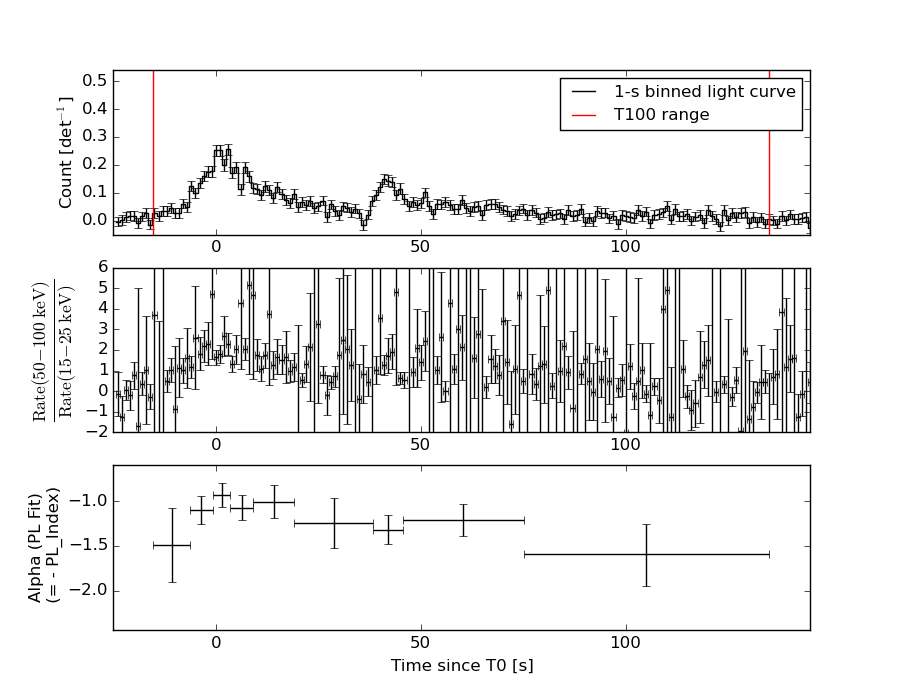
T100 150.188 -15.204 134.984
T90 112.280 -5.700 106.580
T50 48.524 3.152 51.676
Peak 1.000 0.756 1.756
====== Spectral Analysis Summary =====================================
Model : spectral model: simple power-law (PL) and cutoff power-law (CPL)
Ph_index : photon index: E^{Ph_index}
Ph_90err : 90% error of the photon index
Epeak : Epeak in keV
Epeak_90err: 90% error of Epeak
Norm : normalization at 50 keV in both the PL model and CPL model
Nomr_90err : 90% error of the normalization
chi2 : Chi-Squared
dof : degree of freedo
=== Time-averaged spectral analysis ===
(Best model with acceptable fit: PL)
Model Ph_index Ph_90err_low Ph_90err_hi Epeak Epeak_90err_low Epeak_90err_hi Norm Nomr_90err_low Norm_90err_hi chi2 dof
PL -1.206 -0.079 0.080 - - - 3.93e-03 -1.71e-04 1.71e-04 45.580 57
CPL -1.156 -0.130 0.135 999.039 -999.039 -999.039 4.13e-03 -3.51e-04 3.94e-04 46.440 56
=== 1-s peak spectral analysis ===
(Best model with acceptable fit: PL)
Model Ph_index Ph_90err_low Ph_90err_hi Epeak Epeak_90err_low Epeak_90err_hi Norm Nomr_90err_low Norm_90err_hi chi2 dof
PL -1.113 -0.229 0.234 - - - 1.77e-02 -2.28e-03 2.27e-03 61.520 57
CPL -0.973 -0.351 0.963 438.378 -438.378 -438.378 2.02e-02 -2.02e-02 -1.57e-02 61.480 56
=== Fluence/Peak Flux Summary ===
Model Band1 Band2 Band3 Band4 Band5 Total
15-25 25-50 50-100 100-350 15-150 15-350 keV
Fluence PL 5.73e-07 1.26e-06 2.19e-06 8.80e-06 5.98e-06 1.28e-05 erg/cm2
90%_error_low -5.30e-08 -6.96e-08 -1.02e-07 -9.39e-07 -2.62e-07 -9.81e-07 erg/cm2
90%_error_hi 5.49e-08 6.91e-08 1.02e-07 1.02e-06 2.63e-07 1.05e-06 erg/cm2
Peak flux PL 5.04e-01 6.39e-01 5.91e-01 9.57e-01 2.06e+00 2.69e+00 ph/cm2/s
90%_error_low -1.30e-01 -1.05e-01 -8.22e-02 -2.64e-01 -2.76e-01 -3.54e-01 ph/cm2/s
90%_error_hi 1.44e-01 1.03e-01 8.10e-02 3.21e-01 2.78e-01 3.61e-01 ph/cm2/s
Fluence CPL 5.72e-07 1.26e-06 2.17e-06 9.30e-06 6.00e-06 1.23e-05 erg/cm2
90%_error_low N/A -6.60e-08 N/A -2.08e-06 -2.81e-07 -1.29e-06 erg/cm2
90%_error_hi N/A 7.27e-08 N/A -1.43e-07 2.44e-07 2.12e-06 erg/cm2
Peak flux CPL 4.87e-01 6.41e-01 6.00e-01 8.65e-01 2.05e+00 2.59e+00 ph/cm2/s
90%_error_low -1.79e-01 -5.39e-02 -8.90e-02 -4.47e-01 -2.91e-01 -5.80e-01 ph/cm2/s
90%_error_hi 1.14e-01 1.07e-01 1.07e-01 2.78e-01 2.85e-01 4.29e-01 ph/cm2/s
======================================================================
Image
Pre-slew 15.0-350.0 keV image (Event data)
#   RAcent    DECcent   POSerr    Theta     Phi              Peak Cts       SNR   Name
  339.2389    56.8854   0.0060    44.4231   179.6627         9.2327542     32.052 TRIG_00373674

Foreground time interval of the image:
-15.204 134.984 (delta_t = 150.188 [sec])
Background time interval of the image:
-237.363 -15.204 (delta_t = 222.159 [sec])
Light Curves
Note: The mask-weighted lightcurves have units of either count/det or counts/sec/det, where a det is 0.4 x 0.4 = 0.16 sq cm.
Full-time range; 1 s binning
Other quick-look light curves:
- 64 ms binning (zoomed)
- 16 ms binning (zoomed)
- 8 ms binning (zoomed)
- 2 ms binning (zoomed)
- SN=5 or 10 s binning (full-time range)
- Raw light curve
Spectra
- 64 ms binning (zoomed)
- 16 ms binning (zoomed)
- 8 ms binning (zoomed)
- 2 ms binning (zoomed)
- SN=5 or 10 s binning (full-time range)
- Raw light curve
Spectra
Notes:
- 1) The fitting includes the systematic errors.
- 2) When the burst includes telescope slew time periods, the fitting uses an average response file made from multiple 5-s response files through out the slew time plus single time preiod for the non-slew times, and weighted by the total counts in the corresponding time period using addrmf. An average response file is needed becuase a spectral fit using the pre-slew DRM will introduce some errors in both a spectral shape and a normalization if the PHA file contains a lot of the slew/post-slew time interval.
- 3) For fits to more complicated models (e.g. a power-law over a cutoff power-law), the BAT team has decided to require a chi-square improvement of more than 6 for each extra dof.
Time averaged spectrum fit using the average DRM
Power-law model
Time interval is from  -15.204 sec. to  134.984 sec.

Spectral model in power-law:
------------------------------------------------------------
Parameters  : value       lower 90%   higher 90%
Photon index: -1.20592     ( -0.0790486   0.0800151 )
Norm@50keV  : 3.93259E-03    ( -0.00017143   0.000170644 )
------------------------------------------------------------
#Fit statistic : Chi-Squared =          45.58 using 59 PHA bins.
# Reduced chi-squared =         0.7997 for     57 degrees of freedom
# Null hypothesis probability =   8.614815e-01

Photon flux (15-150 keV)    in 150.2 sec: 0.461996 ( -0.021877  0.021956 ) ph/cm2/s
Energy fluence (15-150 keV)             : 5.98329e-06 ( -2.6245e-07  2.62823e-07 ) ergs/cm2
Cutoff power-law model
Time interval is from  -15.204 sec. to  134.984 sec.
Spectral model in the cutoff power-law:
------------------------------------------------------------
Parameters  : value       lower 90%   higher 90%
Photon index: -1.20131     ( -0.129647   0.135364 )
Epeak [keV] : 9999.13      ( -9999.14 -9999.14 )
Norm@50keV  : 3.95113E-03    ( -0.000169041   0.00057633 )
------------------------------------------------------------
#Fit statistic : Chi-Squared =          45.66 using 59 PHA bins.
# Reduced chi-squared =         0.8153 for     56 degrees of freedom
# Null hypothesis probability =   8.367020e-01

Photon flux (15-150 keV)    in 150.2 sec: 0.461874 ( -0.021874  0.02196 ) ph/cm2/s
Energy fluence (15-150 keV)             : 6.00026e-06 ( -2.80872e-07  2.44125e-07 ) ergs/cm2
1-s peak spectrum fit
Power-law model
Time interval is from    0.756 sec. to    1.756 sec.

Spectral model in power-law:
------------------------------------------------------------
Parameters  : value       lower 90%   higher 90%
Photon index: -1.11344     ( -0.228855   0.233506 )
Norm@50keV  : 1.77232E-02    ( -0.00227774   0.00226682 )
------------------------------------------------------------
#Fit statistic : Chi-Squared =          61.52 using 59 PHA bins.
# Reduced chi-squared =          1.079 for     57 degrees of freedom
# Null hypothesis probability =   3.175392e-01

Photon flux (15-150 keV)    in 1 sec: 2.05853 ( -0.27572  0.27756 ) ph/cm2/s
Energy fluence (15-150 keV)             : 1.84531e-07 ( -2.49468e-08  2.50394e-08 ) ergs/cm2
Cutoff power-law model
Time interval is from    0.756 sec. to    1.756 sec.
Spectral model in the cutoff power-law:
------------------------------------------------------------
Parameters  : value       lower 90%   higher 90%
Photon index: -2.78182     ( -0.337931   0.976825 )
Epeak [keV] : 231.437      ( -541.506 -541.506 )
Norm@50keV  : 1.39790E-03    ( -0.00140045   0.00314368 )
------------------------------------------------------------
#Fit statistic : Chi-Squared =          58.65 using 59 PHA bins.
# Reduced chi-squared =          1.047 for     56 degrees of freedom
# Null hypothesis probability =   3.785306e-01

Photon flux (15-150 keV)    in 1 sec: 2.04646 ( -0.29113  0.28517 ) ph/cm2/s
Energy fluence (15-150 keV)             : 1.84043e-07 ( -2.53528e-08  2.52863e-08 ) ergs/cm2
Time-resolved spectra
Distribution
T90 vs. Hardness ratio plot
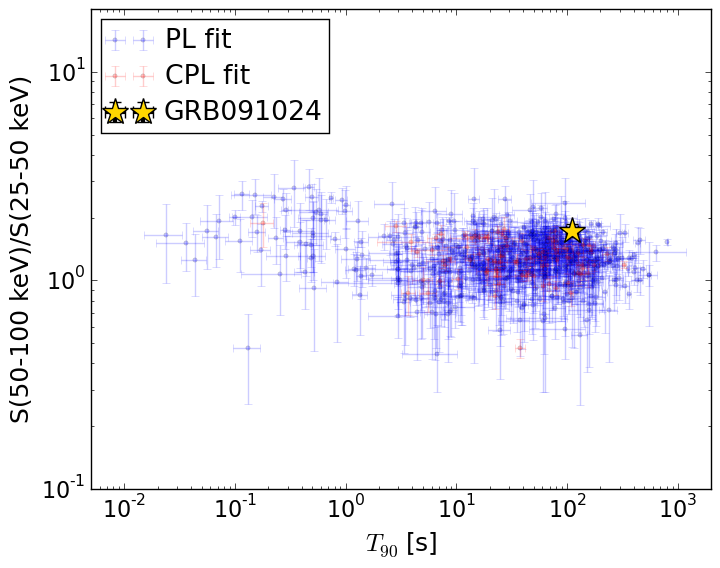
T90                                   = 112.28 sec.
Hardness ratio (energy fluence ratio) = 1.73400419773
S(15-50 keV) vs. S(50-150 keV) plot
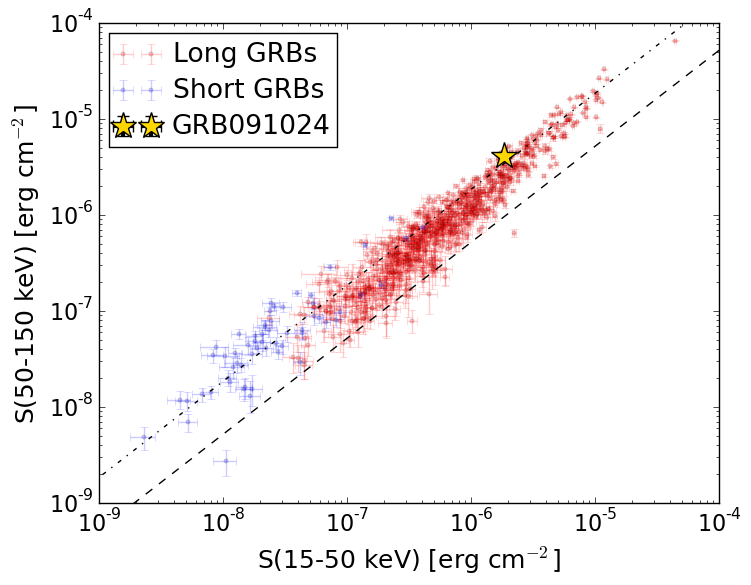
S(15-50 keV)  = 1.8341396e-06
S(50-150 keV) = 4.149176e-06
The dash-dotted line and the dashed line traces the fluences calculated from the Band function with Epeak = 15 and 150 keV, respectively. Both lines assume a canonical values of alpha = -1 and beta = -2.5.
Mask shadow pattern
IMX = -9.800457962126508E-01, IMY = -5.769424024744253E-03
Spacecraft aspect plot
Bright source in the pre-burst/pre-slew/post-slew images
Pre-burst image of 15-350 keV band
Time interval of the image:
-237.363410 -15.204000

# RAcent  DECcent POSerr Theta    Phi  PeakCts   SNR AngSep     Name
#  [deg]    [deg]    ['] [deg]  [deg]                   [']
 83.6306  22.0083    0.4  37.6   27.6   8.5473  29.1    0.4	Crab
 16.3966  37.5830    3.2  39.2  132.8   1.6668   3.6 ------	UNKNOWN
350.3983  42.1682    2.8  49.4  158.3   2.4888   4.2 ------	UNKNOWN
311.5523  61.1619    2.9  51.2 -162.6   1.6922   3.9 ------	UNKNOWN
129.3917  66.6953    3.0  28.3  -82.1   1.0198   3.8 ------	UNKNOWN
247.8017  74.0727    2.2  47.9 -128.8   4.8481   5.1 ------	UNKNOWN
Pre-slew background subtracted image of 15-350 keV band
Time interval of the image:
-15.204000 134.984000

# RAcent  DECcent POSerr Theta    Phi  PeakCts   SNR AngSep     Name
#  [deg]    [deg]    ['] [deg]  [deg]                   [']
 83.5139  22.1123   11.8  37.5   27.7   0.2604   1.0    8.9	Crab
339.2389  56.8853    0.4  44.4  179.7   9.2333  32.1 ------	UNKNOWN
334.0666  70.3952    2.2  38.3 -161.7   1.1187   5.2 ------	UNKNOWN
116.1470  35.7524    2.5  38.3  -24.7   1.0329   4.6 ------	UNKNOWN
269.1386  78.7543    2.3  42.7 -134.9   1.5979   5.0 ------	UNKNOWN
Post-slew image of 15-350 keV band
Time interval of the image:
502.836600 962.676000

# RAcent  DECcent POSerr Theta    Phi  PeakCts   SNR AngSep     Name
#  [deg]    [deg]    ['] [deg]  [deg]                   [']
254.4795  35.3439    6.9  56.7 -152.7   2.8194   1.7    1.1	Her X-1
121.3323  34.9005    2.7  41.8   43.1   2.8555   4.2 ------	UNKNOWN
185.4123  34.3527    3.3  18.1  -72.6   0.9885   3.5 ------	UNKNOWN
265.9809  43.8055    2.8  57.6 -167.2   5.3619   4.1 ------	UNKNOWN
178.7650   2.7149    3.0  48.3  -50.0   5.9869   3.8 ------	UNKNOWN