Analysis Summary
Notes:
- 1) No attempt has been made to eliminate the non-significant decimal places.
- 2) This batgrbproduct analysis is done using the HEASARC data.
- 3) This batgrbproduct analysis is using the flight position for the mask-weighting calculation.
======================================================================
                  BAT GRB EVENT DATA PROCESSING REPORT
    Process Script Ver: batgrbproduct v2.46
    Process Start Time: Sun Jan 19 13:16:46 EST 2014
             Host Name: batevent1
   Current Working Dir: /local/data/batevent/batevent_reproc/trigger374210
======================================================================

  Trigger: 00374210      Segment: 000

  BAT Trigger Time: 278481207.808   [s; MET]
      Trigger Stop: 278481208.832   [s; MET]
               UTC: 2009-10-29T03:53:22.595560    [includes UTCF correction]
       Where From?: TDRSS position message

  BAT
    RA: 60.1834083668177   Dec: -55.9938395285014  [deg; J2000]

     Catalogged Source?: NO
     Point Source?:      YES
     GRB Indicated?:     YES    [ by BAT flight software ]
     Image S/N Ratio:    9.18
     Image Trigger?:     NO
     Rate S/N Ratio:     17  [ if not an image trigger ]
     Image S/N Ratio:    9.18

  Analysis Position:   [ source = BAT ]
    RA: 60.1834083668177   Dec: -55.9938395285014  [deg; J2000]

  Refined Position:   [ source = BAT pre-slew burst ]
    RA: 60.1662512958901   Dec: -55.9531332276406  [deg; J2000]
        { 04h 00m 39.9s , -55d 57' 11.3" }
         +/- 0.619877886964584 [arcmin] (estimated 90% radius based on SNR)
         +/- 0.182488643881972 [arcmin] (formal 1-sigma fit error)
    SNR: 60.2315290821368

  Angular difference between the analysis and refined position is 2.509389 arcmin

  Partial Coding Fraction: 0.9921875    [ including projection effects ]

  Duration
     T90: 39.1799999475479 +/- 4.86097931840566
        Measured from: 1.02399998903275
                   to: 40.2039999365807     [s; relative to TRIGTIME]
     T50: 13.4519999027252 +/- 1.08071822949528
        Measured from: 14.7599999904633
                   to: 28.2119998931885     [s; relative to TRIGTIME]


  Fluence
     Peak Flux  (peak 1 second)
        Measured from: 19.1199999451637
                   to: 20.1199999451637     [s; relative to TRIGTIME]
     Total Fluence
        Measured from: -1.77200001478195
                   to: 60.1959999799728     [s; relative to TRIGTIME]

             Band 1     Band 2     Band 3     Band 4
              15-25      25-50     50-100    100-350     keV
 Total     1.639923   1.778407   1.012000   0.180727
           0.040332   0.042179   0.037240   0.031985 [error]
 Peak      0.077312   0.084098   0.048748   0.010497
           0.005797   0.006212   0.005363   0.004167 [error]

     [ fluence units of on-axis counts / fully illuminated detector ]

======================================================================


====== Table of the duration information =============================

        Value   tstart    tstop
T100   61.968   -1.772   60.196
T90    39.180    1.024   40.204
T50    13.452   14.760   28.212
Peak    1.000   19.120   20.120


====== Spectral Analysis Summary =====================================

Model      : spectral model: simple power-law (PL) and cutoff power-law (CPL)
Ph_index   : photon index: E^{Ph_index}
Ph_90err   : 90% error of the photon index
Epeak      : Epeak in keV
Epeak_90err: 90% error of Epeak
Norm       : normalization at 50 keV in both the PL model and CPL model
Nomr_90err : 90% error of the normalization
chi2       : Chi-Squared
dof        : degree of freedo

=== Time-averaged spectral analysis ===
(Best model with acceptable fit: CPL)

Model Ph_index Ph_90err_low Ph_90err_hi  Epeak  Epeak_90err_low  Epeak_90err_hi  Norm       Nomr_90err_low    Norm_90err_hi    chi2    dof
PL      -1.883    -0.065      0.065       -           -               -         4.40e-03     -1.53e-04          1.52e-04      56.440   57
CPL     -1.460    -0.267      0.285       61.321      -9.106        25.040      7.22e-03     -1.89e-03          2.79e-03      48.840   56


=== 1-s peak spectral analysis ===
(Best model with acceptable fit: CPL)

Model Ph_index Ph_90err_low Ph_90err_hi  Epeak  Epeak_90err_low  Epeak_90err_hi  Norm       Nomr_90err_low    Norm_90err_hi    chi2    dof
PL      -1.795     -0.146     0.142       -           -               -         1.29e-02     -1.25e-03          1.23e-03      63.200   57
CPL     -0.926     -0.596     0.703       53.163      -9.778        26.842      4.00e-02     -2.13e-02          6.02e-02      56.540   56


=== Fluence/Peak Flux Summary ===

              Model    Band1     Band2     Band3     Band4     Band5     Total
                       15-25     25-50    50-100    100-350    15-150    15-350    keV
Fluence         PL   5.00e-07  7.27e-07  7.89e-07  1.60e-06  2.51e-06  3.61e-06   erg/cm2
      90%_error_low -2.84e-08 -2.40e-08 -3.81e-08 -1.62e-07 -8.65e-08 -1.92e-07   erg/cm2
      90%_error_hi   2.90e-08  2.39e-08  3.81e-08  1.74e-07  8.68e-08  2.01e-07   erg/cm2
Peak flux       PL   7.03e-01  5.94e-01  3.42e-01  2.94e-01  1.77e+00  1.93e+00   ph/cm2/s
      90%_error_low -8.43e-02 -4.92e-02 -4.29e-02 -6.51e-02 -1.46e-01 -1.63e-01   ph/cm2/s
      90%_error_hi   8.64e-02  4.92e-02  4.32e-02  7.56e-02  1.46e-01  1.63e-01   ph/cm2/s

Fluence        CPL   4.62e-07  7.51e-07  7.94e-07  8.60e-07  2.41e-06  2.87e-06   erg/cm2
      90%_error_low -3.58e-08 -2.80e-08 -4.03e-08 -2.57e-07 -1.06e-07 -2.84e-07   erg/cm2
      90%_error_hi   3.64e-08  2.83e-08  4.04e-08  3.92e-07  1.07e-07  4.08e-07   erg/cm2
Peak flux      CPL   6.42e-01  6.58e-01  3.44e-01  1.02e-01  1.72e+00  1.75e+00   ph/cm2/s
      90%_error_low -9.61e-02 -6.52e-02 -5.06e-02 -5.45e-02 -1.50e-01 -1.62e-01   ph/cm2/s
      90%_error_hi   9.66e-02  6.74e-02  4.93e-02  1.04e-01  1.50e-01  1.72e-01   ph/cm2/s

======================================================================
Image
Pre-slew 15.0-350.0 keV image (Event data)
#   RAcent    DECcent   POSerr    Theta     Phi              Peak Cts       SNR   Name
   60.1663   -55.9531   0.0032    16.9672  -148.5710         4.0254195     60.232 TRIG_00374210

Foreground time interval of the image:
 -1.772  30.493 (delta_t =  32.265 [sec])
Background time interval of the image:
-126.707  -1.772 (delta_t = 124.935 [sec])
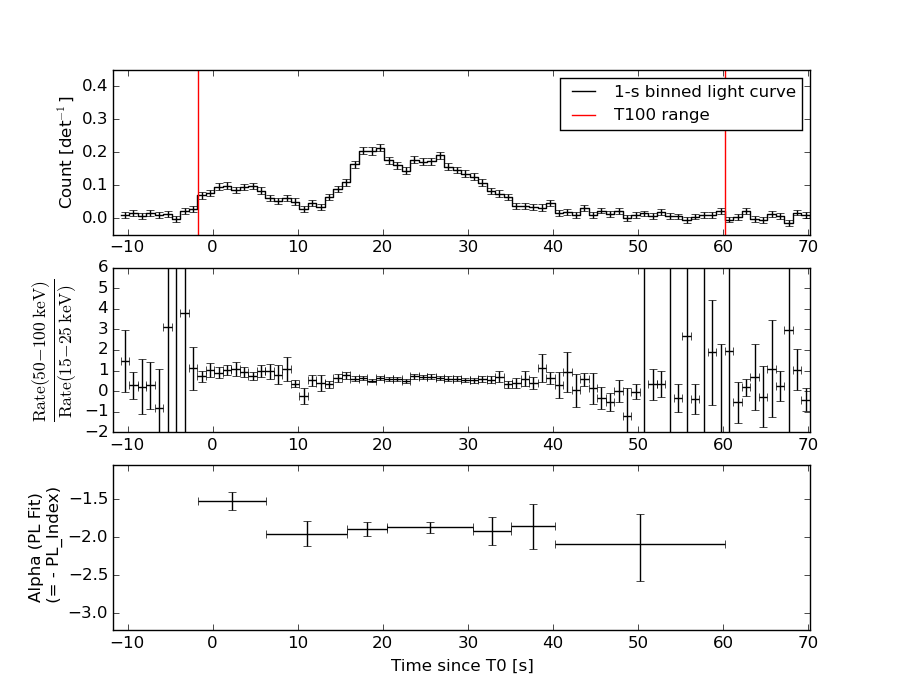
Light Curves
Note: The mask-weighted lightcurves have units of either count/det or counts/sec/det, where a det is 0.4 x 0.4 = 0.16 sq cm.
Full-time range; 1 s binning
Other quick-look light curves:
- 64 ms binning (zoomed)
- 16 ms binning (zoomed)
- 8 ms binning (zoomed)
- 2 ms binning (zoomed)
- SN=5 or 10 s binning (full-time range)
- Raw light curve
Spectra
- 64 ms binning (zoomed)
- 16 ms binning (zoomed)
- 8 ms binning (zoomed)
- 2 ms binning (zoomed)
- SN=5 or 10 s binning (full-time range)
- Raw light curve
Spectra
Notes:
- 1) The fitting includes the systematic errors.
- 2) When the burst includes telescope slew time periods, the fitting uses an average response file made from multiple 5-s response files through out the slew time plus single time preiod for the non-slew times, and weighted by the total counts in the corresponding time period using addrmf. An average response file is needed becuase a spectral fit using the pre-slew DRM will introduce some errors in both a spectral shape and a normalization if the PHA file contains a lot of the slew/post-slew time interval.
- 3) For fits to more complicated models (e.g. a power-law over a cutoff power-law), the BAT team has decided to require a chi-square improvement of more than 6 for each extra dof.
Time averaged spectrum fit using the average DRM
Power-law model
Time interval is from   -1.772 sec. to   60.196 sec.

Spectral model in power-law:
------------------------------------------------------------
Parameters  : value       lower 90%   higher 90%
Photon index: -1.88333     ( -0.0652886   0.0646432 )
Norm@50keV  : 4.40134E-03    ( -0.000152602   0.000151933 )
------------------------------------------------------------
#Fit statistic : Chi-Squared =          56.44 using 59 PHA bins.
# Reduced chi-squared =         0.9902 for     57 degrees of freedom
# Null hypothesis probability =   4.960667e-01

Photon flux (15-150 keV)    in 61.97 sec: 0.627255 ( -0.021638  0.021717 ) ph/cm2/s
Energy fluence (15-150 keV)             : 2.50779e-06 ( -8.64736e-08  8.68169e-08 ) ergs/cm2
Cutoff power-law model
Time interval is from   -1.772 sec. to   60.196 sec.
Spectral model in the cutoff power-law:
------------------------------------------------------------
Parameters  : value       lower 90%   higher 90%
Photon index: -1.46003     ( -0.266707   0.284542 )
Epeak [keV] : 61.3208      ( -9.10634 25.0403 )
Norm@50keV  : 7.21915E-03    ( -0.00189279   0.00279095 )
------------------------------------------------------------
#Fit statistic : Chi-Squared =          48.84 using 59 PHA bins.
# Reduced chi-squared =         0.8722 for     56 degrees of freedom
# Null hypothesis probability =   7.401632e-01

Photon flux (15-150 keV)    in 61.97 sec: 0.606243 ( -0.024955  0.025093 ) ph/cm2/s
Energy fluence (15-150 keV)             : 2.40515e-06 ( -1.06241e-07  1.06573e-07 ) ergs/cm2
1-s peak spectrum fit
Power-law model
Time interval is from   19.120 sec. to   20.120 sec.

Spectral model in power-law:
------------------------------------------------------------
Parameters  : value       lower 90%   higher 90%
Photon index: -1.79529     ( -0.146361   0.141793 )
Norm@50keV  : 1.28516E-02    ( -0.00124778   0.00123107 )
------------------------------------------------------------
#Fit statistic : Chi-Squared =          63.20 using 59 PHA bins.
# Reduced chi-squared =          1.109 for     57 degrees of freedom
# Null hypothesis probability =   2.667920e-01

Photon flux (15-150 keV)    in 1 sec: 1.76779 ( -0.14646  0.14648 ) ph/cm2/s
Energy fluence (15-150 keV)             : 1.1835e-07 ( -1.16388e-08  1.18257e-08 ) ergs/cm2
Cutoff power-law model
Time interval is from   19.120 sec. to   20.120 sec.
Spectral model in the cutoff power-law:
------------------------------------------------------------
Parameters  : value       lower 90%   higher 90%
Photon index: -0.926139     ( -0.595912   0.703384 )
Epeak [keV] : 53.1629      ( -9.778 26.842 )
Norm@50keV  : 4.00029E-02    ( -0.0213234   0.0602281 )
------------------------------------------------------------
#Fit statistic : Chi-Squared =          56.54 using 59 PHA bins.
# Reduced chi-squared =          1.010 for     56 degrees of freedom
# Null hypothesis probability =   4.547193e-01

Photon flux (15-150 keV)    in 1 sec: 1.71815 ( -0.14989  0.15 ) ph/cm2/s
Energy fluence (15-150 keV)             : 1.08956e-07 ( -1.27217e-08  1.32071e-08 ) ergs/cm2
Time-resolved spectra
Distribution
T90 vs. Hardness ratio plot
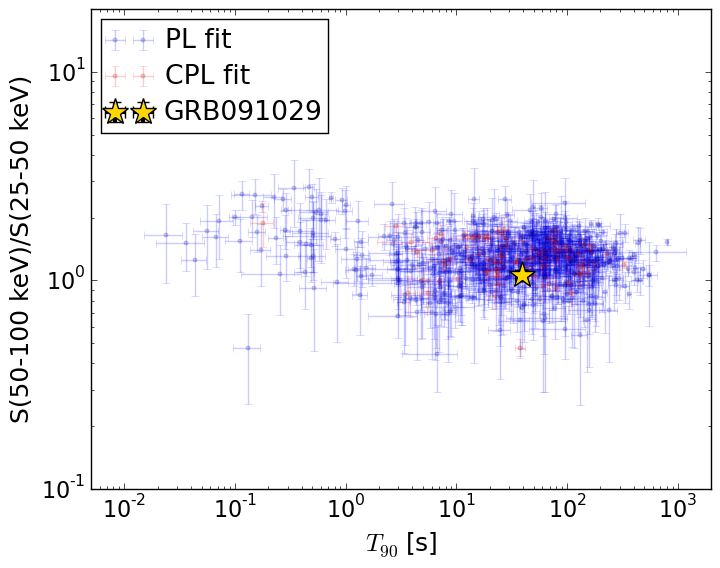
T90                                   = 39.18 sec.
Hardness ratio (energy fluence ratio) = 1.05752341801
S(15-50 keV) vs. S(50-150 keV) plot
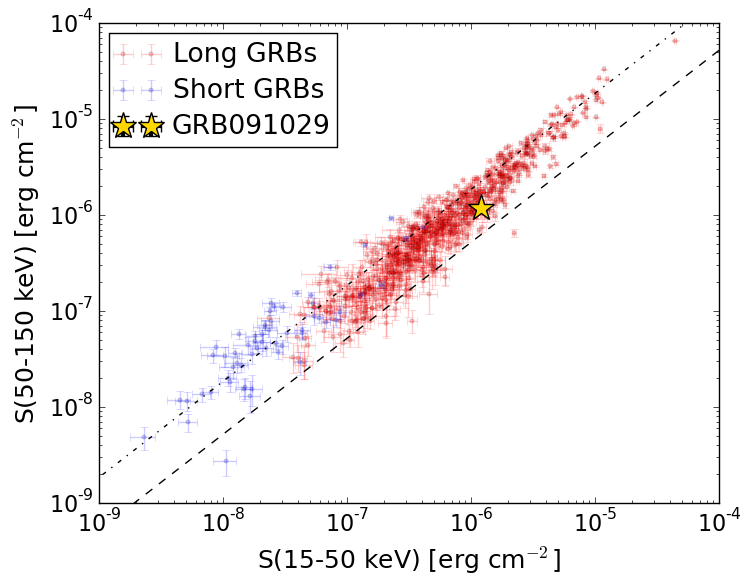
S(15-50 keV)  = 1.2128094e-06
S(50-150 keV) = 1.19235e-06
The dash-dotted line and the dashed line traces the fluences calculated from the Band function with Epeak = 15 and 150 keV, respectively. Both lines assume a canonical values of alpha = -1 and beta = -2.5.
Mask shadow pattern
IMX = -2.603424606581088E-01, IMY = 1.590946205857086E-01
Spacecraft aspect plot
Bright source in the pre-burst/pre-slew/post-slew images
Pre-burst image of 15-350 keV band
Time interval of the image:
-126.707400 -1.772000

# RAcent  DECcent POSerr Theta    Phi  PeakCts   SNR AngSep     Name
#  [deg]    [deg]    ['] [deg]  [deg]                   [']
 78.5724 -17.4475    2.8  49.4  158.2   1.5483   4.2 ------	UNKNOWN
319.7724 -47.0225    2.9  46.0  -21.3   0.8767   4.0 ------	UNKNOWN
Pre-slew background subtracted image of 15-350 keV band
Time interval of the image:
-1.772000 30.492580

# RAcent  DECcent POSerr Theta    Phi  PeakCts   SNR AngSep     Name
#  [deg]    [deg]    ['] [deg]  [deg]                   [']
 60.1662 -55.9531    0.2  17.0 -148.6   4.0253  60.3 ------	UNKNOWN
335.3152 -51.2973    2.1  35.0  -19.7   0.4456   5.4 ------	UNKNOWN
Post-slew image of 15-350 keV band
Time interval of the image:
68.292590 962.303000

# RAcent  DECcent POSerr Theta    Phi  PeakCts   SNR AngSep     Name
#  [deg]    [deg]    ['] [deg]  [deg]                   [']
135.5322 -40.5584   57.4  49.7 -137.1  -0.4876  -0.2    0.3	Vela X-1
 90.8484 -12.6014    3.3  49.4  158.3   4.6677   3.5 ------	UNKNOWN
332.8309 -43.6858    2.9  53.7    0.9   6.4799   4.7 ------	UNKNOWN
332.8504 -43.8681    3.5  53.6    0.8   6.4129   4.7 ------	UNKNOWN
106.1509 -43.7249    2.5  31.4 -155.9   2.2351   4.7 ------	UNKNOWN
121.6104 -18.2838    3.1  59.1 -166.2  15.1114   3.8 ------	UNKNOWN
310.2111 -68.5016    2.9  45.5  -33.8   3.5250   4.0 ------	UNKNOWN
144.6728 -57.4588    2.9  43.3 -114.0   9.9166   4.0 ------	UNKNOWN