Analysis Summary
Notes:
- 1) No attempt has been made to eliminate the non-significant decimal places.
- 2) This batgrbproduct analysis is done using the HEASARC data.
- 3) This batgrbproduct analysis is using the flight position for the mask-weighting calculation.
======================================================================
                  BAT GRB EVENT DATA PROCESSING REPORT
    Process Script Ver: batgrbproduct v2.46
    Process Start Time: Sun Jan 19 13:05:58 EST 2014
             Host Name: batevent1
   Current Working Dir: /local/data/batevent/batevent_reproc/trigger374598
======================================================================

  Trigger: 00374598      Segment: 000

  BAT Trigger Time: 278865283.584   [s; MET]
      Trigger Stop: 278865284.608   [s; MET]
               UTC: 2009-11-02T14:34:38.358760    [includes UTCF correction]
       Where From?: TDRSS position message

  BAT
    RA: 72.6742345146145   Dec: -72.5096722528519  [deg; J2000]

     Catalogged Source?: NO
     Point Source?:      YES
     GRB Indicated?:     YES    [ by BAT flight software ]
     Image S/N Ratio:    13.01
     Image Trigger?:     NO
     Rate S/N Ratio:     29.8496231131986  [ if not an image trigger ]
     Image S/N Ratio:    13.01

  Analysis Position:   [ source = BAT ]
    RA: 72.6742345146145   Dec: -72.5096722528519  [deg; J2000]

  Refined Position:   [ source = BAT pre-slew burst ]
    RA: 72.6217139100931   Dec: -72.5272957296157  [deg; J2000]
        { 04h 50m 29.2s , -72d 31' 38.3" }
         +/- 1.188577421284 [arcmin] (estimated 90% radius based on SNR)
         +/- 0.444833580463779 [arcmin] (formal 1-sigma fit error)
    SNR: 23.7649153381865

  Angular difference between the analysis and refined position is 1.419229 arcmin

  Partial Coding Fraction: 0.8046875    [ including projection effects ]

  Duration
     T90: 6.6479999423027 +/- 0.466699022673212
        Measured from: -0.412000000476837
                   to: 6.23599994182587     [s; relative to TRIGTIME]
     T50: 3.37999993562698 +/- 0.856861668927801
        Measured from: 0.544000029563904
                   to: 3.92399996519089     [s; relative to TRIGTIME]


  Fluence
     Peak Flux  (peak 1 second)
        Measured from: -0.255999982357025
                   to: 0.744000017642975     [s; relative to TRIGTIME]
     Total Fluence
        Measured from: -0.779999971389771
                   to: 6.63200002908707     [s; relative to TRIGTIME]

             Band 1     Band 2     Band 3     Band 4
              15-25      25-50     50-100    100-350     keV
 Total     0.146619   0.270290   0.238510   0.104995
           0.015270   0.017028   0.016113   0.014644 [error]
 Peak      0.040105   0.065762   0.062156   0.023138
           0.005827   0.006666   0.006542   0.005973 [error]

     [ fluence units of on-axis counts / fully illuminated detector ]

======================================================================


====== Table of the duration information =============================

        Value   tstart    tstop
T100    7.412   -0.780    6.632
T90     6.648   -0.412    6.236
T50     3.380    0.544    3.924
Peak    1.000   -0.256    0.744


====== Spectral Analysis Summary =====================================

Model      : spectral model: simple power-law (PL) and cutoff power-law (CPL)
Ph_index   : photon index: E^{Ph_index}
Ph_90err   : 90% error of the photon index
Epeak      : Epeak in keV
Epeak_90err: 90% error of Epeak
Norm       : normalization at 50 keV in both the PL model and CPL model
Nomr_90err : 90% error of the normalization
chi2       : Chi-Squared
dof        : degree of freedo

=== Time-averaged spectral analysis ===
(Best model with acceptable fit: PL)

Model Ph_index Ph_90err_low Ph_90err_hi  Epeak  Epeak_90err_low  Epeak_90err_hi  Norm       Nomr_90err_low    Norm_90err_hi    chi2    dof
PL      -1.079    -0.120      0.122       -           -               -         6.72e-03     -4.55e-04          4.55e-04      40.550   57
CPL     -0.926    -0.213      0.507      375.349    -375.349      -375.349      7.96e-03     -1.62e-03          5.75e-03      40.240   56


=== 1-s peak spectral analysis ===
(Best model with acceptable fit: PL)

Model Ph_index Ph_90err_low Ph_90err_hi  Epeak  Epeak_90err_low  Epeak_90err_hi  Norm       Nomr_90err_low    Norm_90err_hi    chi2    dof
PL      -1.058     -0.183     0.187       -           -               -         1.24e-02     -1.32e-03          1.32e-03      70.540   57
CPL     -0.721     -0.429     0.803      197.373    -197.373      -197.373      1.81e-02     -7.22e-03          2.57e-02      69.850   56


=== Fluence/Peak Flux Summary ===

              Model    Band1     Band2     Band3     Band4     Band5     Total
                       15-25     25-50    50-100    100-350    15-150    15-350    keV
Fluence         PL   4.30e-08  1.02e-07  1.94e-07  8.90e-07  5.24e-07  1.23e-06   erg/cm2
      90%_error_low -5.62e-09 -8.10e-09 -1.55e-08 -1.52e-07 -3.99e-08 -1.63e-07   erg/cm2
      90%_error_hi   5.85e-09  8.03e-09  1.54e-08  1.74e-07  4.02e-08  1.82e-07   erg/cm2
Peak flux       PL   3.33e-01  4.37e-01  4.20e-01  7.17e-01  1.43e+00  1.91e+00   ph/cm2/s
      90%_error_low -6.58e-02 -5.45e-02 -5.26e-02 -1.74e-01 -1.53e-01 -2.29e-01   ph/cm2/s
      90%_error_hi   6.96e-02  5.37e-02  5.21e-02  2.09e-01  1.53e-01  2.40e-01   ph/cm2/s

Fluence        CPL   4.17e-08  1.04e-07  1.96e-07  7.02e-07  5.18e-07  1.04e-06   erg/cm2
      90%_error_low -6.41e-09 -8.67e-09 -1.72e-08 -3.47e-07 -4.47e-08 -3.46e-07   erg/cm2
      90%_error_hi   5.91e-09  9.43e-09  1.76e-08  2.47e-07  4.37e-08  3.76e-07   erg/cm2
Peak flux      CPL   3.13e-01  4.51e-01  4.33e-01  4.77e-01  1.41e+00  1.67e+00   ph/cm2/s
      90%_error_low -7.77e-02 -6.14e-02 -5.88e-02 -2.61e-01 -1.59e-01 -3.10e-01   ph/cm2/s
      90%_error_hi   8.06e-02  6.38e-02  6.07e-02  3.00e-01  1.58e-01  3.60e-01   ph/cm2/s

======================================================================
Image
Pre-slew 15.0-350.0 keV image (Event data)
#   RAcent    DECcent   POSerr    Theta     Phi              Peak Cts       SNR   Name
   72.6217   -72.5273   0.0080    17.3622   -81.3692         0.7818382     23.765 TRIG_00374598

Foreground time interval of the image:
 -0.780   6.632 (delta_t =   7.412 [sec])
Background time interval of the image:
-239.584  -0.780 (delta_t = 238.804 [sec])
Light Curves
Note: The mask-weighted lightcurves have units of either count/det or counts/sec/det, where a det is 0.4 x 0.4 = 0.16 sq cm.
Full-time range; 1 s binning
Other quick-look light curves:
- 64 ms binning (zoomed)
- 16 ms binning (zoomed)
- 8 ms binning (zoomed)
- 2 ms binning (zoomed)
- SN=5 or 10 s binning (full-time range)
- Raw light curve
Spectra
- 64 ms binning (zoomed)
- 16 ms binning (zoomed)
- 8 ms binning (zoomed)
- 2 ms binning (zoomed)
- SN=5 or 10 s binning (full-time range)
- Raw light curve
Spectra
Notes:
- 1) The fitting includes the systematic errors.
- 2) When the burst includes telescope slew time periods, the fitting uses an average response file made from multiple 5-s response files through out the slew time plus single time preiod for the non-slew times, and weighted by the total counts in the corresponding time period using addrmf. An average response file is needed becuase a spectral fit using the pre-slew DRM will introduce some errors in both a spectral shape and a normalization if the PHA file contains a lot of the slew/post-slew time interval.
- 3) For fits to more complicated models (e.g. a power-law over a cutoff power-law), the BAT team has decided to require a chi-square improvement of more than 6 for each extra dof.
Time averaged spectrum fit using the average DRM
Power-law model
Time interval is from   -0.780 sec. to    6.632 sec.

Spectral model in power-law:
------------------------------------------------------------
Parameters  : value       lower 90%   higher 90%
Photon index: -1.07922     ( -0.119947   0.121793 )
Norm@50keV  : 6.72200E-03    ( -0.000454734   0.000454571 )
------------------------------------------------------------
#Fit statistic : Chi-Squared =          40.55 using 59 PHA bins.
# Reduced chi-squared =         0.7114 for     57 degrees of freedom
# Null hypothesis probability =   9.511406e-01

Photon flux (15-150 keV)    in 7.412 sec: 0.778213 ( -0.053659  0.053709 ) ph/cm2/s
Energy fluence (15-150 keV)             : 5.24476e-07 ( -3.99408e-08  4.02469e-08 ) ergs/cm2
Cutoff power-law model
Time interval is from   -0.780 sec. to    6.632 sec.
Spectral model in the cutoff power-law:
------------------------------------------------------------
Parameters  : value       lower 90%   higher 90%
Photon index: -0.926333     ( -0.212869   0.50696 )
Epeak [keV] : 375.349      ( -375.408 -375.408 )
Norm@50keV  : 7.95773E-03    ( -0.00161933   0.00574543 )
------------------------------------------------------------
#Fit statistic : Chi-Squared =          40.24 using 59 PHA bins.
# Reduced chi-squared =         0.7185 for     56 degrees of freedom
# Null hypothesis probability =   9.444286e-01

Photon flux (15-150 keV)    in 7.412 sec: 0.773106 ( -0.055914  0.055672 ) ph/cm2/s
Energy fluence (15-150 keV)             : 5.18377e-07 ( -4.46855e-08  4.37386e-08 ) ergs/cm2
1-s peak spectrum fit
Power-law model
Time interval is from   -0.256 sec. to    0.744 sec.

Spectral model in power-law:
------------------------------------------------------------
Parameters  : value       lower 90%   higher 90%
Photon index: -1.05757     ( -0.183376   0.187243 )
Norm@50keV  : 1.23515E-02    ( -0.00131697   0.00131692 )
------------------------------------------------------------
#Fit statistic : Chi-Squared =          70.54 using 59 PHA bins.
# Reduced chi-squared =          1.237 for     57 degrees of freedom
# Null hypothesis probability =   1.073420e-01

Photon flux (15-150 keV)    in 1 sec: 1.42738 ( -0.15325  0.15333 ) ph/cm2/s
Energy fluence (15-150 keV)             : 1.30954e-07 ( -1.61096e-08  1.63112e-08 ) ergs/cm2
Cutoff power-law model
Time interval is from   -0.256 sec. to    0.744 sec.
Spectral model in the cutoff power-law:
------------------------------------------------------------
Parameters  : value       lower 90%   higher 90%
Photon index: -0.721453     ( -0.428862   0.802624 )
Epeak [keV] : 197.373      ( -197.381 -197.381 )
Norm@50keV  : 1.80899E-02    ( -0.007216   0.0256802 )
------------------------------------------------------------
#Fit statistic : Chi-Squared =          69.85 using 59 PHA bins.
# Reduced chi-squared =          1.247 for     56 degrees of freedom
# Null hypothesis probability =   1.010006e-01

Photon flux (15-150 keV)    in 1 sec: 1.40837 ( -0.15881  0.15818 ) ph/cm2/s
Energy fluence (15-150 keV)             : 1.2721e-07 ( -1.8312e-08  1.79811e-08 ) ergs/cm2
Time-resolved spectra
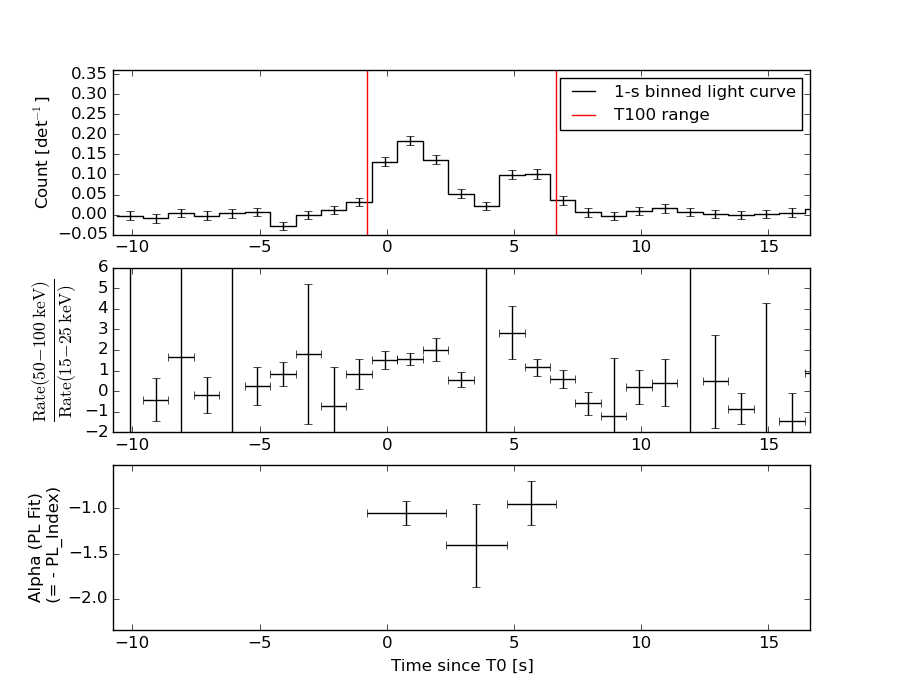
Distribution
T90 vs. Hardness ratio plot
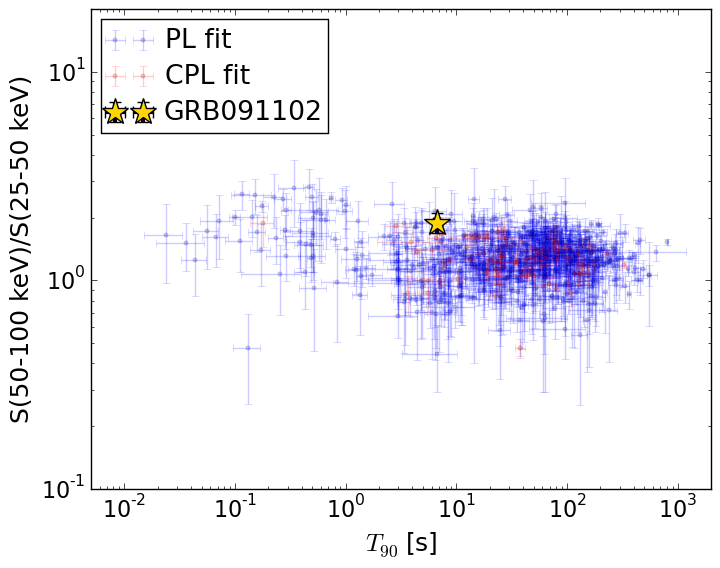
T90                                   = 6.648 sec.
Hardness ratio (energy fluence ratio) = 1.89317118254
S(15-50 keV) vs. S(50-150 keV) plot
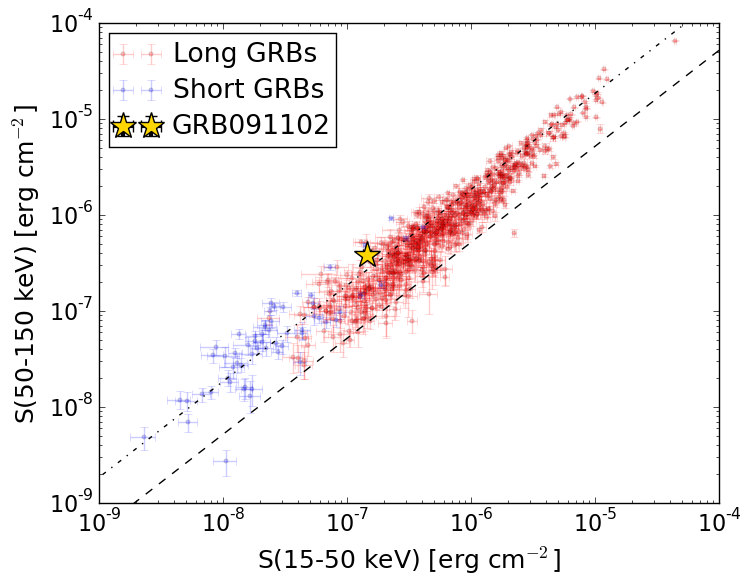
S(15-50 keV)  = 1.4520962e-07
S(50-150 keV) = 3.792707e-07
The dash-dotted line and the dashed line traces the fluences calculated from the Band function with Epeak = 15 and 150 keV, respectively. Both lines assume a canonical values of alpha = -1 and beta = -2.5.
Mask shadow pattern
IMX = 4.691906941692836E-02, IMY = 3.091151598307949E-01
Spacecraft aspect plot
Bright source in the pre-burst/pre-slew/post-slew images
Pre-burst image of 15-350 keV band
Time interval of the image:
-239.584000 -0.780000

# RAcent  DECcent POSerr Theta    Phi  PeakCts   SNR AngSep     Name
#  [deg]    [deg]    ['] [deg]  [deg]                   [']
135.6842 -40.5432    5.0  49.8 -143.1   1.3426   2.3    7.1	Vela X-1
336.4722 -44.3801    2.3  51.4   -3.5   2.2221   5.1 ------	UNKNOWN
320.8355 -54.9312    2.3  51.2  -22.2   2.3076   5.0 ------	UNKNOWN
270.4519 -78.2937    3.8  44.5  -60.4   2.8168   3.1 ------	UNKNOWN
Pre-slew background subtracted image of 15-350 keV band
Time interval of the image:
-0.780000 6.632000

# RAcent  DECcent POSerr Theta    Phi  PeakCts   SNR AngSep     Name
#  [deg]    [deg]    ['] [deg]  [deg]                   [']
135.4026 -40.6125 1293.1  49.6 -143.3  -0.0009  -0.0    6.7	Vela X-1
 72.6217 -72.5273    0.5  17.4  -81.4   0.7817  23.7 ------	UNKNOWN
 95.2771 -65.5434    2.5  19.3 -114.9   0.1401   4.5 ------	UNKNOWN
323.7758 -78.3246    2.4  37.0  -49.3   0.2449   4.8 ------	UNKNOWN
302.7155 -57.6242    2.4  55.8  -33.8   0.7918   4.9 ------	UNKNOWN
Post-slew image of 15-350 keV band
Time interval of the image:
276.716600 832.916600

# RAcent  DECcent POSerr Theta    Phi  PeakCts   SNR AngSep     Name
#  [deg]    [deg]    ['] [deg]  [deg]                   [']
144.6345  14.6371    2.3  44.1    7.7   2.7346   5.1 ------	UNKNOWN