Analysis Summary
Notes:
- 1) No attempt has been made to eliminate the non-significant decimal places.
- 2) This batgrbproduct analysis is done using the HEASARC data.
- 3) This batgrbproduct analysis is using the flight position for the mask-weighting calculation.
======================================================================
                  BAT GRB EVENT DATA PROCESSING REPORT
    Process Script Ver: batgrbproduct v2.46
    Process Start Time: Sun Jan 19 13:01:53 EST 2014
             Host Name: batevent1
   Current Working Dir: /local/data/batevent/batevent_reproc/trigger374875
======================================================================

  Trigger: 00374875      Segment: 000

  BAT Trigger Time: 279017368   [s; MET]
      Trigger Stop: 279017432   [s; MET]
               UTC: 2009-11-04T08:49:22.769700    [includes UTCF correction]
       Where From?: TDRSS position message

  BAT
    RA: 208.742361503349   Dec: 47.3985736611166  [deg; J2000]

     Catalogged Source?: NO
     Point Source?:      YES
     GRB Indicated?:     YES    [ by BAT flight software ]
     Image S/N Ratio:    7.72
     Image Trigger?:     YES
     Rate S/N Ratio:     0  [ if not an image trigger ]
     Image S/N Ratio:    7.72

  Analysis Position:   [ source = BAT ]
    RA: 208.742361503349   Dec: 47.3985736611166  [deg; J2000]

  Refined Position:   [ source = BAT pre-slew burst ]
    RA: 208.72632023517   Dec: 47.3909759427838  [deg; J2000]
        { 13h 54m 54.3s , +47d 23' 27.5" }
         +/- 2.65013664772682 [arcmin] (estimated 90% radius based on SNR)
         +/- 1.10810460127059 [arcmin] (formal 1-sigma fit error)
    SNR: 7.55874032868928

  Angular difference between the analysis and refined position is 0.795184 arcmin

  Partial Coding Fraction: 0.8203125    [ including projection effects ]

  Duration
     T90: 107.135999917984 +/- 19.6440599779123
        Measured from: 7.98000001907349
                   to: 115.115999937057     [s; relative to TRIGTIME]
     T50: 58.351999938488 +/- 15.1044953399545
        Measured from: 27.3439999818802
                   to: 85.6959999203682     [s; relative to TRIGTIME]


  Fluence
     Peak Flux  (peak 1 second)
        Measured from: 83.3360000252724
                   to: 84.3360000252724     [s; relative to TRIGTIME]
     Total Fluence
        Measured from: -1.48000001907349
                   to: 120.519999980927     [s; relative to TRIGTIME]

             Band 1     Band 2     Band 3     Band 4
              15-25      25-50     50-100    100-350     keV
 Total     0.438505   0.501269   0.314328   0.149297
           0.057153   0.059636   0.054273   0.050684 [error]
 Peak      0.007873   0.013757   0.022607   0.005318
           0.005110   0.005489   0.004703   0.004529 [error]

     [ fluence units of on-axis counts / fully illuminated detector ]

======================================================================


====== Table of the duration information =============================

        Value   tstart    tstop
T100  122.000   -1.480  120.520
T90   107.136    7.980  115.116
T50    58.352   27.344   85.696
Peak    1.000   83.336   84.336


====== Spectral Analysis Summary =====================================

Model      : spectral model: simple power-law (PL) and cutoff power-law (CPL)
Ph_index   : photon index: E^{Ph_index}
Ph_90err   : 90% error of the photon index
Epeak      : Epeak in keV
Epeak_90err: 90% error of Epeak
Norm       : normalization at 50 keV in both the PL model and CPL model
Nomr_90err : 90% error of the normalization
chi2       : Chi-Squared
dof        : degree of freedo

=== Time-averaged spectral analysis ===
(Best model with acceptable fit: PL)

Model Ph_index Ph_90err_low Ph_90err_hi  Epeak  Epeak_90err_low  Epeak_90err_hi  Norm       Nomr_90err_low    Norm_90err_hi    chi2    dof
PL      -1.734    -0.243      0.231       -           -               -         6.76e-04     -1.04e-04          1.01e-04      54.280   57
CPL     -1.119    -0.508      1.249       62.272     -37.323       -62.272      1.50e-03     -8.80e-04          5.99e-03      53.190   56


=== 1-s peak spectral analysis ===
(Best model with acceptable fit: PL)

Model Ph_index Ph_90err_low Ph_90err_hi  Epeak  Epeak_90err_low  Epeak_90err_hi  Norm       Nomr_90err_low    Norm_90err_hi    chi2    dof
PL      -0.995     -0.537     0.597       -           -               -         3.13e-03     -1.04e-03          1.02e-03      57.990   57
CPL      0.949     -2.449     6.797       86.954      N/A           N/A         2.12e-02        N/A               N/A         56.590   56


=== Fluence/Peak Flux Summary ===

              Model    Band1     Band2     Band3     Band4     Band5     Total
                       15-25     25-50    50-100    100-350    15-150    15-350    keV
Fluence         PL   1.31e-07  2.09e-07  2.51e-07  5.90e-07  7.62e-07  1.18e-06   erg/cm2
      90%_error_low -2.45e-08 -2.68e-08 -5.20e-08 -2.15e-07 -1.20e-07 -2.73e-07   erg/cm2
      90%_error_hi   2.53e-08  2.68e-08  5.28e-08  2.85e-07  1.24e-07  3.31e-07   erg/cm2
Peak flux       PL   7.95e-02  1.08e-01  1.09e-01  1.97e-01  3.60e-01  4.94e-01   ph/cm2/s
      90%_error_low -4.56e-02 -4.47e-02 -3.75e-02 -1.12e-01 -1.19e-01 -8.21e-02   ph/cm2/s
      90%_error_hi   5.81e-02  4.37e-02  3.69e-02  1.86e-01  1.21e-01  1.82e-01   ph/cm2/s

Fluence        CPL   1.23e-07  2.25e-07  2.48e-07  2.13e-07  7.11e-07  8.10e-07   erg/cm2
      90%_error_low -2.87e-08 -3.65e-08 -6.04e-08 -1.66e-07 -1.36e-07 -2.21e-07   erg/cm2
      90%_error_hi   2.84e-08  3.87e-08  5.75e-08  4.46e-07  1.47e-07  4.86e-07   erg/cm2
Peak flux      CPL   4.45e-02  1.13e-01  1.29e-01  5.26e-02  3.26e-01  3.39e-01   ph/cm2/s
      90%_error_low -4.45e-02 -6.38e-02 -4.75e-02 -5.26e-02 -1.28e-01 -1.41e-01   ph/cm2/s
      90%_error_hi   7.48e-02  5.54e-02  5.17e-02  1.99e-01  1.32e-01  2.44e-01   ph/cm2/s

======================================================================
Image
Pre-slew 15.0-350.0 keV image (Event data)
#   RAcent    DECcent   POSerr    Theta     Phi              Peak Cts       SNR   Name
  208.7263    47.3910   0.0254    21.6965  -131.6940         0.9175478      7.559 TRIG_00374875

Foreground time interval of the image:
 -1.480  73.501 (delta_t =  74.981 [sec])
Background time interval of the image:
-138.099  -1.480 (delta_t = 136.619 [sec])
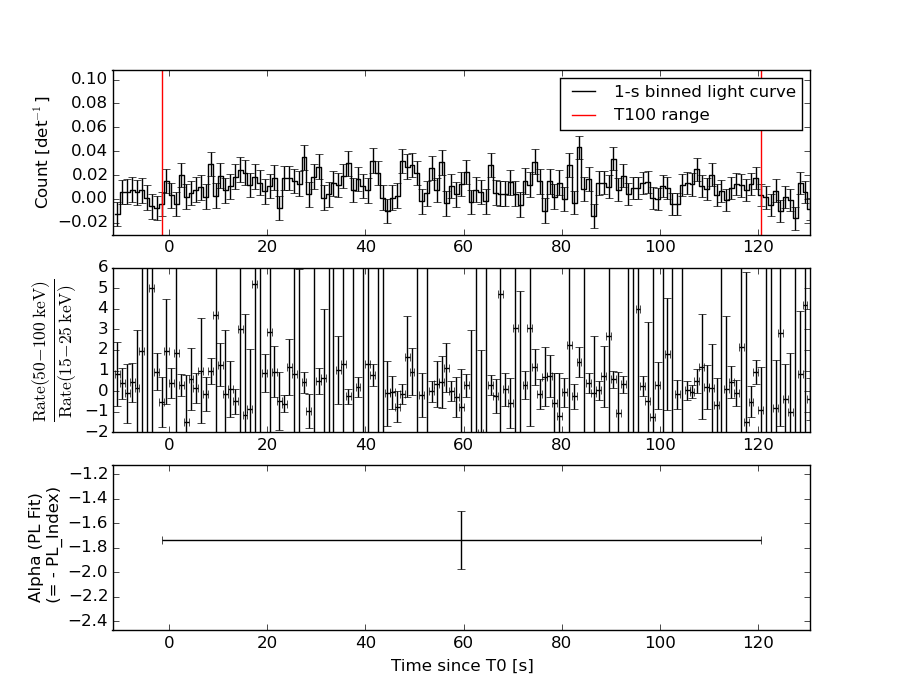
Light Curves
Note: The mask-weighted lightcurves have units of either count/det or counts/sec/det, where a det is 0.4 x 0.4 = 0.16 sq cm.
Full-time range; 1 s binning
Other quick-look light curves:
- 64 ms binning (zoomed)
- 16 ms binning (zoomed)
- 8 ms binning (zoomed)
- 2 ms binning (zoomed)
- SN=5 or 10 s binning (full-time range)
- Raw light curve
Spectra
- 64 ms binning (zoomed)
- 16 ms binning (zoomed)
- 8 ms binning (zoomed)
- 2 ms binning (zoomed)
- SN=5 or 10 s binning (full-time range)
- Raw light curve
Spectra
Notes:
- 1) The fitting includes the systematic errors.
- 2) When the burst includes telescope slew time periods, the fitting uses an average response file made from multiple 5-s response files through out the slew time plus single time preiod for the non-slew times, and weighted by the total counts in the corresponding time period using addrmf. An average response file is needed becuase a spectral fit using the pre-slew DRM will introduce some errors in both a spectral shape and a normalization if the PHA file contains a lot of the slew/post-slew time interval.
- 3) For fits to more complicated models (e.g. a power-law over a cutoff power-law), the BAT team has decided to require a chi-square improvement of more than 6 for each extra dof.
Time averaged spectrum fit using the average DRM
Power-law model
Time interval is from   -1.480 sec. to  120.520 sec.

Spectral model in power-law:
------------------------------------------------------------
Parameters  : value       lower 90%   higher 90%
Photon index: -1.73428     ( -0.243094   0.231102 )
Norm@50keV  : 6.75801E-04    ( -0.000104063   0.000101461 )
------------------------------------------------------------
#Fit statistic : Chi-Squared =          54.28 using 59 PHA bins.
# Reduced chi-squared =         0.9522 for     57 degrees of freedom
# Null hypothesis probability =   5.779072e-01

Photon flux (15-150 keV)    in 122 sec: 9.08601E-02 ( -0.0116566  0.0116569 ) ph/cm2/s
Energy fluence (15-150 keV)             : 7.61623e-07 ( -1.20325e-07  1.23696e-07 ) ergs/cm2
Cutoff power-law model
Time interval is from   -1.480 sec. to  120.520 sec.
Spectral model in the cutoff power-law:
------------------------------------------------------------
Parameters  : value       lower 90%   higher 90%
Photon index: -1.11881     ( -0.508498   1.24911 )
Epeak [keV] : 62.2715      ( -37.3173 -62.2655 )
Norm@50keV  : 1.49831E-03    ( -0.00088003   0.00598882 )
------------------------------------------------------------
#Fit statistic : Chi-Squared =          53.19 using 59 PHA bins.
# Reduced chi-squared =         0.9499 for     56 degrees of freedom
# Null hypothesis probability =   5.817401e-01

Photon flux (15-150 keV)    in 122 sec: 8.85516E-02 ( -0.0122323  0.0122194 ) ph/cm2/s
Energy fluence (15-150 keV)             : 7.11492e-07 ( -1.35721e-07  1.46671e-07 ) ergs/cm2
1-s peak spectrum fit
Power-law model
Time interval is from   83.336 sec. to   84.336 sec.

Spectral model in power-law:
------------------------------------------------------------
Parameters  : value       lower 90%   higher 90%
Photon index: -0.994593     ( -0.536724   0.597466 )
Norm@50keV  : 3.12938E-03    ( -0.00103596   0.00102075 )
------------------------------------------------------------
#Fit statistic : Chi-Squared =          57.99 using 59 PHA bins.
# Reduced chi-squared =          1.017 for     57 degrees of freedom
# Null hypothesis probability =   4.386239e-01

Photon flux (15-150 keV)    in 1 sec: 0.360192 ( -0.119363  0.120947 ) ph/cm2/s
Energy fluence (15-150 keV)             : 3.3907e-08 ( -1.15043e-08  1.17335e-08 ) ergs/cm2
Cutoff power-law model
Time interval is from   83.336 sec. to   84.336 sec.
Spectral model in the cutoff power-law:
------------------------------------------------------------
Parameters  : value       lower 90%   higher 90%
Photon index: 0.949483     ( -2.48835   6.75768 )
Epeak [keV] : 86.9537      (   )
Norm@50keV  : 2.11912E-02    (     )
------------------------------------------------------------
#Fit statistic : Chi-Squared =          56.58 using 59 PHA bins.
# Reduced chi-squared =          1.010 for     56 degrees of freedom
# Null hypothesis probability =   4.532761e-01

Photon flux (15-150 keV)    in 1 sec: 0.326362 ( -0.128432  0.131528 ) ph/cm2/s
Energy fluence (15-150 keV)             : 3.04074e-08 ( -1.19288e-08  1.29118e-08 ) ergs/cm2
Time-resolved spectra
Distribution
T90 vs. Hardness ratio plot
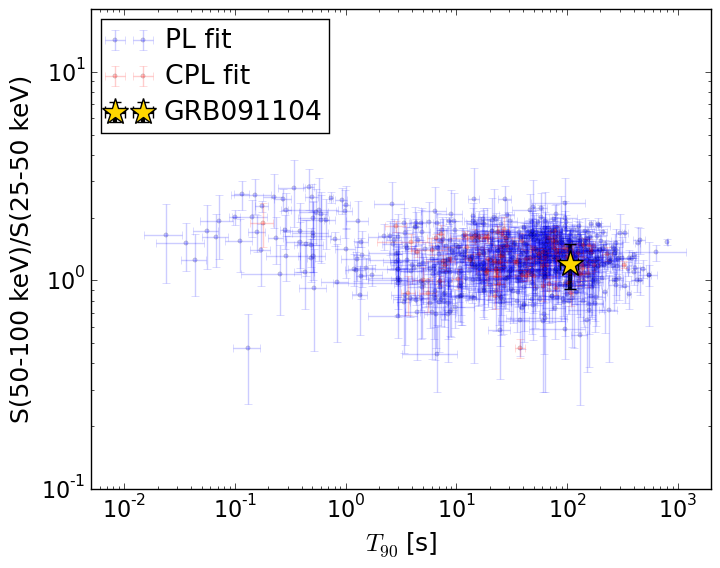
T90                                   = 107.136 sec.
Hardness ratio (energy fluence ratio) = 1.20226408813
S(15-50 keV) vs. S(50-150 keV) plot
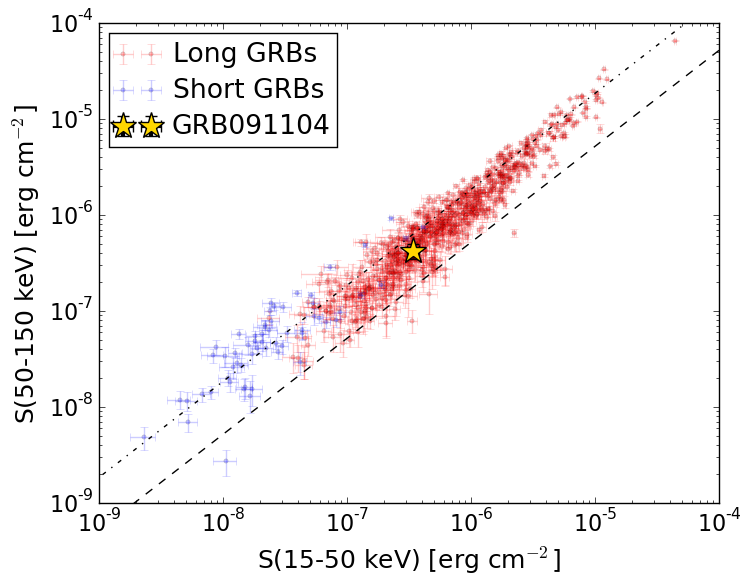
S(15-50 keV)  = 3.402873e-07
S(50-150 keV) = 4.213274e-07
The dash-dotted line and the dashed line traces the fluences calculated from the Band function with Epeak = 15 and 150 keV, respectively. Both lines assume a canonical values of alpha = -1 and beta = -2.5.
Mask shadow pattern
IMX = -2.646494126456019E-01, IMY = 2.970982505726540E-01
Spacecraft aspect plot
Bright source in the pre-burst/pre-slew/post-slew images
Pre-burst image of 15-350 keV band
Time interval of the image:
-138.099410 -1.480000

# RAcent  DECcent POSerr Theta    Phi  PeakCts   SNR AngSep     Name
#  [deg]    [deg]    ['] [deg]  [deg]                   [']
145.0597   2.3387    2.6  55.1    0.1   2.2305   4.4 ------	UNKNOWN
Pre-slew background subtracted image of 15-350 keV band
Time interval of the image:
-1.480000 73.500600

# RAcent  DECcent POSerr Theta    Phi  PeakCts   SNR AngSep     Name
#  [deg]    [deg]    ['] [deg]  [deg]                   [']
167.7263  31.4825    2.3  20.4  -18.5   0.4979   5.0 ------	UNKNOWN
208.7263  47.3910    1.5  21.7 -131.7   0.9175   7.6 ------	UNKNOWN
Post-slew image of 15-350 keV band
Time interval of the image:
120.300590 483.067200
661.000000 723.088800
841.000000 903.084100

# RAcent  DECcent POSerr Theta    Phi  PeakCts   SNR AngSep     Name
#  [deg]    [deg]    ['] [deg]  [deg]                   [']
254.6083  35.4354    6.4  35.8 -165.6   0.6653   1.8    9.2	Her X-1
143.0267  39.6708    3.3  46.8   27.8   2.9501   3.6 ------	UNKNOWN
156.3635  45.1356    2.6  35.6   28.2   1.8455   4.5 ------	UNKNOWN
259.4216  11.8119    3.1  55.2 -145.3   8.1710   3.7 ------	UNKNOWN