Analysis Summary
Notes:
- 1) No attempt has been made to eliminate the non-significant decimal places.
- 2) This batgrbproduct analysis is done using the HEASARC data.
- 3) This batgrbproduct analysis is using the flight position for the mask-weighting calculation.
======================================================================
BAT GRB EVENT DATA PROCESSING REPORT
Process Script Ver: batgrbproduct v2.46
Process Start Time: Sun Jan 19 12:56:25 EST 2014
Host Name: batevent1
Current Working Dir: /local/data/batevent/batevent_reproc/trigger375246
======================================================================
Trigger: 00375246 Segment: 000
BAT Trigger Time: 279435468.608 [s; MET]
Trigger Stop: 279435484.992 [s; MET]
UTC: 2009-11-09T04:57:43.363760 [includes UTCF correction]
Where From?: TDRSS position message
BAT
RA: 309.264961145751 Dec: -44.1765036048656 [deg; J2000]
Catalogged Source?: NO
Point Source?: YES
GRB Indicated?: YES [ by BAT flight software ]
Image S/N Ratio: 7.64
Image Trigger?: NO
Rate S/N Ratio: 13.5277492584687 [ if not an image trigger ]
Image S/N Ratio: 7.64
Analysis Position: [ source = BAT ]
RA: 309.264961145751 Dec: -44.1765036048656 [deg; J2000]
Refined Position: [ source = BAT pre-slew burst ]
RA: 309.252520677822 Dec: -44.1774300469834 [deg; J2000]
{ 20h 37m 00.6s , -44d 10' 38.7" }
+/- 2.09299540506235 [arcmin] (estimated 90% radius based on SNR)
+/- 1.09865328435654 [arcmin] (formal 1-sigma fit error)
SNR: 10.5895617528812
Angular difference between the analysis and refined position is 0.538210 arcmin
Partial Coding Fraction: 0.1972656 [ including projection effects ]
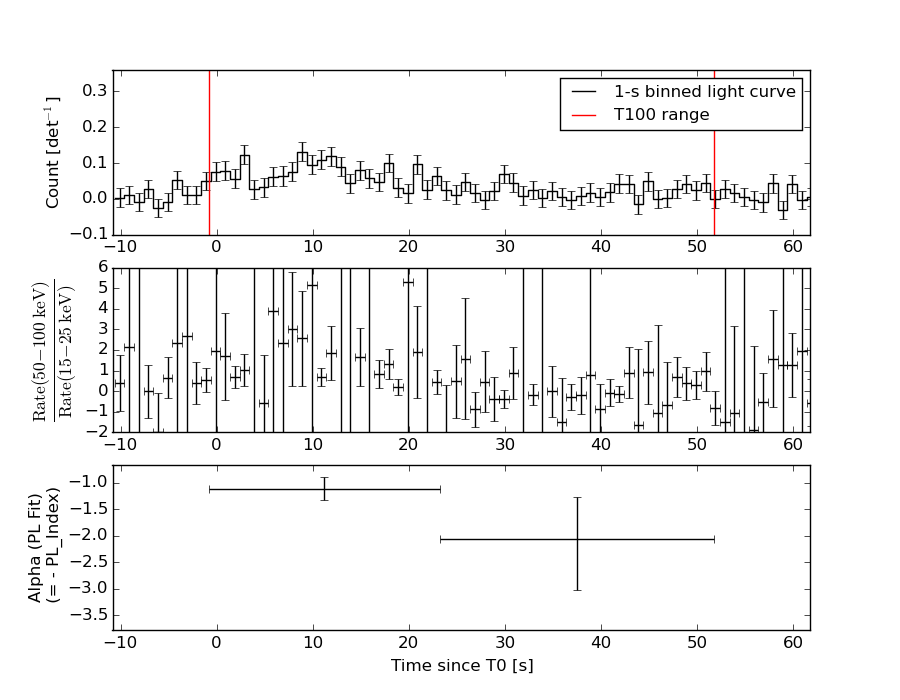
Duration
T90: 48.0320000648499 +/- 16.9502235222856
Measured from: 0.407999992370605
to: 48.4400000572205 [s; relative to TRIGTIME]
T50: 15.1520000696182 +/- 8.93454955460532
Measured from: 7.87999999523163
to: 23.0320000648499 [s; relative to TRIGTIME]
Fluence
Peak Flux (peak 1 second)
Measured from: 8.2039999961853
to: 9.2039999961853 [s; relative to TRIGTIME]
Total Fluence
Measured from: -0.839999973773956
to: 51.7520000338554 [s; relative to TRIGTIME]
Band 1 Band 2 Band 3 Band 4
15-25 25-50 50-100 100-350 keV
Total 0.557170 0.779658 0.692264 0.325297
0.104882 0.104663 0.088659 0.075500 [error]
Peak 0.021632 0.058814 0.046209 0.028349
0.014465 0.014648 0.012649 0.010496 [error]
[ fluence units of on-axis counts / fully illuminated detector ]
======================================================================
====== Table of the duration information =============================
Value tstart tstop
T100 52.592 -0.840 51.752
T90 48.032 0.408 48.440
T50 15.152 7.880 23.032
Peak 1.000 8.204 9.204
====== Spectral Analysis Summary =====================================
Model : spectral model: simple power-law (PL) and cutoff power-law (CPL)
Ph_index : photon index: E^{Ph_index}
Ph_90err : 90% error of the photon index
Epeak : Epeak in keV
Epeak_90err: 90% error of Epeak
Norm : normalization at 50 keV in both the PL model and CPL model
Nomr_90err : 90% error of the normalization
chi2 : Chi-Squared
dof : degree of freedo
=== Time-averaged spectral analysis ===
(Best model with acceptable fit: PL)
Model Ph_index Ph_90err_low Ph_90err_hi Epeak Epeak_90err_low Epeak_90err_hi Norm Nomr_90err_low Norm_90err_hi chi2 dof
PL -1.306 -0.245 0.254 - - - 3.16e-03 -4.16e-04 4.13e-04 60.550 57
CPL -1.318 -1.613 0.352 9999.360 N/A N/A 3.16e-03 N/A N/A 60.590 56
=== 1-s peak spectral analysis ===
(Best model with acceptable fit: PL)
Model Ph_index Ph_90err_low Ph_90err_hi Epeak Epeak_90err_low Epeak_90err_hi Norm Nomr_90err_low Norm_90err_hi chi2 dof
PL -1.358 -0.525 0.558 - - - 1.02e-02 -2.98e-03 2.97e-03 60.540 57
CPL -1.251 1.251 1.854 375.151 N/A N/A 1.14e-02 N/A N/A 60.560 56
=== Fluence/Peak Flux Summary ===
Model Band1 Band2 Band3 Band4 Band5 Total
15-25 25-50 50-100 100-350 15-150 15-350 keV
Fluence PL 1.77e-07 3.66e-07 5.92e-07 2.15e-06 1.64e-06 3.28e-06 erg/cm2
90%_error_low -4.80e-08 -6.15e-08 -8.76e-08 -6.64e-07 -2.19e-07 -7.12e-07 erg/cm2
90%_error_hi 5.26e-08 5.94e-08 8.58e-08 8.55e-07 2.20e-07 8.65e-07 erg/cm2
Peak flux PL 3.65e-01 4.00e-01 3.12e-01 4.00e-01 1.23e+00 1.48e+00 ph/cm2/s
90%_error_low -1.94e-01 -1.49e-01 -1.03e-01 -2.22e-01 -3.90e-01 -4.30e-01 ph/cm2/s
90%_error_hi 2.38e-01 1.42e-01 9.96e-02 3.49e-01 3.97e-01 4.30e-01 ph/cm2/s
Fluence CPL 1.77e-07 3.66e-07 5.92e-07 2.19e-06 1.65e-06 3.25e-06 erg/cm2
90%_error_low -4.83e-08 -6.15e-08 N/A -1.09e-06 -2.25e-07 -9.09e-07 erg/cm2
90%_error_hi 5.25e-08 5.93e-08 N/A 9.16e-07 2.14e-07 8.37e-07 erg/cm2
Peak flux CPL 3.67e-01 3.98e-01 3.10e-01 4.22e-01 1.23e+00 1.50e+00 ph/cm2/s
90%_error_low -2.17e-01 -1.47e-01 -1.02e-01 N/A -4.05e-01 -4.59e-01 ph/cm2/s
90%_error_hi 2.33e-01 1.58e-01 1.84e-01 N/A 3.95e-01 4.01e-01 ph/cm2/s
======================================================================
Image
Pre-slew 15.0-350.0 keV image (Event data)
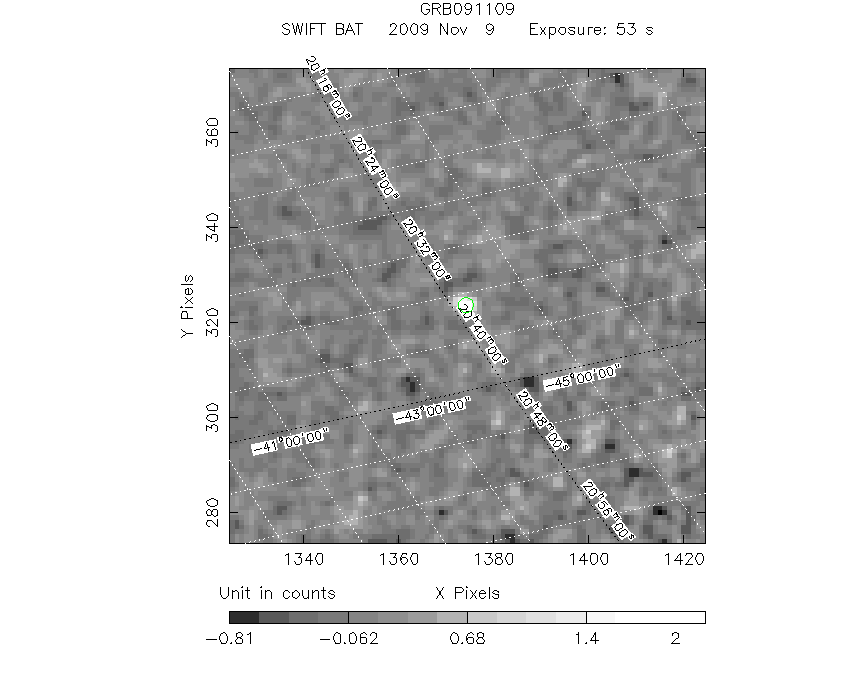
#   RAcent    DECcent   POSerr    Theta     Phi              Peak Cts       SNR   Name
  309.2525   -44.1774   0.0182    47.4042   162.8163         2.3124980     10.590 TRIG_00375246

Foreground time interval of the image:
 -0.840  51.752 (delta_t =  52.592 [sec])
Background time interval of the image:
-239.608  -0.840 (delta_t = 238.768 [sec])
Light Curves
Note: The mask-weighted lightcurves have units of either count/det or counts/sec/det, where a det is 0.4 x 0.4 = 0.16 sq cm.
Full-time range; 1 s binning
Other quick-look light curves:
- 64 ms binning (zoomed)
- 16 ms binning (zoomed)
- 8 ms binning (zoomed)
- 2 ms binning (zoomed)
- SN=5 or 10 s binning (full-time range)
- Raw light curve
Spectra
- 64 ms binning (zoomed)
- 16 ms binning (zoomed)
- 8 ms binning (zoomed)
- 2 ms binning (zoomed)
- SN=5 or 10 s binning (full-time range)
- Raw light curve
Spectra
Notes:
- 1) The fitting includes the systematic errors.
- 2) When the burst includes telescope slew time periods, the fitting uses an average response file made from multiple 5-s response files through out the slew time plus single time preiod for the non-slew times, and weighted by the total counts in the corresponding time period using addrmf. An average response file is needed becuase a spectral fit using the pre-slew DRM will introduce some errors in both a spectral shape and a normalization if the PHA file contains a lot of the slew/post-slew time interval.
- 3) For fits to more complicated models (e.g. a power-law over a cutoff power-law), the BAT team has decided to require a chi-square improvement of more than 6 for each extra dof.
Time averaged spectrum fit using the average DRM
Power-law model
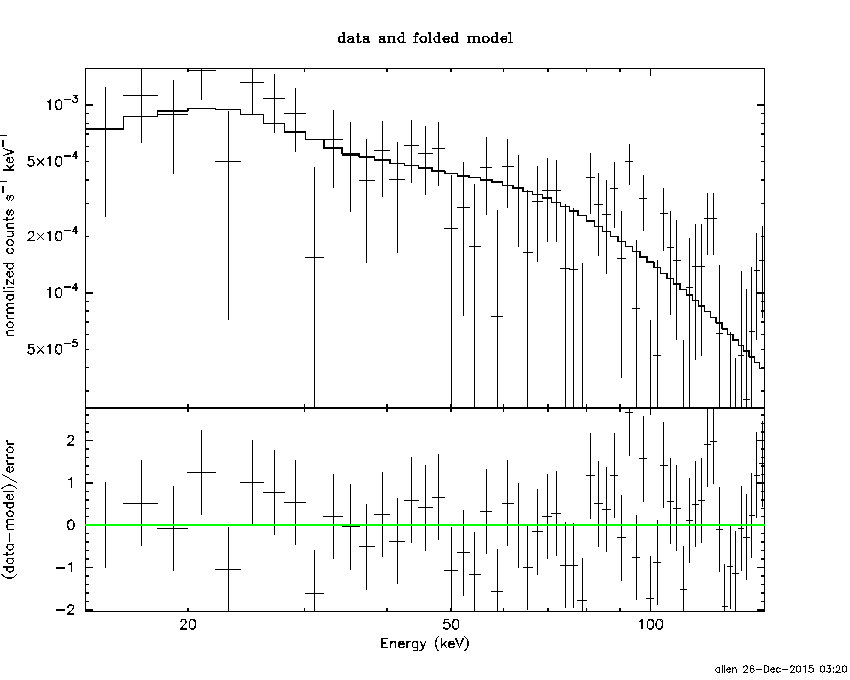
Time interval is from   -0.840 sec. to   51.752 sec.

Spectral model in power-law:
------------------------------------------------------------
Parameters  : value       lower 90%   higher 90%
Photon index: -1.30624     ( -0.245172   0.254288 )
Norm@50keV  : 3.16003E-03    ( -0.000415803   0.000413227 )
------------------------------------------------------------
#Fit statistic : Chi-Squared =          60.55 using 59 PHA bins.
# Reduced chi-squared =          1.062 for     57 degrees of freedom
# Null hypothesis probability =   3.489874e-01

Photon flux (15-150 keV)    in 52.59 sec: 0.377440 ( -0.055098  0.055537 ) ph/cm2/s
Energy fluence (15-150 keV)             : 1.63992e-06 ( -2.1932e-07  2.19605e-07 ) ergs/cm2
Cutoff power-law model
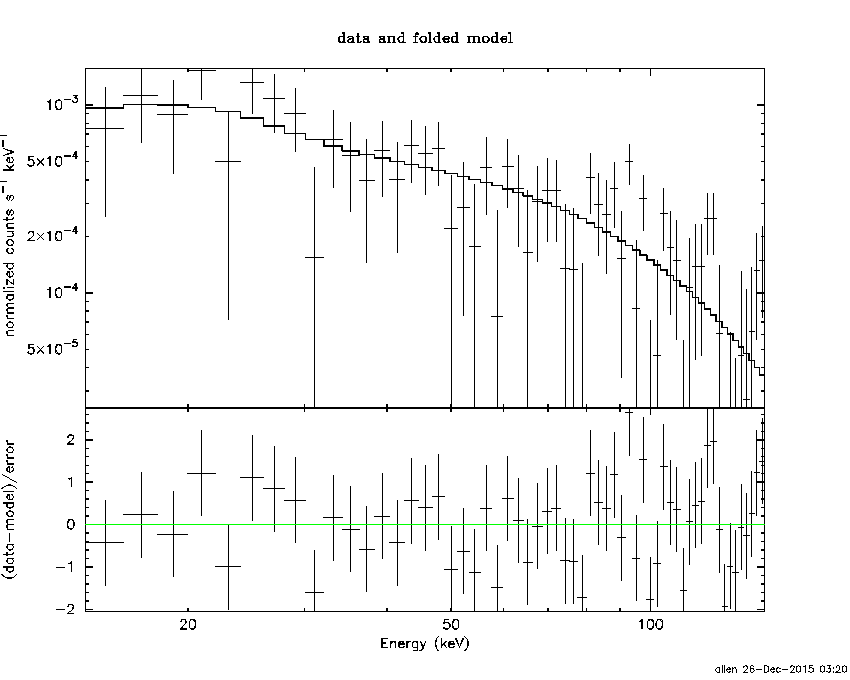
Time interval is from   -0.840 sec. to   51.752 sec.
Spectral model in the cutoff power-law:
------------------------------------------------------------
Parameters  : value       lower 90%   higher 90%
Photon index: -2.17276     ( -0.758243   1.20683 )
Epeak [keV] : 63.9331      (   )
Norm@50keV  : 9.18171E-04    (     )
------------------------------------------------------------
#Fit statistic : Chi-Squared =          59.87 using 59 PHA bins.
# Reduced chi-squared =          1.069 for     56 degrees of freedom
# Null hypothesis probability =   3.370578e-01

Photon flux (15-150 keV)    in 52.59 sec: 0.377431 ( -0.055148  0.055499 ) ph/cm2/s
Energy fluence (15-150 keV)             : 1.64522e-06 ( -2.25036e-07  2.13887e-07 ) ergs/cm2
1-s peak spectrum fit
Power-law model
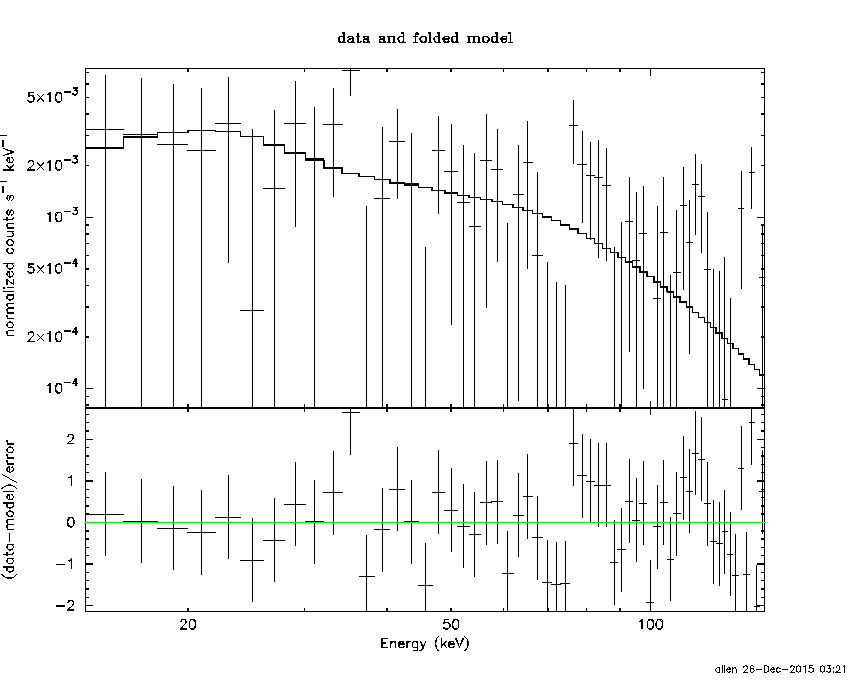
Time interval is from    8.204 sec. to    9.204 sec.

Spectral model in power-law:
------------------------------------------------------------
Parameters  : value       lower 90%   higher 90%
Photon index: -1.35843     ( -0.524517   0.558068 )
Norm@50keV  : 1.01567E-02    ( -0.00298279   0.00296745 )
------------------------------------------------------------
#Fit statistic : Chi-Squared =          60.54 using 59 PHA bins.
# Reduced chi-squared =          1.062 for     57 degrees of freedom
# Null hypothesis probability =   3.494930e-01

Photon flux (15-150 keV)    in 1 sec: 1.22575 ( -0.390432  0.3973 ) ph/cm2/s
Energy fluence (15-150 keV)             : 9.90239e-08 ( -2.98806e-08  3.00564e-08 ) ergs/cm2
Cutoff power-law model

Time interval is from    8.204 sec. to    9.204 sec.
Spectral model in the cutoff power-law:
------------------------------------------------------------
Parameters  : value       lower 90%   higher 90%
Photon index: -3.18195     ( 3.17314   3.77641 )
Epeak [keV] : 326.621      (   )
Norm@50keV  : 9.16063E-04    (     )
------------------------------------------------------------
#Fit statistic : Chi-Squared =          60.12 using 59 PHA bins.
# Reduced chi-squared =          1.074 for     56 degrees of freedom
# Null hypothesis probability =   3.289239e-01

Photon flux (15-150 keV)    in 1 sec: 1.22927 ( -0.405184  0.39524 ) ph/cm2/s
Energy fluence (15-150 keV)             : 9.92773e-08 ( -3.24629e-08  2.78269e-08 ) ergs/cm2
Time-resolved spectra
Distribution
T90 vs. Hardness ratio plot
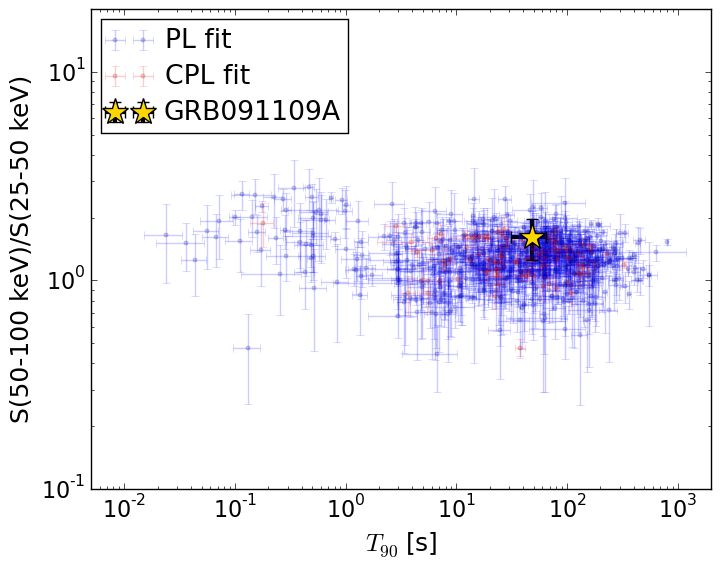
T90                                   = 48.032 sec.
Hardness ratio (energy fluence ratio) = 1.6175218762
S(15-50 keV) vs. S(50-150 keV) plot
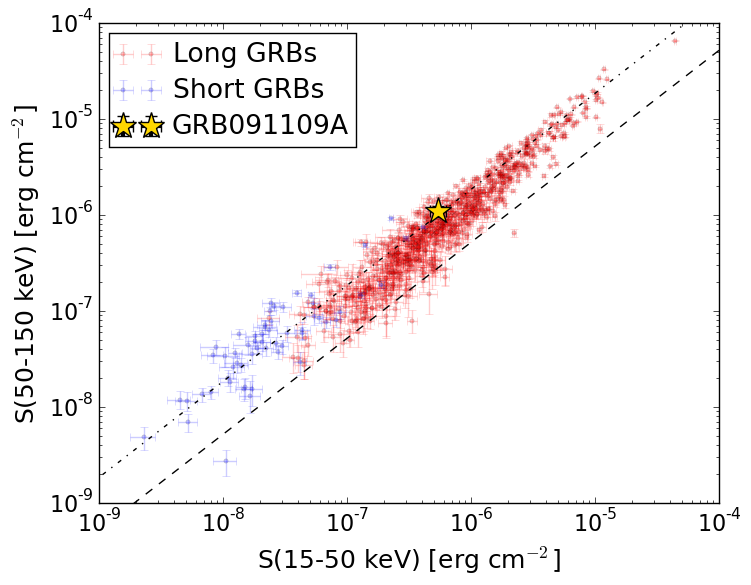
S(15-50 keV)  = 5.433047e-07
S(50-150 keV) = 1.0966102e-06
The dash-dotted line and the dashed line traces the fluences calculated from the Band function with Epeak = 15 and 150 keV, respectively. Both lines assume a canonical values of alpha = -1 and beta = -2.5.
Mask shadow pattern
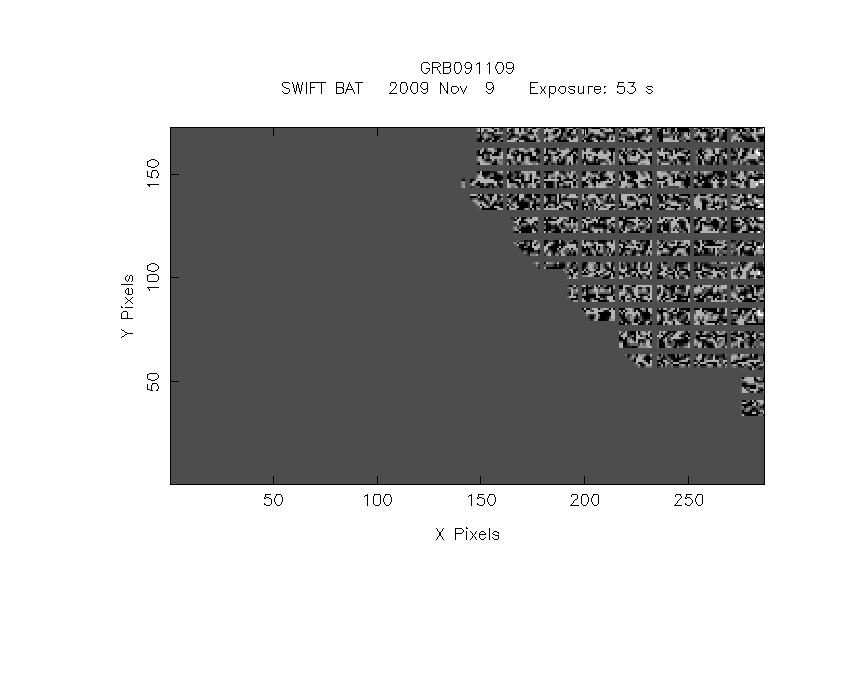
IMX = -1.039103341736319E+00, IMY = -3.213317189307310E-01
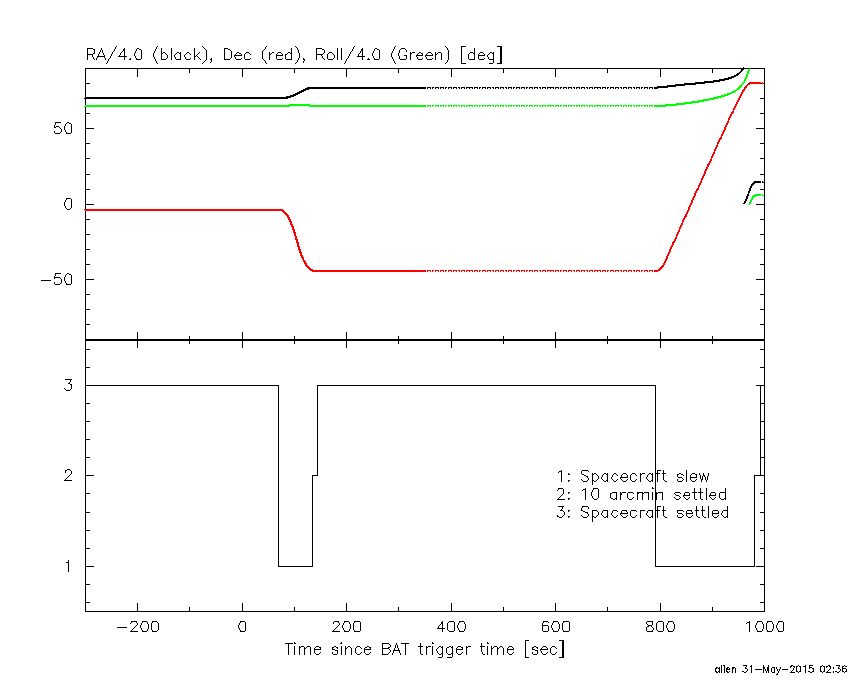
Spacecraft aspect plot
Bright source in the pre-burst/pre-slew/post-slew images
Pre-burst image of 15-350 keV band
Time interval of the image:
-239.608000 -0.840000

# RAcent  DECcent POSerr Theta    Phi  PeakCts   SNR AngSep     Name
#  [deg]    [deg]    ['] [deg]  [deg]                   [']
244.9770 -15.6503    0.7  37.4 -100.8   8.3701  15.6    0.6	Sco X-1
254.5019  35.3677    2.2  46.4  -20.1   2.3577   5.3    2.6	Her X-1
256.0620 -37.7879    8.0  41.0 -139.2   0.5264   1.4    4.9	4U 1700-377
256.2874 -36.5046    5.5  39.9 -138.1  -0.7222  -2.1    8.7	GX 349+2
262.9731 -24.7435    1.8  27.3 -131.8   1.6844   6.4    2.0	GX 1+4
264.9519 -44.5922   17.0  43.2 -153.0  -0.2398  -0.7   12.4	4U 1735-44
268.4083  -1.4099    3.0  12.9  -69.5   0.7722   3.9    3.5	SW J1753.5-0127
270.2870 -25.0634    2.7  23.7 -144.8   0.9035   4.3    1.0	GX 5-1
270.3622 -25.7898    3.1  24.3 -145.8   0.7790   3.8    4.3	GRS 1758-258
273.9395 -14.0026    2.9  12.4 -135.7   0.7416   4.0    4.4	GX 17+2
276.0548 -30.2307    4.5  26.9 -160.2   0.5563   2.6   10.6	H1820-303
284.9754 -24.8595    4.3  21.4 -179.5   0.5661   2.7    4.9	HT1900.1-2455
288.7942  10.9415    0.5  16.6   37.6   4.9533  23.1    0.3	GRS 1915+105
299.6065  35.1927    0.8  42.7   32.7   6.6648  15.1    1.0	Cyg X-1
262.8460 -33.8992   13.0  34.6 -142.6  -0.2245  -0.9    8.1	GX 354-0
314.0305 -43.3670    2.4  49.2  158.7   3.2621   4.9 ------	UNKNOWN
277.4410 -54.2648    3.6  50.6 -167.0   1.4865   3.2 ------	UNKNOWN
268.0519 -22.3357    0.5  22.4 -136.7   4.5234  21.9 ------	UNKNOWN
Pre-slew background subtracted image of 15-350 keV band
Time interval of the image:
-0.840000 51.752000

# RAcent  DECcent POSerr Theta    Phi  PeakCts   SNR AngSep     Name
#  [deg]    [deg]    ['] [deg]  [deg]                   [']
244.9728 -15.5200    7.8  37.4 -100.6   0.3071   1.5    7.2	Sco X-1
254.3820  35.3024    8.9  46.4  -20.2   0.2273   1.3    4.4	Her X-1
255.9370 -37.9758   21.5  41.2 -139.2   0.0809   0.5    8.2	4U 1700-377
256.3212 -36.5497    3.8  39.9 -138.2   0.4306   3.0    9.4	GX 349+2
262.9257 -24.7539    3.6  27.3 -131.7  -0.3187  -3.2    4.6	GX 1+4
264.7509 -44.4845  370.1  43.2 -152.7  -0.0047  -0.0    2.1	4U 1735-44
268.2174  -1.4579    4.8  13.1  -69.9   0.2019   2.4    9.0	SW J1753.5-0127
270.4428 -25.0781    9.0  23.6 -145.1   0.1159   1.3    8.6	GX 5-1
270.4570 -25.7195    6.1  24.2 -145.9  -0.1709  -1.9    8.5	GRS 1758-258
273.8731 -14.1624   49.4  12.6 -135.8  -0.0186  -0.2   10.8	GX 17+2
276.0913 -30.4996   10.6  27.1 -160.3   0.0975   1.1   11.7	H1820-303
284.8921 -24.9802   11.3  21.5 -179.2   0.0836   1.0    8.6	HT1900.1-2455
288.9140  10.8133   84.2  16.5   38.2  -0.0124  -0.1   10.5	GRS 1915+105
299.5851  35.2816   11.3  42.7   32.6   0.1962   1.0    4.8	Cyg X-1
263.1316 -33.7305    6.5  34.3 -142.7   0.1915   1.8    9.5	GX 354-0
309.2525 -44.1774    1.1  47.4  162.8   2.3119  10.6 ------	UNKNOWN
304.4269 -48.0941    2.0  48.6  169.5   1.2366   5.7 ------	UNKNOWN
281.7239 -32.6978    2.0  28.9 -170.9   0.4902   5.7 ------	UNKNOWN
273.7324 -27.0091    2.3  24.3 -153.7   0.4050   4.9 ------	UNKNOWN
Post-slew image of 15-350 keV band
Time interval of the image:
134.692600 790.392600

# RAcent  DECcent POSerr Theta    Phi  PeakCts   SNR AngSep     Name
#  [deg]    [deg]    ['] [deg]  [deg]                   [']
256.1101 -37.7655    9.1  39.9  -90.8   2.0286   1.3    7.5	4U 1700-377
256.2038 -36.4581    0.0  40.5  -88.9   0.0331   0.0   11.4	GX 349+2
263.0722 -24.6383    5.7  42.1  -69.0   3.4209   2.0    7.3	GX 1+4
264.8221 -44.4876   12.2  31.4  -97.5   0.5495   0.9    4.1	4U 1735-44
270.2760 -25.0966    2.4  36.8  -62.9   3.3948   4.8    1.1	GX 5-1
270.4512 -25.7989    5.8  36.3  -63.6   1.3906   2.0    8.7	GRS 1758-258
274.0915 -14.1676    9.2  42.3  -47.0   0.9979   1.3    9.3	GX 17+2
275.9619 -30.3830    4.0  29.6  -64.6   1.4073   2.9    2.1	H1820-303
285.1955 -24.9111   13.2  27.4  -44.4   0.3351   0.9    8.7	HT1900.1-2455
288.8070  10.9631    2.2  58.2  -14.8   9.7691   5.4    1.2	GRS 1915+105
263.0949 -33.9910  515.1  36.7  -81.1  -0.0198  -0.0   10.8	GX 354-0
336.3924  -4.3431    2.8  46.4   47.9   7.1733   4.1 ------	UNKNOWN
331.3216  -7.0601    3.3  41.8   43.0   3.2766   3.5 ------	UNKNOWN
 49.2903 -68.6957    3.6  52.9  162.4   5.7250   3.2 ------	UNKNOWN
123.3098 -77.1804    3.0  58.6 -172.5  10.1577   3.8 ------	UNKNOWN
268.0691 -22.3326    0.9  40.2  -61.8  11.4487  12.5 ------	UNKNOWN
253.8675 -38.8564    2.5  41.0  -93.5   7.2186   4.5 ------	UNKNOWN