Analysis Summary
Notes:
- 1) No attempt has been made to eliminate the non-significant decimal places.
- 2) This batgrbproduct analysis is done using the HEASARC data.
- 3) This batgrbproduct analysis is using the flight position for the mask-weighting calculation.
======================================================================
BAT GRB EVENT DATA PROCESSING REPORT
Process Script Ver: batgrbproduct v2.46
Process Start Time: Sun Jan 19 12:52:28 EST 2014
Host Name: batevent1
Current Working Dir: /local/data/batevent/batevent_reproc/trigger375409
======================================================================
Trigger: 00375409 Segment: 000
BAT Trigger Time: 279496148.404 [s; MET]
Trigger Stop: 279496148.468 [s; MET]
UTC: 2009-11-09T21:49:03.157720 [includes UTCF correction]
Where From?: (*SHORT BURST*) TDRSS scaled map message
BAT
RA: 112.716715657691 Dec: -54.0804743571872 [deg; J2000]
Catalogged Source?: NO
Point Source?: YES
GRB Indicated?: YES [ by BAT flight software ]
Image S/N Ratio: 7.05
Image Trigger?: NO
Rate S/N Ratio: 27.7848879788996 [ if not an image trigger ]
Image S/N Ratio: 7.05
Analysis Position: [ source = BAT ]
RA: 112.716715657691 Dec: -54.0804743571872 [deg; J2000]
Refined Position: [ source = BAT pre-slew burst ]
RA: 112.74942082414 Dec: -54.091435916856 [deg; J2000]
{ 07h 30m 59.9s , -54d 05' 29.2" }
+/- 1.19029952048663 [arcmin] (estimated 90% radius based on SNR)
+/- 0.510577794860176 [arcmin] (formal 1-sigma fit error)
SNR: 23.7158126307739
Angular difference between the analysis and refined position is 1.325685 arcmin
Partial Coding Fraction: 0.7578125 [ including projection effects ]
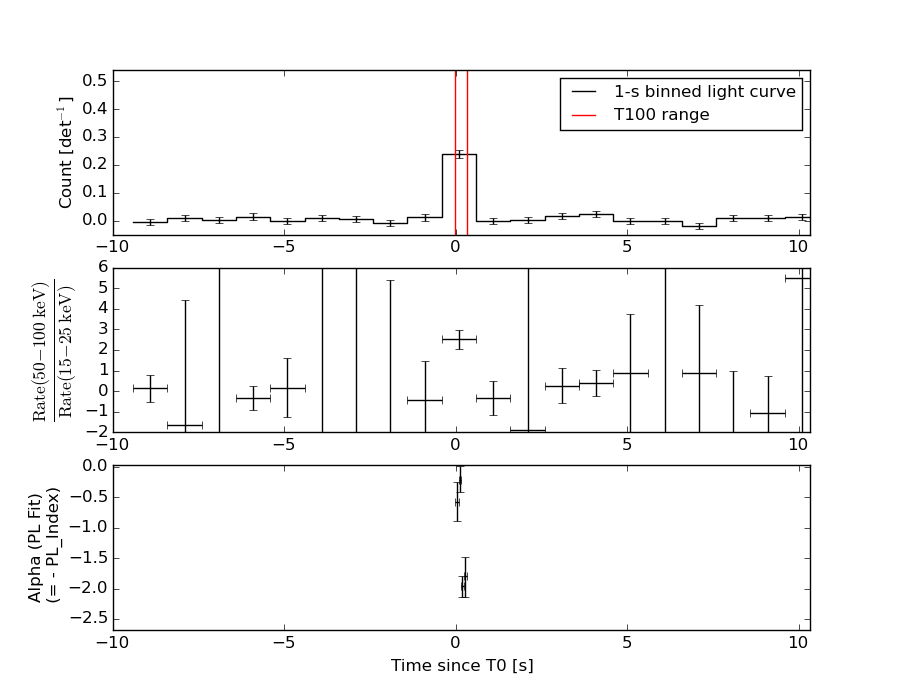
Duration
T90: 0.271999955177307 +/- 0.0468187824917992
Measured from: 0.0120000243186951
to: 0.283999979496002 [s; relative to TRIGTIME]
T50: 0.0919999480247498 +/- 0.0282842442734789
Measured from: 0.100000023841858
to: 0.191999971866608 [s; relative to TRIGTIME]
Fluence
Peak Flux (peak 1 second)
Measured from: -0.333999991416931
to: 0.666000008583069 [s; relative to TRIGTIME]
Total Fluence
Measured from: -0.00400000810623169
to: 0.332000017166138 [s; relative to TRIGTIME]
Band 1 Band 2 Band 3 Band 4
15-25 25-50 50-100 100-350 keV
Total 0.032500 0.076578 0.096758 0.038768
0.004394 0.005715 0.006226 0.005627 [error]
Peak 0.039689 0.071589 0.098012 0.035561
0.006512 0.007582 0.007662 0.006861 [error]
[ fluence units of on-axis counts / fully illuminated detector ]
======================================================================
====== Table of the duration information =============================
Value tstart tstop
T100 0.336 -0.004 0.332
T90 0.272 0.012 0.284
T50 0.092 0.100 0.192
Peak 1.000 -0.334 0.666
====== Spectral Analysis Summary =====================================
Model : spectral model: simple power-law (PL) and cutoff power-law (CPL)
Ph_index : photon index: E^{Ph_index}
Ph_90err : 90% error of the photon index
Epeak : Epeak in keV
Epeak_90err: 90% error of Epeak
Norm : normalization at 50 keV in both the PL model and CPL model
Nomr_90err : 90% error of the normalization
chi2 : Chi-Squared
dof : degree of freedo
=== Time-averaged spectral analysis ===
(Best model with acceptable fit: PL)
Model Ph_index Ph_90err_low Ph_90err_hi Epeak Epeak_90err_low Epeak_90err_hi Norm Nomr_90err_low Norm_90err_hi chi2 dof
PL -0.710 -0.128 0.132 - - - 4.77e-02 -3.68e-03 3.65e-03 54.200 57
CPL -0.400 -0.437 0.589 310.465 -310.465 -310.465 6.47e-02 -1.95e-02 4.82e-02 53.200 56
=== 1-s peak spectral analysis ===
(Best model with acceptable fit: PL)
Model Ph_index Ph_90err_low Ph_90err_hi Epeak Epeak_90err_low Epeak_90err_hi Norm Nomr_90err_low Norm_90err_hi chi2 dof
PL -0.768 -0.167 0.175 - - - 1.65e-02 -1.63e-03 1.60e-03 64.590 57
CPL -0.761 -0.168 0.177 9999.310 -9999.310 -9999.310 1.66e-02 -1.53e-03 1.63e-02 64.590 56
=== Fluence/Peak Flux Summary ===
Model Band1 Band2 Band3 Band4 Band5 Total
15-25 25-50 50-100 100-350 15-150 15-350 keV
Fluence PL 9.82e-09 2.94e-08 7.19e-08 4.91e-07 1.95e-07 6.02e-07 erg/cm2
90%_error_low -1.54e-09 -2.85e-09 -5.56e-09 -8.33e-08 -1.55e-08 -8.62e-08 erg/cm2
90%_error_hi 1.63e-09 2.82e-09 5.54e-09 9.55e-08 1.55e-08 9.72e-08 erg/cm2
Peak flux PL 3.38e-01 5.28e-01 6.20e-01 1.41e+00 1.90e+00 2.89e+00 ph/cm2/s
90%_error_low -7.04e-02 -6.96e-02 -5.82e-02 -2.78e-01 -1.80e-01 -3.04e-01 ph/cm2/s
90%_error_hi 7.65e-02 6.86e-02 5.79e-02 3.24e-01 1.81e-01 3.21e-01 ph/cm2/s
Fluence CPL 9.03e-09 3.00e-08 7.47e-08 3.30e-07 1.93e-07 4.44e-07 erg/cm2
90%_error_low -1.98e-09 -3.04e-09 -7.17e-09 -1.54e-07 -1.63e-08 -1.52e-07 erg/cm2
90%_error_hi 1.98e-09 3.10e-09 7.29e-09 2.02e-07 1.61e-08 2.03e-07 erg/cm2
Peak flux CPL 3.38e-01 5.28e-01 6.20e-01 1.40e+00 1.90e+00 2.89e+00 ph/cm2/s
90%_error_low -4.87e-02 -6.24e-02 -5.82e-02 -6.75e-01 -1.86e-01 -7.08e-01 ph/cm2/s
90%_error_hi 7.63e-02 6.90e-02 6.07e-02 3.19e-01 1.80e-01 2.98e-01 ph/cm2/s
======================================================================
Image
Pre-slew 15.0-350.0 keV image (Event data)
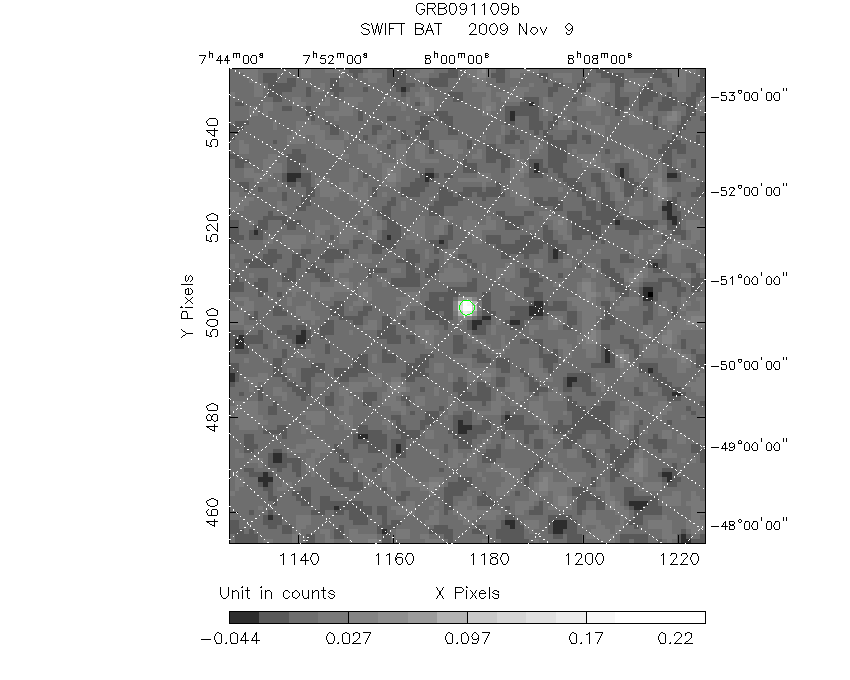
#   RAcent    DECcent   POSerr    Theta     Phi              Peak Cts       SNR   Name
  112.7494   -54.0914   0.0081    31.9575  -174.8748         0.2720716     23.716 TRIG_00375409

Foreground time interval of the image:
 -0.004   0.332 (delta_t =   0.336 [sec])
Background time interval of the image:
-239.404  -0.004 (delta_t = 239.400 [sec])
Light Curves
Note: The mask-weighted lightcurves have units of either count/det or counts/sec/det, where a det is 0.4 x 0.4 = 0.16 sq cm.
Full-time range; 1 s binning
Other quick-look light curves:
Spectra
Notes:
- 1) The fitting includes the systematic errors.
- 2) When the burst includes telescope slew time periods, the fitting uses an average response file made from multiple 5-s response files through out the slew time plus single time preiod for the non-slew times, and weighted by the total counts in the corresponding time period using addrmf. An average response file is needed becuase a spectral fit using the pre-slew DRM will introduce some errors in both a spectral shape and a normalization if the PHA file contains a lot of the slew/post-slew time interval.
- 3) For fits to more complicated models (e.g. a power-law over a cutoff power-law), the BAT team has decided to require a chi-square improvement of more than 6 for each extra dof.
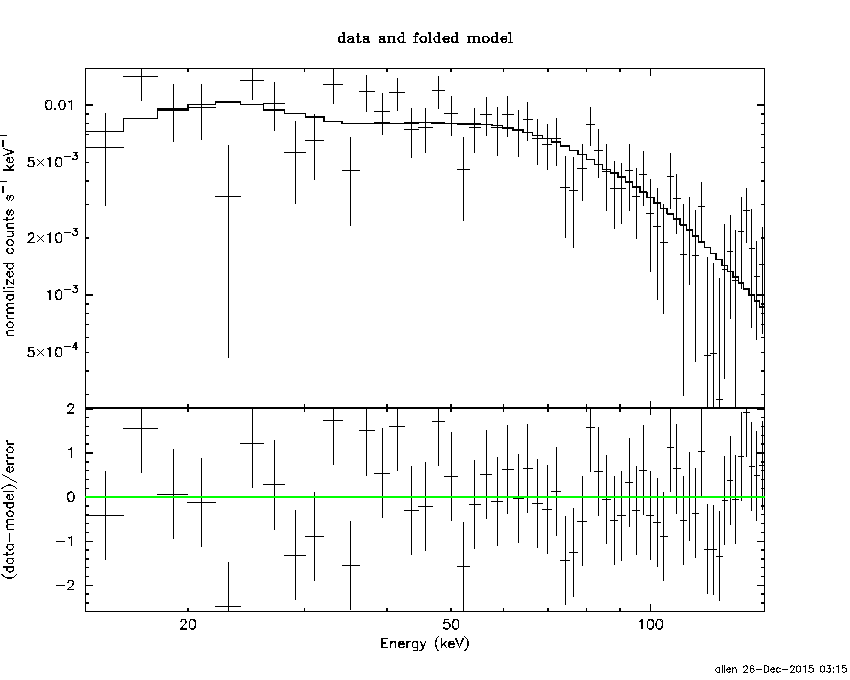
Time averaged spectrum fit using the average DRM
Power-law model

Time interval is from   -0.004 sec. to    0.332 sec.

Spectral model in power-law:
------------------------------------------------------------
Parameters  : value       lower 90%   higher 90%
Photon index: -0.710257     ( -0.127783   0.131777 )
Norm@50keV  : 4.76927E-02    ( -0.00367889   0.00364937 )
------------------------------------------------------------
#Fit statistic : Chi-Squared =          54.20 using 59 PHA bins.
# Reduced chi-squared =         0.9509 for     57 degrees of freedom
# Null hypothesis probability =   5.806898e-01

Photon flux (15-150 keV)    in 0.336 sec: 5.50843 ( -0.40852  0.40888 ) ph/cm2/s
Energy fluence (15-150 keV)             : 1.94724e-07 ( -1.54613e-08  1.55278e-08 ) ergs/cm2
Cutoff power-law model
Time interval is from   -0.004 sec. to    0.332 sec.
Spectral model in the cutoff power-law:
------------------------------------------------------------
Parameters  : value       lower 90%   higher 90%
Photon index: -0.399877     ( -0.436714   0.589152 )
Epeak [keV] : 310.465      ( -310.473 -310.473 )
Norm@50keV  : 6.47158E-02    ( -0.0194969   0.0482301 )
------------------------------------------------------------
#Fit statistic : Chi-Squared =          53.20 using 59 PHA bins.
# Reduced chi-squared =         0.9500 for     56 degrees of freedom
# Null hypothesis probability =   5.816291e-01

Photon flux (15-150 keV)    in 0.336 sec: 5.46140 ( -0.4174  0.41654 ) ph/cm2/s
Energy fluence (15-150 keV)             : 1.92601e-07 ( -1.62984e-08  1.60924e-08 ) ergs/cm2
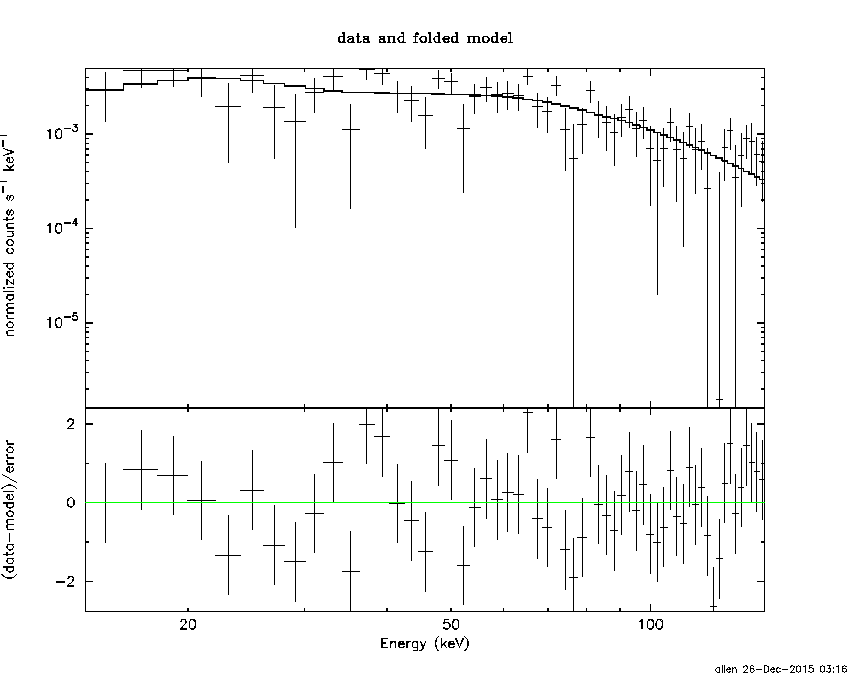
1-s peak spectrum fit
Power-law model

Time interval is from   -0.334 sec. to    0.666 sec.

Spectral model in power-law:
------------------------------------------------------------
Parameters  : value       lower 90%   higher 90%
Photon index: -0.768475     ( -0.16731   0.174528 )
Norm@50keV  : 1.64925E-02    ( -0.00162752   0.00160429 )
------------------------------------------------------------
#Fit statistic : Chi-Squared =          64.59 using 59 PHA bins.
# Reduced chi-squared =          1.133 for     57 degrees of freedom
# Null hypothesis probability =   2.286291e-01

Photon flux (15-150 keV)    in 1 sec: 1.89803 ( -0.18011  0.18077 ) ph/cm2/s
Energy fluence (15-150 keV)             : 1.95348e-07 ( -1.89962e-08  1.90941e-08 ) ergs/cm2
Cutoff power-law model
Time interval is from   -0.334 sec. to    0.666 sec.
Spectral model in the cutoff power-law:
------------------------------------------------------------
Parameters  : value       lower 90%   higher 90%
Photon index: -0.761229     ( -0.168464   0.176466 )
Epeak [keV] : 9999.31      ( -9999.32 -9999.32 )
Norm@50keV  : 1.66112E-02    ( -0.00153656   0.0162812 )
------------------------------------------------------------
#Fit statistic : Chi-Squared =          64.59 using 59 PHA bins.
# Reduced chi-squared =          1.153 for     56 degrees of freedom
# Null hypothesis probability =   2.016350e-01

Photon flux (15-150 keV)    in 1 sec: 1.89767 ( -0.1858  0.17986 ) ph/cm2/s
Energy fluence (15-150 keV)             : 6.47814e-09 ( 0  0 ) ergs/cm2
Time-resolved spectra
Distribution
T90 vs. Hardness ratio plot
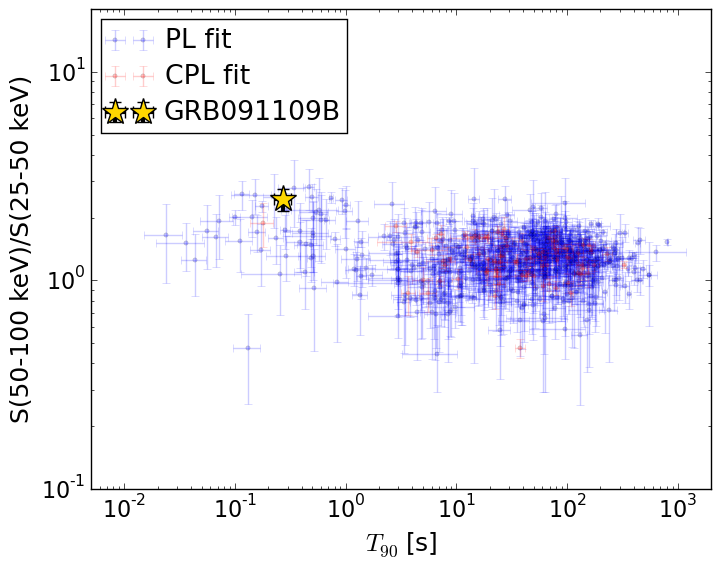
T90                                   = 0.272 sec.
Hardness ratio (energy fluence ratio) = 2.44489394698
S(15-50 keV) vs. S(50-150 keV) plot
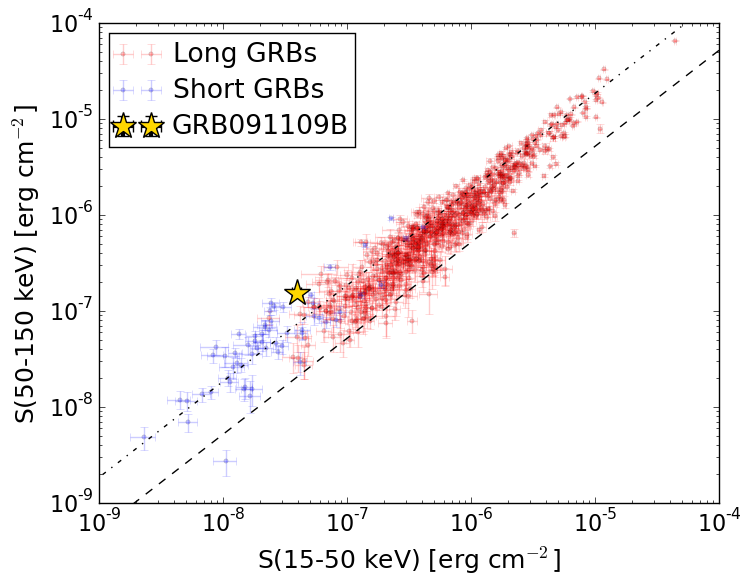
S(15-50 keV)  = 3.9233179e-08
S(50-150 keV) = 1.5549021e-07
The dash-dotted line and the dashed line traces the fluences calculated from the Band function with Epeak = 15 and 150 keV, respectively. Both lines assume a canonical values of alpha = -1 and beta = -2.5.
Mask shadow pattern
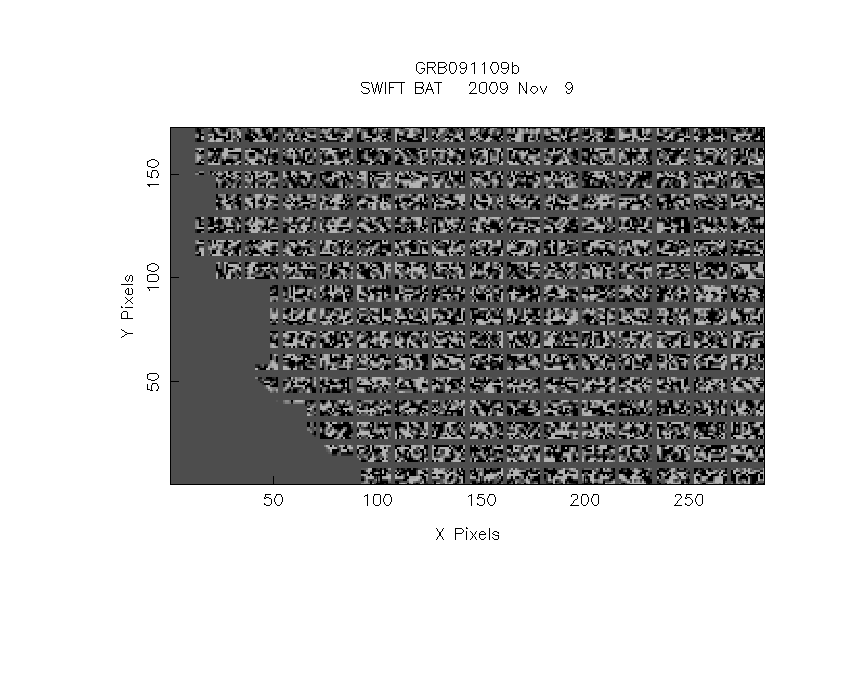
IMX = -6.213440742491267E-01, IMY = 5.572910654887778E-02
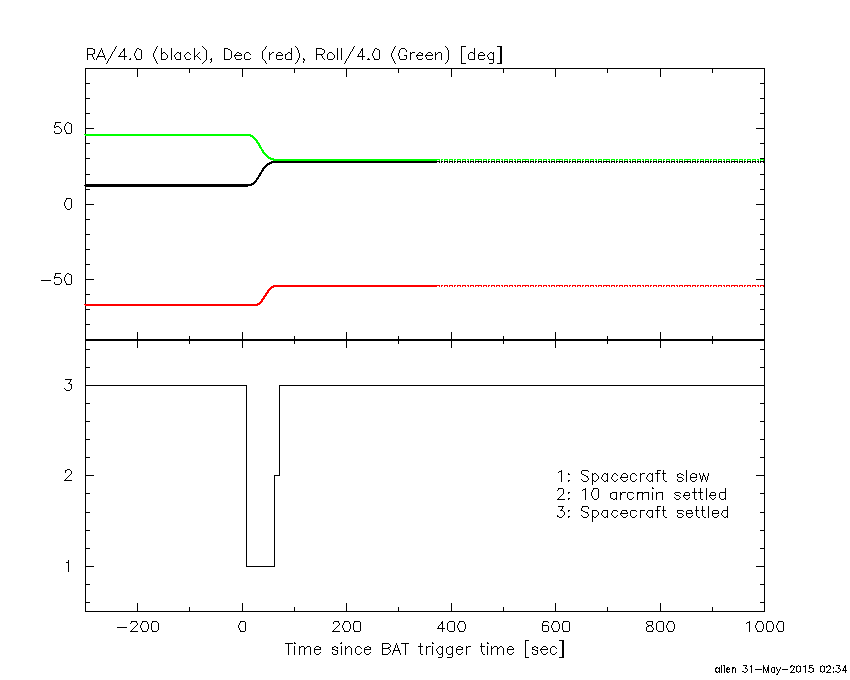
Spacecraft aspect plot
Bright source in the pre-burst/pre-slew/post-slew images
Pre-burst image of 15-350 keV band
Time interval of the image:
-239.404000 -0.004000

# RAcent  DECcent POSerr Theta    Phi  PeakCts   SNR AngSep     Name
#  [deg]    [deg]    ['] [deg]  [deg]                   [']
135.5532 -40.5544    1.4  51.8 -168.0   4.0370   8.0    1.1	Vela X-1
170.5960 -60.5919    8.4  45.7 -129.5   0.8915   1.4    8.5	Cen X-3
116.0482 -47.9734    3.0  38.0 -178.8   0.9571   3.9 ------	UNKNOWN
139.7758 -43.2276    2.4  51.1 -162.8   2.2457   4.9 ------	UNKNOWN
320.7932 -40.5525    2.5  52.9  -21.3   2.2270   4.6 ------	UNKNOWN
Pre-slew background subtracted image of 15-350 keV band
Time interval of the image:
-0.004000 0.332000

# RAcent  DECcent POSerr Theta    Phi  PeakCts   SNR AngSep     Name
#  [deg]    [deg]    ['] [deg]  [deg]                   [']
135.6189 -40.5281   53.3  51.9 -168.0   0.0052   0.2    4.4	Vela X-1
170.2537 -60.7571    5.2  45.5 -129.6  -0.0682  -2.2    8.3	Cen X-3
112.7494 -54.0914    0.5  32.0 -174.9   0.2721  23.7 ------	UNKNOWN
187.1926 -69.7116    2.5  40.6 -114.5   0.1242   4.6 ------	UNKNOWN
292.4982 -60.7538    2.2  44.6  -55.2   0.1841   5.3 ------	UNKNOWN
Post-slew image of 15-350 keV band
Time interval of the image:
62.096640 962.663700

# RAcent  DECcent POSerr Theta    Phi  PeakCts   SNR AngSep     Name
#  [deg]    [deg]    ['] [deg]  [deg]                   [']
135.5125 -40.5611    0.4  20.4 -150.0  14.6829  28.2    0.8	Vela X-1
170.3465 -60.5676    2.5  30.7  -82.1   3.4539   4.6    3.4	Cen X-3
186.6416 -62.7633    3.0  37.4  -74.1   5.9443   3.8    0.6	GX 301-2
 42.9070 -41.5904    3.8  46.4   47.9   6.9562   3.1 ------	UNKNOWN
 22.9112 -61.0408    3.1  44.8   15.7   3.3699   3.8 ------	UNKNOWN
353.5617 -58.9912    3.4  56.8    4.8  10.2064   3.4 ------	UNKNOWN
355.9480 -60.1459    3.7  55.2    5.1   7.3370   3.1 ------	UNKNOWN
 74.9433 -74.9525    3.0  25.5   -6.1   1.9494   3.9 ------	UNKNOWN
140.4742  -1.7463    2.8  57.1 -174.0  10.2911   4.1 ------	UNKNOWN
331.1273 -64.8917    5.3  57.4   -9.5   5.0496   2.2 ------	UNKNOWN
151.7463 -22.7179    2.7  42.9 -149.1   3.7722   4.3 ------	UNKNOWN