Analysis Summary
Notes:
- 1) No attempt has been made to eliminate the non-significant decimal places.
- 2) This batgrbproduct analysis is done using the HEASARC data.
- 3) This batgrbproduct analysis is using the flight position for the mask-weighting calculation.
======================================================================
BAT GRB EVENT DATA PROCESSING REPORT
Process Script Ver: batgrbproduct v2.46
Process Start Time: Sun Jan 19 12:46:51 EST 2014
Host Name: batevent1
Current Working Dir: /local/data/batevent/batevent_reproc/trigger375659
======================================================================
Trigger: 00375659 Segment: 000
BAT Trigger Time: 279740486.336 [s; MET]
Trigger Stop: 279740487.36 [s; MET]
UTC: 2009-11-12T17:41:21.081480 [includes UTCF correction]
Where From?: TDRSS position message
BAT
RA: 257.727967798798 Dec: -36.7151372496385 [deg; J2000]
Catalogged Source?: NO
Point Source?: YES
GRB Indicated?: YES [ by BAT flight software ]
Image S/N Ratio: 7.23
Image Trigger?: NO
Rate S/N Ratio: 15.1986841535707 [ if not an image trigger ]
Image S/N Ratio: 7.23
Analysis Position: [ source = BAT ]
RA: 257.727967798798 Dec: -36.7151372496385 [deg; J2000]
Refined Position: [ source = BAT pre-slew burst ]
RA: 257.752969681431 Dec: -36.7293968879752 [deg; J2000]
{ 17h 11m 00.7s , -36d 43' 45.8" }
+/- 1.4711721705858 [arcmin] (estimated 90% radius based on SNR)
+/- 0.545870116832465 [arcmin] (formal 1-sigma fit error)
SNR: 17.5226220186232
Angular difference between the analysis and refined position is 1.475735 arcmin
Partial Coding Fraction: 0.4023438 [ including projection effects ]
Duration
T90: 17.5199999213219 +/- 3.84835811356733
Measured from: -7.716000020504
to: 9.80399990081787 [s; relative to TRIGTIME]
T50: 7.29999995231628 +/- 1.25232583975832
Measured from: -2.49200004339218
to: 4.8079999089241 [s; relative to TRIGTIME]
Fluence
Peak Flux (peak 1 second)
Measured from: 0.555999994277954
to: 1.55599999427795 [s; relative to TRIGTIME]
Total Fluence
Measured from: -10.5
to: 14.7439999580383 [s; relative to TRIGTIME]
Band 1 Band 2 Band 3 Band 4
15-25 25-50 50-100 100-350 keV
Total 0.504238 0.853667 0.998664 0.497342
0.061682 0.065435 0.062795 0.068612 [error]
Peak 0.033321 0.072643 0.094053 0.048783
0.012286 0.013534 0.013350 0.014105 [error]
[ fluence units of on-axis counts / fully illuminated detector ]
======================================================================
====== Table of the duration information =============================
Value tstart tstop
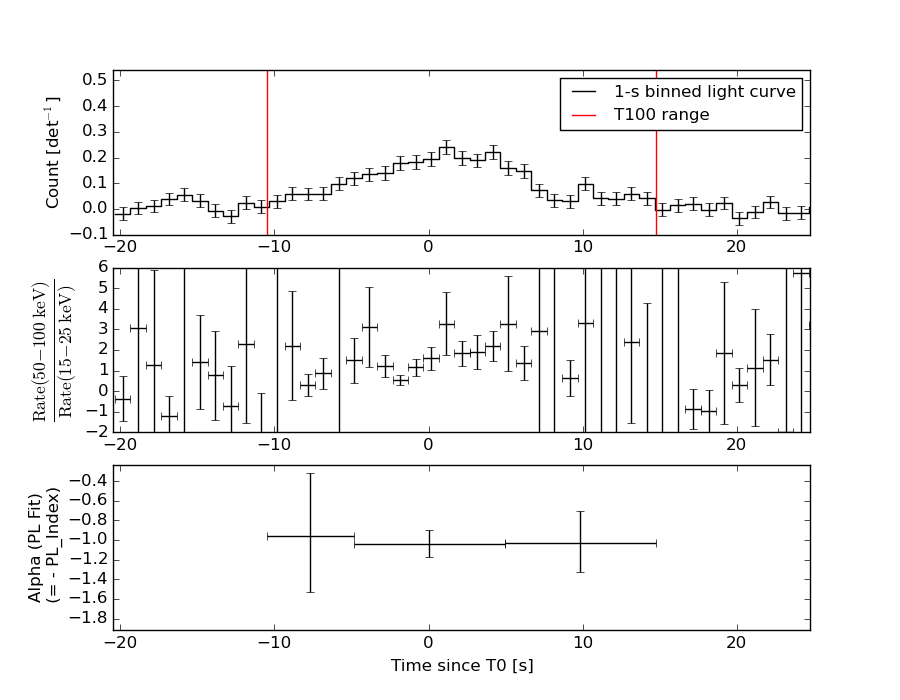
T100 25.244 -10.500 14.744
T90 17.520 -7.716 9.804
T50 7.300 -2.492 4.808
Peak 1.000 0.556 1.556
====== Spectral Analysis Summary =====================================
Model : spectral model: simple power-law (PL) and cutoff power-law (CPL)
Ph_index : photon index: E^{Ph_index}
Ph_90err : 90% error of the photon index
Epeak : Epeak in keV
Epeak_90err: 90% error of Epeak
Norm : normalization at 50 keV in both the PL model and CPL model
Nomr_90err : 90% error of the normalization
chi2 : Chi-Squared
dof : degree of freedo
=== Time-averaged spectral analysis ===
(Best model with acceptable fit: PL)
Model Ph_index Ph_90err_low Ph_90err_hi Epeak Epeak_90err_low Epeak_90err_hi Norm Nomr_90err_low Norm_90err_hi chi2 dof
PL -1.020 -0.135 0.138 - - - 7.71e-03 -5.69e-04 5.67e-04 54.150 57
CPL -0.933 -0.211 0.489 721.564 -721.564 -721.564 8.40e-03 -1.22e-03 4.90e-03 54.200 56
=== 1-s peak spectral analysis ===
(Best model with acceptable fit: PL)
Model Ph_index Ph_90err_low Ph_90err_hi Epeak Epeak_90err_low Epeak_90err_hi Norm Nomr_90err_low Norm_90err_hi chi2 dof
PL -0.911 -0.319 0.340 - - - 1.62e-02 -2.97e-03 2.92e-03 42.480 57
CPL -0.680 -0.529 1.288 344.723 -344.723 -344.723 2.03e-02 -6.43e-03 4.28e-02 42.490 56
=== Fluence/Peak Flux Summary ===
Model Band1 Band2 Band3 Band4 Band5 Total
15-25 25-50 50-100 100-350 15-150 15-350 keV
Fluence PL 1.59e-07 3.92e-07 7.73e-07 3.79e-06 2.09e-06 5.11e-06 erg/cm2
90%_error_low -2.46e-08 -3.66e-08 -6.18e-08 -6.79e-07 -1.62e-07 -7.09e-07 erg/cm2
90%_error_hi 2.61e-08 3.61e-08 6.14e-08 7.85e-07 1.62e-07 8.02e-07 erg/cm2
Peak flux PL 3.81e-01 5.46e-01 5.80e-01 1.14e+00 1.86e+00 2.65e+00 ph/cm2/s
90%_error_low -1.40e-01 -1.32e-01 -1.07e-01 -4.12e-01 -3.38e-01 -5.01e-01 ph/cm2/s
90%_error_hi 1.63e-01 1.29e-01 1.06e-01 5.56e-01 3.41e-01 5.41e-01 ph/cm2/s
Fluence CPL 1.62e-07 4.04e-07 7.76e-07 3.84e-06 2.09e-06 4.81e-06 erg/cm2
90%_error_low -3.97e-08 -3.55e-08 -6.33e-08 -1.97e-06 -1.71e-07 -1.59e-06 erg/cm2
90%_error_hi 1.67e-08 2.89e-08 7.39e-08 3.68e-07 1.62e-07 4.88e-07 erg/cm2
Peak flux CPL 3.69e-01 5.47e-01 5.88e-01 1.03e+00 1.85e+00 2.53e+00 ph/cm2/s
90%_error_low -1.83e-01 -1.34e-01 -1.13e-01 -1.03e+00 -3.53e-01 -8.09e-01 ph/cm2/s
90%_error_hi 1.31e-01 1.34e-01 1.36e-01 4.17e-01 3.47e-01 6.12e-01 ph/cm2/s
======================================================================
Image
Pre-slew 15.0-350.0 keV image (Event data)
#   RAcent    DECcent   POSerr    Theta     Phi              Peak Cts       SNR   Name
  257.7530   -36.7294   0.0110    39.3393  -139.8618         3.1261913     17.523 TRIG_00375659

Foreground time interval of the image:
-10.500  14.744 (delta_t =  25.244 [sec])
Background time interval of the image:
-41.035 -10.500 (delta_t =  30.535 [sec])
Light Curves
Note: The mask-weighted lightcurves have units of either count/det or counts/sec/det, where a det is 0.4 x 0.4 = 0.16 sq cm.
Full-time range; 1 s binning
Other quick-look light curves:
- 64 ms binning (zoomed)
- 16 ms binning (zoomed)
- 8 ms binning (zoomed)
- 2 ms binning (zoomed)
- SN=5 or 10 s binning (full-time range)
- Raw light curve
Spectra
- 64 ms binning (zoomed)
- 16 ms binning (zoomed)
- 8 ms binning (zoomed)
- 2 ms binning (zoomed)
- SN=5 or 10 s binning (full-time range)
- Raw light curve
Spectra
Notes:
- 1) The fitting includes the systematic errors.
- 2) When the burst includes telescope slew time periods, the fitting uses an average response file made from multiple 5-s response files through out the slew time plus single time preiod for the non-slew times, and weighted by the total counts in the corresponding time period using addrmf. An average response file is needed becuase a spectral fit using the pre-slew DRM will introduce some errors in both a spectral shape and a normalization if the PHA file contains a lot of the slew/post-slew time interval.
- 3) For fits to more complicated models (e.g. a power-law over a cutoff power-law), the BAT team has decided to require a chi-square improvement of more than 6 for each extra dof.
Time averaged spectrum fit using the average DRM
Power-law model

Time interval is from  -10.500 sec. to   14.744 sec.

Spectral model in power-law:
------------------------------------------------------------
Parameters  : value       lower 90%   higher 90%
Photon index: -1.01969     ( -0.134648   0.137661 )
Norm@50keV  : 7.70640E-03    ( -0.000569144   0.000566529 )
------------------------------------------------------------
#Fit statistic : Chi-Squared =          54.15 using 59 PHA bins.
# Reduced chi-squared =         0.9499 for     57 degrees of freedom
# Null hypothesis probability =   5.828107e-01

Photon flux (15-150 keV)    in 25.24 sec: 0.888226 ( -0.067432  0.067767 ) ph/cm2/s
Energy fluence (15-150 keV)             : 2.08905e-06 ( -1.6153e-07  1.62331e-07 ) ergs/cm2
Cutoff power-law model
Time interval is from  -10.500 sec. to   14.744 sec.
Spectral model in the cutoff power-law:
------------------------------------------------------------
Parameters  : value       lower 90%   higher 90%
Photon index: -1.01386     ( -0.205843   0.494711 )
Epeak [keV] : 9998.17      ( -9998.16 -9998.16 )
Norm@50keV  : 7.75136E-03    ( -0.000563401   0.00554889 )
------------------------------------------------------------
#Fit statistic : Chi-Squared =          54.15 using 59 PHA bins.
# Reduced chi-squared =         0.9669 for     56 degrees of freedom
# Null hypothesis probability =   5.453782e-01

Photon flux (15-150 keV)    in 25.24 sec: 0.888008 ( -0.071993  0.067231 ) ph/cm2/s
Energy fluence (15-150 keV)             : 2.08823e-06 ( -1.71379e-07  1.61853e-07 ) ergs/cm2
1-s peak spectrum fit
Power-law model
Time interval is from    0.556 sec. to    1.556 sec.

Spectral model in power-law:
------------------------------------------------------------
Parameters  : value       lower 90%   higher 90%
Photon index: -0.911181     ( -0.318817   0.340002 )
Norm@50keV  : 1.62362E-02    ( -0.00297149   0.00291967 )
------------------------------------------------------------
#Fit statistic : Chi-Squared =          42.48 using 59 PHA bins.
# Reduced chi-squared =         0.7453 for     57 degrees of freedom
# Null hypothesis probability =   9.239103e-01

Photon flux (15-150 keV)    in 1 sec: 1.86377 ( -0.33846  0.34073 ) ph/cm2/s
Energy fluence (15-150 keV)             : 1.81447e-07 ( -3.37846e-08  3.40395e-08 ) ergs/cm2
Cutoff power-law model
Time interval is from    0.556 sec. to    1.556 sec.
Spectral model in the cutoff power-law:
------------------------------------------------------------
Parameters  : value       lower 90%   higher 90%
Photon index: -0.775785     ( -0.517848   1.29996 )
Epeak [keV] : 534.142      ( -375.594 -375.594 )
Norm@50keV  : 1.84828E-02    ( -0.0043832   0.0448029 )
------------------------------------------------------------
#Fit statistic : Chi-Squared =          42.46 using 59 PHA bins.
# Reduced chi-squared =         0.7583 for     56 degrees of freedom
# Null hypothesis probability =   9.090887e-01

Photon flux (15-150 keV)    in 1 sec: 1.85420 ( -0.35338  0.34713 ) ph/cm2/s
Energy fluence (15-150 keV)             : 1.80697e-07 ( -3.52851e-08  3.46159e-08 ) ergs/cm2
Time-resolved spectra
Distribution
T90 vs. Hardness ratio plot
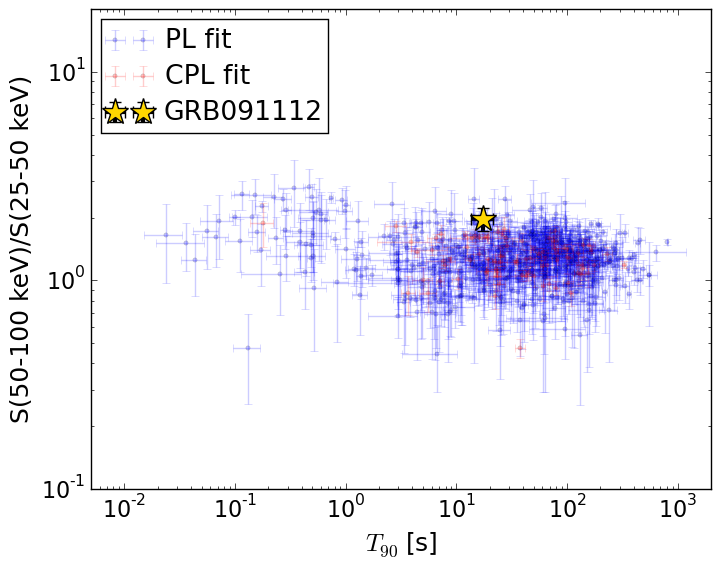
T90                                   = 17.52 sec.
Hardness ratio (energy fluence ratio) = 1.97287661949
S(15-50 keV) vs. S(50-150 keV) plot
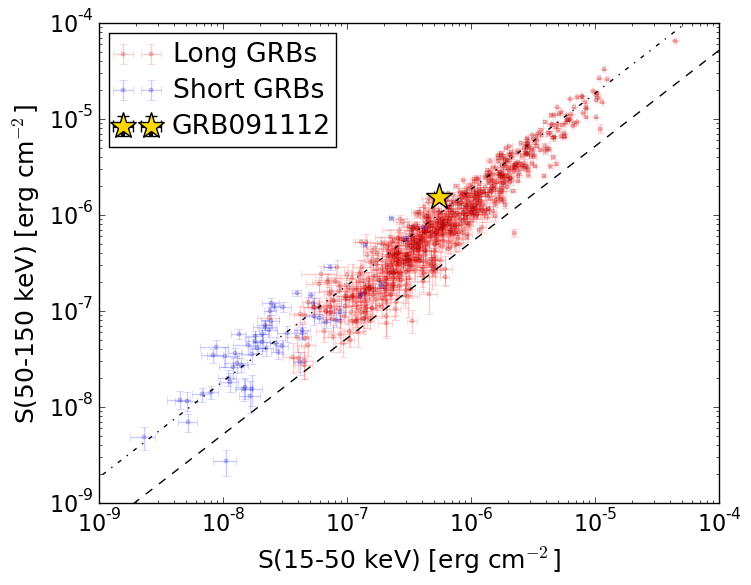
S(15-50 keV)  = 5.5061e-07
S(50-150 keV) = 1.5384386e-06
The dash-dotted line and the dashed line traces the fluences calculated from the Band function with Epeak = 15 and 150 keV, respectively. Both lines assume a canonical values of alpha = -1 and beta = -2.5.
Mask shadow pattern
IMX = -6.266061842258196E-01, IMY = 5.283662211896585E-01
Spacecraft aspect plot
Bright source in the pre-burst/pre-slew/post-slew images
Pre-burst image of 15-350 keV band
Time interval of the image:
-41.035410 -10.500000

# RAcent  DECcent POSerr Theta    Phi  PeakCts   SNR AngSep     Name
#  [deg]    [deg]    ['] [deg]  [deg]                   [']
244.9630 -15.5859    2.4  37.4 -100.8   1.8349   4.8    3.4	Sco X-1
254.5525  35.5355    0.0  46.5  -19.9   0.2354   0.9   12.5	Her X-1
255.8280 -37.8862    9.3  41.2 -139.2   0.3199   1.2    7.9	4U 1700-377
256.6136 -36.4882    8.6  39.7 -138.5  -0.3038  -1.3    9.4	GX 349+2
263.0589 -24.8463    6.3  27.3 -132.2   0.3151   1.8    6.6	GX 1+4
264.9089 -44.4360    7.8  43.1 -153.0  -0.3673  -1.5    7.2	4U 1735-44
268.4922  -1.2817    0.0  12.8  -69.2   0.2590   1.6   12.7	SW J1753.5-0127
270.1108 -24.9465   15.0  23.7 -144.5  -0.1180  -0.8   12.3	GX 5-1
270.1349 -25.6982   31.5  24.3 -145.4   0.0542   0.4    9.4	GRS 1758-258
274.1241 -13.8695    7.5  12.2 -136.3   0.2196   1.5   12.2	GX 17+2
276.0758 -30.3256    8.4  27.0 -160.4   0.2276   1.4    8.2	H1820-303
284.9790 -24.8028    6.9  21.4 -179.7  -0.2671  -1.7    7.7	HT1900.1-2455
288.8211  11.0981   11.3  16.7   37.6   0.1674   1.0    9.3	GRS 1915+105
299.4558  35.1319    3.7  42.5   32.6   0.9892   3.1    7.8	Cyg X-1
263.1634 -33.9712  238.6  34.5 -143.2  -0.0096  -0.0   11.9	GX 354-0
285.3274 -62.2923    2.2  58.7 -172.2   4.6990   5.2 ------	UNKNOWN
281.5412 -61.1153    2.7  57.4 -170.1   2.8686   4.2 ------	UNKNOWN
267.9934 -22.3322    2.9  22.5 -136.8   0.6147   4.0 ------	UNKNOWN
Pre-slew background subtracted image of 15-350 keV band
Time interval of the image:
-10.500000 14.744000

# RAcent  DECcent POSerr Theta    Phi  PeakCts   SNR AngSep     Name
#  [deg]    [deg]    ['] [deg]  [deg]                   [']
245.1230 -15.5303   50.3  37.3 -100.8  -0.0574  -0.2   10.6	Sco X-1
254.4026  35.2561    5.6  46.3  -20.3   0.4054   2.0    5.8	Her X-1
255.9903 -37.9811   22.9  41.2 -139.4   0.0972   0.5    8.2	4U 1700-377
256.6207 -36.5253    4.1  39.8 -138.6   0.5172   2.8   10.8	GX 349+2
263.1653 -24.7286    5.0  27.2 -132.2  -0.2833  -2.3    8.6	GX 1+4
264.6207 -44.4172    4.8  43.2 -152.7   0.4493   2.4    5.6	4U 1735-44
268.3395  -1.3707    8.7  12.9  -69.7   0.1379   1.3    5.2	SW J1753.5-0127
270.3449 -25.0747    3.9  23.7 -145.1   0.3108   3.0    3.3	GX 5-1
270.1846 -25.8749    7.7  24.5 -145.7  -0.1602  -1.5   10.2	GRS 1758-258
274.0267 -14.1833    7.0  12.5 -136.8  -0.1615  -1.7    8.9	GX 17+2
275.7391 -30.2497  143.3  27.0 -159.7  -0.0086  -0.1   11.9	H1820-303
284.9124 -25.0731    7.9  21.7 -179.4  -0.1508  -1.5   11.4	HT1900.1-2455
288.7736  10.7926   10.8  16.4   38.0   0.1116   1.1    9.3	GRS 1915+105
299.5316  35.0912    4.4  42.5   32.7   0.6154   2.6    7.2	Cyg X-1
262.8412 -33.9119   26.3  34.6 -142.7  -0.0625  -0.4    8.7	GX 354-0
312.0536 -39.7420    2.2  45.6  156.5   1.2435   5.3 ------	UNKNOWN
268.9398  44.4911    2.1  49.4   -1.2   1.2224   5.4 ------	UNKNOWN
276.5337  -4.4967    2.5   4.6  -89.7   0.4278   4.6 ------	UNKNOWN
263.8886 -22.2823    2.1  24.9 -129.5   0.6361   5.5 ------	UNKNOWN
257.7530 -36.7294    0.7  39.3 -139.9   3.1262  17.7 ------	UNKNOWN
Post-slew image of 15-350 keV band
Time interval of the image:
-60.336000 482.711700

# RAcent  DECcent POSerr Theta    Phi  PeakCts   SNR AngSep     Name
#  [deg]    [deg]    ['] [deg]  [deg]                   [']
244.9580 -15.6219    1.7  37.4 -100.8  34.2855   6.9    1.7	Sco X-1
254.5710  35.4496   13.1  46.4  -19.9   3.3478   0.9    8.5	Her X-1
255.8434 -37.9649    9.2  41.2 -139.2   4.4916   1.3    9.9	4U 1700-377
256.2989 -36.5284  104.1  39.9 -138.2   0.3569   0.1    9.1	GX 349+2
263.0229 -24.8863    7.8  27.3 -132.1   3.2951   1.5    8.5	GX 1+4
264.6822 -44.3045   11.5  43.0 -152.6   3.4076   1.0    9.1	4U 1735-44
268.4644  -1.2864    4.1  12.8  -69.0   6.0063   2.8   11.5	SW J1753.5-0127
270.3577 -25.1873    6.3  23.8 -145.2   3.7175   1.8    7.6	GX 5-1
270.1461 -25.7571   14.2  24.4 -145.4   1.6368   0.8    8.5	GRS 1758-258
274.1309 -13.8683    0.0  12.2 -136.2   4.2230   2.3   12.4	GX 17+2
276.0927 -30.4015    6.1  27.0 -160.4   4.1100   1.9    8.9	H1820-303
285.0748 -25.0665   24.3  21.7 -179.8  -1.0822  -0.5    9.0	HT1900.1-2455
288.7188  10.9438    5.0  16.6   37.6   5.1186   2.3    4.7	GRS 1915+105
299.5077  35.1464    2.9  42.6   32.7  17.0117   3.9    5.2	Cyg X-1
263.1819 -33.9785    0.0  34.5 -143.1   1.0770   0.4   12.9	GX 354-0
277.1293 -30.7361    3.1  27.2 -162.4   7.8219   3.7 ------	UNKNOWN
279.0789 -60.0810    3.0  56.3 -168.6  34.9028   3.9 ------	UNKNOWN
237.6939  18.5867    2.9  48.2  -50.6  36.0743   4.0 ------	UNKNOWN