Analysis Summary
Notes:
- 1) No attempt has been made to eliminate the non-significant decimal places.
- 2) This batgrbproduct analysis is done using the HEASARC data.
- 3) This batgrbproduct analysis is using the flight position for the mask-weighting calculation.
==========================================================================
           BAT GROUND-DETECTED GRB DATA PROCESSING REPORT
    Process Script Ver: batgrbproduct v2.46
    Process Start Time: Sun May 10 02:16:33 EDT 2015
             Host Name: bat1
   Current Working Dir: /local/data/bat1/alien/Swift_3rdBATcatalog/event/ground_detect_bursts/scripts
======================================================================

  Trigger: 00376211      Segment: 000

  BAT Trigger Time: 280172670.72
               UTC: 2009-11-17T17:44:25.451   [includes UTCF correction]
       Where From?: Ground analysis (best_duration.txt)
  NOTE: BAT trigger time for ground-detected burst is the T100 start time.

  Refined Position:   [ source = BAT pre-slew image ]
    RA: 30.9584269946   Dec: -16.9458794914  [deg; J2000]
        { 02h 03m 50.0s , -16d -56' -45.2" }
        +/- 2.78625836544 [arcmin] (estimated 90% radius based on SNR)
    SNR: 7.03769370257


  Angular difference between the analysis and refined position is Usage: arcmin

  Partial Coding Fraction: 0.07910156    [ including projection effects ]

  Duration (found by FRED-model fit)
     T90: 0.64 +/- N/A
        Measured from: 0.064
                   to: 0.704     [s; relative to TRIGTIME]
     T50: 0.192 +/- N/A
        Measured from: 0.192
                   to: 0.384


====== Table of the duration information =============================

        Value   tstart    tstop
T100    0.960    0.000    0.960
T90     0.640    0.064    0.704
T50     0.192    0.192    0.384
Peak    1.000   -0.244    0.756


====== Spectral Analysis Summary =====================================

Model      : spectral model: simple power-law (PL) and cutoff power-law (CPL)
Ph_index   : photon index: E^{Ph_index}
Ph_90err   : 90% error of the photon index
Epeak      : Epeak in keV
Epeak_90err: 90% error of Epeak
Norm       : normalization at 50 keV in both the PL model and CPL model
Nomr_90err : 90% error of the normalization
chi2       : Chi-Squared
dof        : degree of freedo

=== Time-averaged spectral analysis ===
(Best model with acceptable fit: PL)

Model Ph_index Ph_90err_low Ph_90err_hi  Epeak  Epeak_90err_low  Epeak_90err_hi  Norm       Nomr_90err_low    Norm_90err_hi    chi2    dof
PL      -0.593    -0.454      0.545       -           -               -         2.02e-02     -6.22e-03          5.58e-03      55.710   57
CPL     -0.592    -0.450      0.559     9999.330    -9999.330      -9999.330      2.04e-02     -5.75e-03          2.85e-02      55.730   56


=== 1-s peak spectral analysis ===
(Best model with acceptable fit: PL)

Model Ph_index Ph_90err_low Ph_90err_hi  Epeak  Epeak_90err_low  Epeak_90err_hi  Norm       Nomr_90err_low    Norm_90err_hi    chi2    dof
PL      -0.833     -0.404     0.451       -           -               -         2.17e-02     -5.35e-03          5.12e-03      58.770   57
CPL     -0.751      N/A       N/A         911.261      N/A           N/A         2.36e-02        N/A               N/A         58.880   56


=== Fluence/Peak Flux Summary ===

              Model    Band1     Band2     Band3     Band4     Band5     Total
                       15-25     25-50    50-100    100-350    15-150    15-350    keV
Fluence         PL   1.07e-08  3.44e-08  9.13e-08  7.08e-07  2.49e-07  8.44e-07   erg/cm2
      90%_error_low -6.00e-09 -1.36e-08 -2.11e-08 -3.35e-07 -5.92e-08 -3.43e-07   erg/cm2
      90%_error_hi   7.78e-09  1.29e-08  2.10e-08  5.51e-07  5.90e-08  5.40e-07   erg/cm2
Peak flux       PL   4.73e-01  7.11e-01  7.98e-01  1.70e+00  2.49e+00  3.68e+00   ph/cm2/s
      90%_error_low -2.25e-01 -2.32e-01 -1.83e-01 -7.33e-01 -5.85e-01 -8.85e-01   ph/cm2/s
      90%_error_hi   2.74e-01  2.23e-01  1.81e-01  1.06e+00  5.89e-01  9.81e-01   ph/cm2/s

Fluence        CPL   1.07e-08  3.50e-08  8.80e-08  7.14e-07  2.48e-07  7.53e-07   erg/cm2
      90%_error_low    N/A    -1.41e-08 -2.78e-08    N/A       N/A    -3.94e-07   erg/cm2
      90%_error_hi     N/A     1.24e-08  3.83e-08    N/A       N/A     6.12e-07   erg/cm2
Peak flux      CPL   4.73e-01  7.10e-01  7.95e-01  1.96e+00  2.49e+00  3.80e+00   ph/cm2/s
      90%_error_low     N/A       N/A       N/A       N/A   -5.85e-01 -1.30e+00   ph/cm2/s
      90%_error_hi      N/A       N/A       N/A       N/A    5.89e-01  9.15e-01   ph/cm2/s

======================================================================
Image
15.0-350.0 keV image (Event data)
#RAcent DECcent POSerr Theta  Phi  Peak_Cts  SNR Name
30.958 -16.946 0.027 44.822 45.812 0.322 7.038 TRIG_00376211

Image time interval: 0.000 to 0.960 [sec]
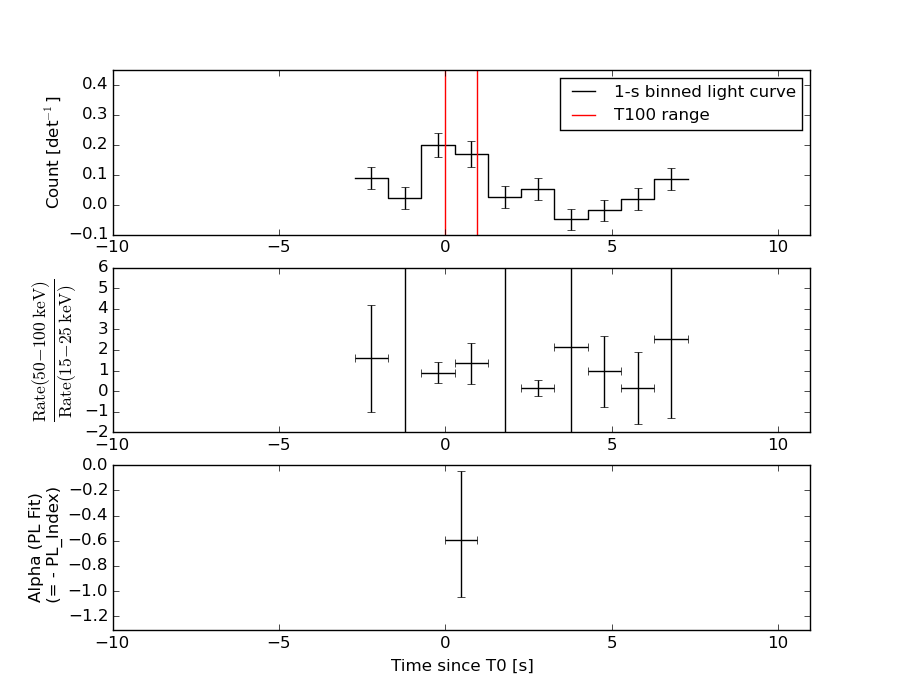
Light Curves
Note: The mask-weighted lightcurves have units of either count/det or counts/sec/det, where a det is 0.4 x 0.4 = 0.16 sq cm.
Full-time range; 1 s binning
Other quick-look light curves:
- 64 ms binning (zoomed)
- 16 ms binning (zoomed)
- 8 ms binning (zoomed)
- 2 ms binning (zoomed)
- SN=5 or 10 s binning (full-time range)
- Raw light curve
Spectra
- 64 ms binning (zoomed)
- 16 ms binning (zoomed)
- 8 ms binning (zoomed)
- 2 ms binning (zoomed)
- SN=5 or 10 s binning (full-time range)
- Raw light curve
Spectra
Notes:
- 1) The fitting includes the systematic errors.
- 2) When the burst includes telescope slew time periods, the fitting uses an average response file made from multiple 5-s response files through out the slew time plus single time preiod for the non-slew times, and weighted by the total counts in the corresponding time period using addrmf. An average response file is needed becuase a spectral fit using the pre-slew DRM will introduce some errors in both a spectral shape and a normalization if the PHA file contains a lot of the slew/post-slew time interval.
- 3) For fits to more complicated models (e.g. a power-law over a cutoff power-law), the BAT team has decided to require a chi-square improvement of more than 6 for each extra dof.
Time averaged spectrum fit using the average DRM
Power-law model
Time interval is from    0.000 sec. to    0.960 sec.

Spectral model in power-law:
------------------------------------------------------------
Parameters  : value       lower 90%   higher 90%
Photon index: -0.592714     ( -0.454056   0.544973 )
Norm@50keV  : 2.02170E-02    ( -0.00621943   0.00558269 )
------------------------------------------------------------
#Fit statistic : Chi-Squared =          55.71 using 59 PHA bins.
# Reduced chi-squared =         0.9774 for     57 degrees of freedom
# Null hypothesis probability =   5.234674e-01

Photon flux (15-150 keV)    in 0.96 sec: 2.36251 ( -0.60184  0.6054 ) ph/cm2/s
Energy fluence (15-150 keV)             : 2.49087e-07 ( -5.91803e-08  5.90265e-08 ) ergs/cm2
Cutoff power-law model
Time interval is from    0.000 sec. to    0.960 sec.
Spectral model in the cutoff power-law:
------------------------------------------------------------
Parameters  : value       lower 90%   higher 90%
Photon index: -0.592102     ( -0.449906   0.558376 )
Epeak [keV] : 9999.33      ( -9999.36 -9999.36 )
Norm@50keV  : 2.04442E-02    ( -0.00574807   0.028536 )
------------------------------------------------------------
#Fit statistic : Chi-Squared =          55.73 using 59 PHA bins.
# Reduced chi-squared =         0.9953 for     56 degrees of freedom
# Null hypothesis probability =   4.848814e-01

Photon flux (15-150 keV)    in 0.96 sec: 2.36252 ( -0.60222  0.6046 ) ph/cm2/s
Energy fluence (15-150 keV)             : 2.47595e-07 ( 0  0 ) ergs/cm2
1-s peak spectrum fit
Power-law model

Time interval is from   -0.244 sec. to    0.756 sec.

Spectral model in power-law:
------------------------------------------------------------
Parameters  : value       lower 90%   higher 90%
Photon index: -0.832574     ( -0.403544   0.451085 )
Norm@50keV  : 2.17172E-02    ( -0.00534911   0.00511521 )
------------------------------------------------------------
#Fit statistic : Chi-Squared =          58.77 using 59 PHA bins.
# Reduced chi-squared =          1.031 for     57 degrees of freedom
# Null hypothesis probability =   4.104526e-01

Photon flux (15-150 keV)    in 1 sec: 2.49369 ( -0.58495  0.58897 ) ph/cm2/s
Energy fluence (15-150 keV)             : 2.50403e-07 ( -5.84168e-08  5.85839e-08 ) ergs/cm2
Cutoff power-law model
Time interval is from   -0.244 sec. to    0.756 sec.
Spectral model in the cutoff power-law:
------------------------------------------------------------
Parameters  : value       lower 90%   higher 90%
Photon index: -0.751486     (       )
Epeak [keV] : 911.261      (   )
Norm@50keV  : 2.36097E-02    (     )
------------------------------------------------------------
#Fit statistic : Chi-Squared =          58.88 using 59 PHA bins.
# Reduced chi-squared =          1.051 for     56 degrees of freedom
# Null hypothesis probability =   3.705705e-01

Photon flux (15-150 keV)    in 1 sec: 2.49325 ( -0.58485  0.58881 ) ph/cm2/s
Energy fluence (15-150 keV)             : 4.12838e-09 ( 0  0 ) ergs/cm2
Time-resolved spectra
Distribution
T90 vs. Hardness ratio plot
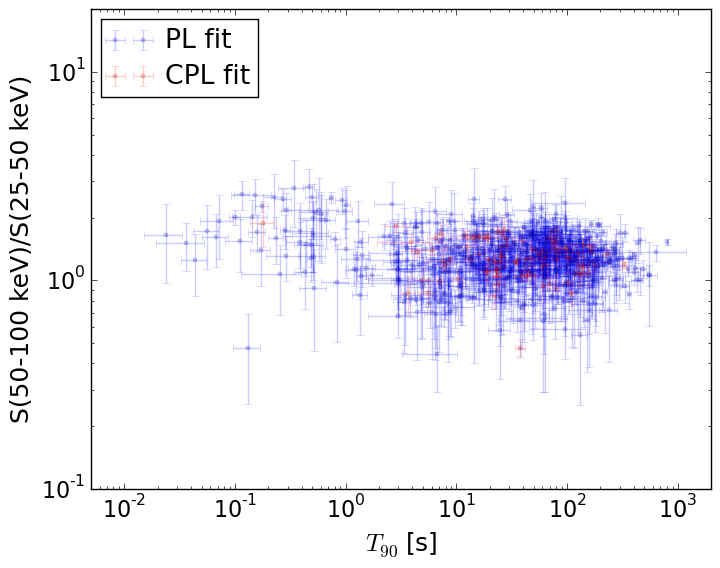
T90                                   = N/A sec.
Hardness ratio (energy fluence ratio) = N/A
S(15-50 keV) vs. S(50-150 keV) plot
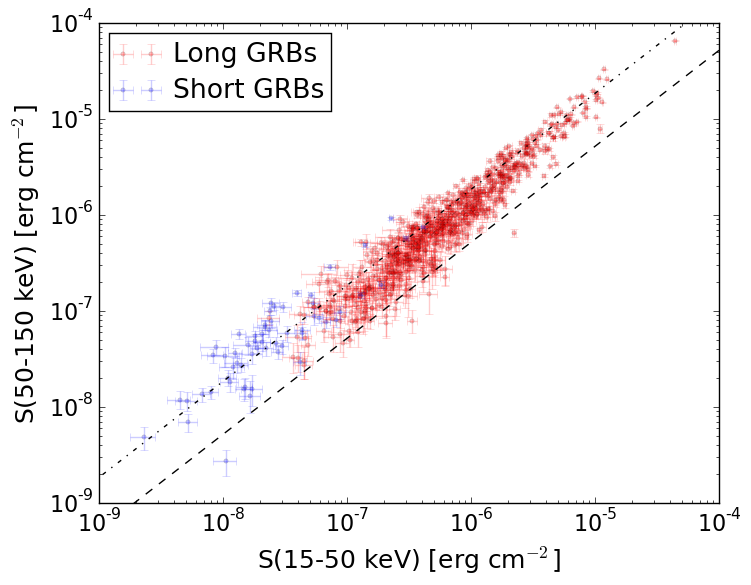
S(15-50 keV)  = N/A
S(50-150 keV) = N/A
The dash-dotted line and the dashed line traces the fluences calculated from the Band function with Epeak = 15 and 150 keV, respectively. Both lines assume a canonical values of alpha = -1 and beta = -2.5.
Mask shadow pattern
IMX = 0.692688935943, IMY = -0.712609536878
Spacecraft aspect plot
Bright source in the event data image
Event data image of 15-350 keV band
Time interval of the image:
-2.560000 7.350000

# RAcent  DECcent POSerr Theta    Phi  PeakCts   SNR AngSep     Name
#  [deg]    [deg]    ['] [deg]  [deg]                   [']
135.6950 -40.5227    4.9  49.9 -167.0   0.1799   2.4    7.8	Vela X-1
 30.9539 -16.9875    2.7  44.8   45.8   0.5087   4.2 ------	UNKNOWN
130.2664 -26.7020    2.5  57.1  177.3   0.8499   4.5 ------	UNKNOWN
346.0384 -28.0000    2.2  58.4   -7.0   1.0290   5.3 ------	UNKNOWN
317.4998 -65.7885    3.1  45.2  -58.4   0.4955   3.8 ------	UNKNOWN
Webpage updated on:
Wed Jul 15 00:18:50 EDT 2015