Analysis Summary
Notes:
- 1) No attempt has been made to eliminate the non-significant decimal places.
- 2) This batgrbproduct analysis is done using the HEASARC data.
- 3) This batgrbproduct analysis is using the flight position for the mask-weighting calculation.
Special note: Due to the low partial coding fraction, the refined position is found using the DETECTION mask. Therefore, the refined position and the mask shadow pattern shown here are from analyses with DETECTION mask, everything else uses the FLUX mask.
======================================================================
                  BAT GRB EVENT DATA PROCESSING REPORT
    Process Script Ver: batgrbproduct v2.46
    Process Start Time: Sat May  9 18:50:29 EDT 2015
             Host Name: bat1
   Current Working Dir: /local/data/bat1/alien/Swift_3rdBATcatalog/event/batevent_reproc/trigger377179
======================================================================

  Trigger: 00377179      Segment: 000

  BAT Trigger Time: 281057151.104   [s; MET]
      Trigger Stop: 281057152.128   [s; MET]
               UTC: 2009-11-27T23:25:45.805160    [includes UTCF correction]
       Where From?: TDRSS position message

  BAT
    RA: 36.5708005072054   Dec: -18.9537141498341  [deg; J2000]

     Catalogged Source?: NO
     Point Source?:      YES
     GRB Indicated?:     YES    [ by BAT flight software ]
     Image S/N Ratio:    17.95
     Image Trigger?:     NO
     Rate S/N Ratio:     108.300507847378  [ if not an image trigger ]
     Image S/N Ratio:    17.95

  Analysis Position:   [ source = BAT ]
    RA: 36.5708005072054   Dec: -18.9537141498341  [deg; J2000]

  Refined Position:   [ source = BAT pre-slew burst ]
    RA:    Dec:   [deg; J2000]
        { 00h 00m 00.0s , +00d 00' 00.0" }
         +/- -inf [arcmin] (estimated 90% radius based on SNR)
         +/- 0 [arcmin] (formal 1-sigma fit error)
    SNR:

  Angular difference between the analysis and refined position is 2434.384647 arcmin

  Partial Coding Fraction: 0.04443359    [ including projection effects ]

  Duration
     T90: 6.9559999704361 +/- 0.150359555029189
        Measured from: -0.11599999666214
                   to: 6.83999997377396     [s; relative to TRIGTIME]
     T50: 3.83999991416931 +/- 0.468892330574499
        Measured from: 0.340000033378601
                   to: 4.17999994754791     [s; relative to TRIGTIME]


  Fluence
     Peak Flux  (peak 1 second)
        Measured from: -0.251999974250793
                   to: 0.748000025749207     [s; relative to TRIGTIME]
     Total Fluence
        Measured from: -0.371999979019165
                   to: 7.19600003957748     [s; relative to TRIGTIME]

             Band 1     Band 2     Band 3     Band 4
              15-25      25-50     50-100    100-350     keV
 Total     4.483462   5.065744   3.271748   0.727281
           0.149998   0.159399   0.132547   0.092669 [error]
 Peak      1.277927   1.731821   1.296548   0.308684
           0.073477   0.085347   0.076522   0.046499 [error]

     [ fluence units of on-axis counts / fully illuminated detector ]

======================================================================


====== Table of the duration information =============================

        Value   tstart    tstop
T100    7.568   -0.372    7.196
T90     6.956   -0.116    6.840
T50     3.840    0.340    4.180
Peak    1.000   -0.252    0.748


====== Spectral Analysis Summary =====================================

Model      : spectral model: simple power-law (PL) and cutoff power-law (CPL)
Ph_index   : photon index: E^{Ph_index}
Ph_90err   : 90% error of the photon index
Epeak      : Epeak in keV
Epeak_90err: 90% error of Epeak
Norm       : normalization at 50 keV in both the PL model and CPL model
Nomr_90err : 90% error of the normalization
chi2       : Chi-Squared
dof        : degree of freedo

=== Time-averaged spectral analysis ===
(Best model with acceptable fit: PL)

Model Ph_index Ph_90err_low Ph_90err_hi  Epeak  Epeak_90err_low  Epeak_90err_hi  Norm       Nomr_90err_low    Norm_90err_hi    chi2    dof
PL      -2.023    -0.072      0.071       -           -               -         1.23e-01     -4.94e-03          4.92e-03      56.080   57
CPL     -1.797    -0.272      0.288       46.374      N/A           N/A         1.58e-01        N/A               N/A         54.080   56


=== 1-s peak spectral analysis ===
(Best model with acceptable fit: PL)

Model Ph_index Ph_90err_low Ph_90err_hi  Epeak  Epeak_90err_low  Epeak_90err_hi  Norm       Nomr_90err_low    Norm_90err_hi    chi2    dof
PL      -1.830     -0.095     0.094       -           -               -         3.25e-01     -1.90e-02          1.89e-02      59.200   57
CPL     -1.330     -0.382     0.415       69.588     -12.879        56.021      5.75e-01     -1.99e-01          3.38e-01      54.110   56


=== Fluence/Peak Flux Summary ===

              Model    Band1     Band2     Band3     Band4     Band5     Total
                       15-25     25-50    50-100    100-350    15-150    15-350    keV
Fluence         PL   1.94e-06  2.60e-06  2.56e-06  4.52e-06  8.58e-06  1.16e-05   erg/cm2
      90%_error_low -1.29e-07 -1.04e-07 -1.37e-07 -4.97e-07 -3.34e-07 -6.16e-07   erg/cm2
      90%_error_hi   1.32e-07  1.04e-07  1.37e-07  5.34e-07  3.34e-07  6.37e-07   erg/cm2
Peak flux       PL   1.84e+01  1.52e+01  8.57e+00  7.12e+00  4.53e+01  4.93e+01   ph/cm2/s
      90%_error_low -1.68e+00 -8.96e-01 -6.24e-01 -9.77e-01 -2.69e+00 -2.76e+00   ph/cm2/s
      90%_error_hi   1.73e+00  8.93e-01  6.19e-01  1.05e+00  2.69e+00  2.76e+00   ph/cm2/s

Fluence        CPL    N/A      N/A      N/A      N/A      N/A      N/A      erg/cm2
      90%_error_low -1.29e-07 -1.04e-07 -1.37e-07 -4.97e-07 -3.34e-07 -6.16e-07   erg/cm2
      90%_error_hi   1.32e-07  1.04e-07  1.37e-07  5.34e-07  3.34e-07  6.37e-07   erg/cm2
Peak flux      CPL   1.67e+01  1.59e+01  9.05e+00  4.51e+00  4.43e+01  4.61e+01   ph/cm2/s
      90%_error_low -2.07e+00 -1.04e+00 -7.35e-01 -1.33e+00 -2.78e+00 -3.21e+00   ph/cm2/s
      90%_error_hi   2.12e+00  1.06e+00  7.49e-01  1.93e+00  2.79e+00  3.40e+00   ph/cm2/s

======================================================================
Image
Pre-slew 15.0-350.0 keV image (Event data; DETECTION mask)
#   RAcent    DECcent   POSerr    Theta     Phi              Peak Cts       SNR   Name
   36.5799   -18.9458   0.0067    52.4505    21.8624        14.3704741     29.083 TRIG_00377179

Foreground time interval of the image:
 -0.368   8.076 (delta_t =   8.444 [sec])
Background time interval of the image:
-107.403  -0.368 (delta_t = 107.035 [sec])
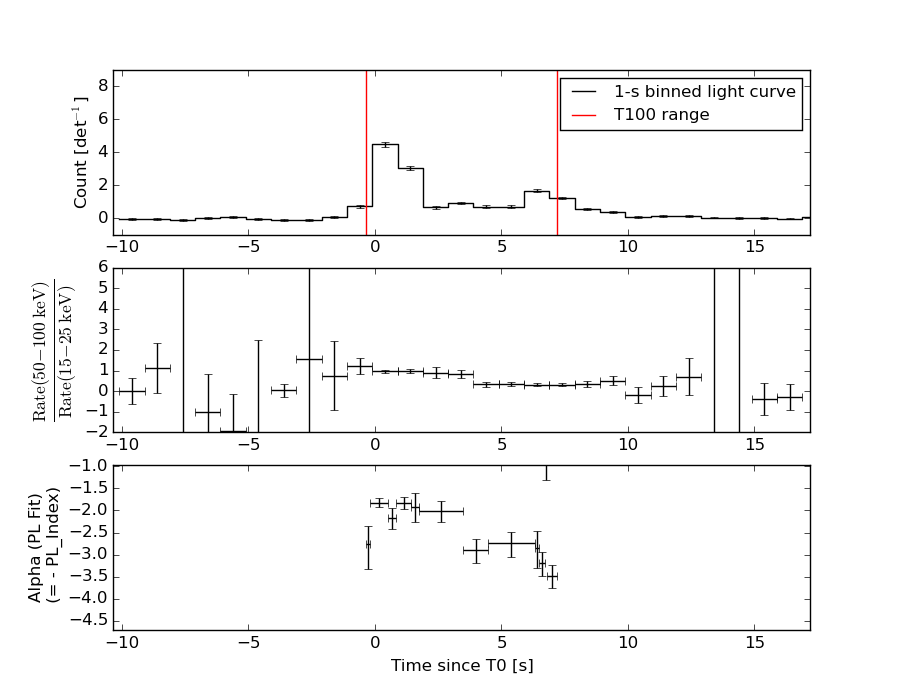
Light Curves
Note: The mask-weighted lightcurves have units of either count/det or counts/sec/det, where a det is 0.4 x 0.4 = 0.16 sq cm.
Full-time range; 1 s binning
Other quick-look light curves:
- 64 ms binning (zoomed)
- 16 ms binning (zoomed)
- 8 ms binning (zoomed)
- 2 ms binning (zoomed)
- SN=5 or 10 s binning (full-time range)
- Raw light curve
Spectra
- 64 ms binning (zoomed)
- 16 ms binning (zoomed)
- 8 ms binning (zoomed)
- 2 ms binning (zoomed)
- SN=5 or 10 s binning (full-time range)
- Raw light curve
Spectra
Notes:
- 1) The fitting includes the systematic errors.
- 2) When the burst includes telescope slew time periods, the fitting uses an average response file made from multiple 5-s response files through out the slew time plus single time preiod for the non-slew times, and weighted by the total counts in the corresponding time period using addrmf. An average response file is needed becuase a spectral fit using the pre-slew DRM will introduce some errors in both a spectral shape and a normalization if the PHA file contains a lot of the slew/post-slew time interval.
- 3) For fits to more complicated models (e.g. a power-law over a cutoff power-law), the BAT team has decided to require a chi-square improvement of more than 6 for each extra dof.
Time averaged spectrum fit using the average DRM
Power-law model
Time interval is from   -0.372 sec. to    7.196 sec.

Spectral model in power-law:
------------------------------------------------------------
Parameters  : value       lower 90%   higher 90%
Photon index: -2.0231     ( -0.0723726   0.0713433 )
Norm@50keV  : 0.122686    ( -0.00493974   0.00492055 )
------------------------------------------------------------
#Fit statistic : Chi-Squared =          56.08 using 59 PHA bins.
# Reduced chi-squared =         0.9838 for     57 degrees of freedom
# Null hypothesis probability =   5.096450e-01

Photon flux (15-150 keV)    in 7.568 sec: 18.6025 ( -0.8042  0.8082 ) ph/cm2/s
Energy fluence (15-150 keV)             : 8.5753e-06 ( -3.33899e-07  3.34359e-07 ) ergs/cm2
Cutoff power-law model
Time interval is from   -0.372 sec. to    7.196 sec.
Spectral model in the cutoff power-law:
------------------------------------------------------------
Parameters  : value       lower 90%   higher 90%
Photon index: -1.7971     ( -0.271697   0.288079 )
Epeak [keV] : 46.3739      (   )
Norm@50keV  : 0.158154    (     )
------------------------------------------------------------
#Fit statistic : Chi-Squared =          54.08 using 59 PHA bins.
# Reduced chi-squared =         0.9657 for     56 degrees of freedom
# Null hypothesis probability =   5.479355e-01

Photon flux (15-150 keV)    in 7.568 sec: 18.2815 ( -0.8828  0.8883 ) ph/cm2/s
Energy fluence (15-150 keV)             : 0 ( 0  0 ) ergs/cm2
1-s peak spectrum fit
Power-law model
Time interval is from   -0.252 sec. to    0.748 sec.

Spectral model in power-law:
------------------------------------------------------------
Parameters  : value       lower 90%   higher 90%
Photon index: -1.82982     ( -0.0953901   0.0935341 )
Norm@50keV  : 0.324997    ( -0.0189546   0.0188702 )
------------------------------------------------------------
#Fit statistic : Chi-Squared =          59.20 using 59 PHA bins.
# Reduced chi-squared =          1.039 for     57 degrees of freedom
# Null hypothesis probability =   3.952485e-01

Photon flux (15-150 keV)    in 1 sec: 45.3147 ( -2.6874  2.6936 ) ph/cm2/s
Energy fluence (15-150 keV)             : 2.98985e-06 ( -1.75617e-07  1.75998e-07 ) ergs/cm2
Cutoff power-law model
Time interval is from   -0.252 sec. to    0.748 sec.
Spectral model in the cutoff power-law:
------------------------------------------------------------
Parameters  : value       lower 90%   higher 90%
Photon index: -1.32972     ( -0.38241   0.414863 )
Epeak [keV] : 69.5879      ( -12.8792 56.0208 )
Norm@50keV  : 0.574528    ( -0.198951   0.337812 )
------------------------------------------------------------
#Fit statistic : Chi-Squared =          54.11 using 59 PHA bins.
# Reduced chi-squared =         0.9663 for     56 degrees of freedom
# Null hypothesis probability =   5.466949e-01

Photon flux (15-150 keV)    in 1 sec: 44.3102 ( -2.7803  2.7945 ) ph/cm2/s
Energy fluence (15-150 keV)             : 0 ( 0  0 ) ergs/cm2
Time-resolved spectra
Distribution
T90 vs. Hardness ratio plot
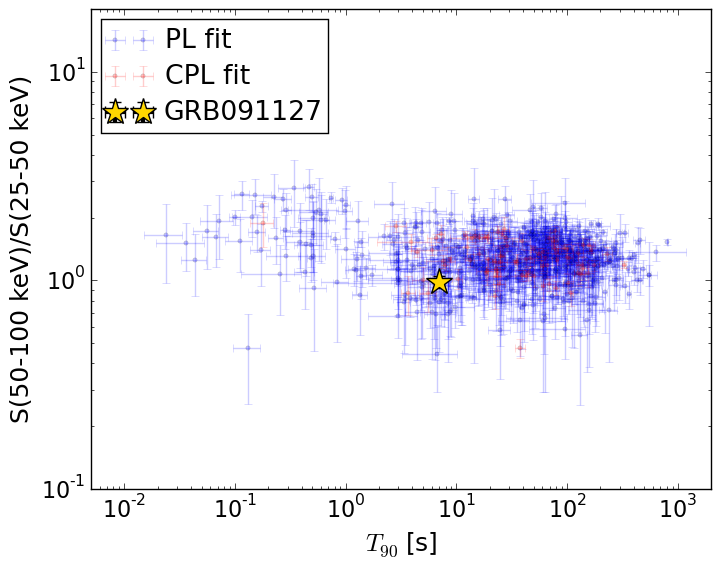
T90                                   = 6.956 sec.
Hardness ratio (energy fluence ratio) = 0.984146890525
S(15-50 keV) vs. S(50-150 keV) plot
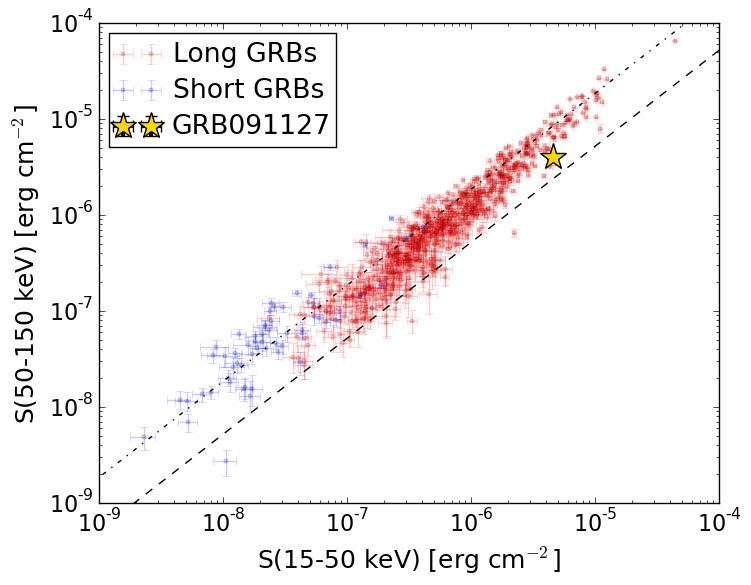
S(15-50 keV)  = 4.540768e-06
S(50-150 keV) = 4.034577e-06
The dash-dotted line and the dashed line traces the fluences calculated from the Band function with Epeak = 15 and 150 keV, respectively. Both lines assume a canonical values of alpha = -1 and beta = -2.5.
Mask shadow pattern (with DETECTION mask)
IMX = 1.207336881097049E+00, IMY = -4.844252725241740E-01
Spacecraft aspect plot
Bright source in the pre-burst/pre-slew/post-slew images
Pre-burst image of 15-350 keV band
Time interval of the image:
-107.403400 -0.372000

# RAcent  DECcent POSerr Theta    Phi  PeakCts   SNR AngSep     Name
#  [deg]    [deg]    ['] [deg]  [deg]                   [']
135.5210 -40.5457    0.8  33.9 -134.8   2.6375  15.0    0.6	Vela X-1
 61.7521 -22.8501    2.1  29.8   33.5   0.7745   5.5 ------	UNKNOWN
 34.7730 -29.0118    2.4  49.8    9.2   1.5221   4.7 ------	UNKNOWN
141.9736   0.7523    2.6  56.9  174.1   3.1139   4.5 ------	UNKNOWN
 22.5161 -36.5270    2.3  56.9   -4.0   3.0899   5.0 ------	UNKNOWN
Pre-slew background subtracted image of 15-350 keV band
Time interval of the image:
-0.372000 7.196000

# RAcent  DECcent POSerr Theta    Phi  PeakCts   SNR AngSep     Name
#  [deg]    [deg]    ['] [deg]  [deg]                   [']
135.5593 -40.5970    5.1  34.0 -134.7  -0.1146  -2.3    2.9	Vela X-1
 36.5808 -18.9477    0.5  52.4   21.9  14.1869  22.8 ------	UNKNOWN
 78.6121 -25.7826    2.4  15.1   47.8   0.2709   4.8 ------	UNKNOWN
 95.0499 -25.0558    2.4   8.6  120.2   0.2210   4.8 ------	UNKNOWN
143.9630  -1.4028    2.6  57.0  177.6   0.9226   4.5 ------	UNKNOWN
157.7131 -31.6391    2.7  53.2 -142.3   0.7675   4.3 ------	UNKNOWN
Post-slew image of 15-350 keV band
Time interval of the image:
900.396600 1001.916000

# RAcent  DECcent POSerr Theta    Phi  PeakCts   SNR AngSep     Name
#  [deg]    [deg]    ['] [deg]  [deg]                   [']
135.5373 -40.5490    1.4  34.2  -82.9   1.8214   8.2    0.5	Vela X-1
118.6406  32.0070    2.5  47.1  142.0   1.9050   4.6 ------	UNKNOWN
 81.5503 -29.2417    2.7  30.4    8.2   0.5455   4.3 ------	UNKNOWN
 90.8099 -26.2079    2.5  21.7    6.2   0.5188   4.6 ------	UNKNOWN
110.9867 -18.4630    2.9   4.2  -57.2   0.4140   4.1 ------	UNKNOWN
164.3298   7.9234    2.6  58.1 -156.8   2.7949   4.5 ------	UNKNOWN