Analysis Summary
Notes:
- 1) No attempt has been made to eliminate the non-significant decimal places.
- 2) This batgrbproduct analysis is done using the HEASARC data.
- 3) This batgrbproduct analysis is using the flight position for the mask-weighting calculation.
======================================================================
                  BAT GRB EVENT DATA PROCESSING REPORT
    Process Script Ver: batgrbproduct v2.46
    Process Start Time: Sun Jan 19 12:32:35 EST 2014
             Host Name: batevent1
   Current Working Dir: /local/data/batevent/batevent_reproc/trigger377487
======================================================================

  Trigger: 00377487      Segment: 000

  BAT Trigger Time: 281296750.08   [s; MET]
      Trigger Stop: 281296751.104   [s; MET]
               UTC: 2009-11-30T17:59:04.773120    [includes UTCF correction]
       Where From?: TDRSS position message

  BAT
    RA: 203.098397836289   Dec: 34.0753830112892  [deg; J2000]

     Catalogged Source?: NO
     Point Source?:      YES
     GRB Indicated?:     YES    [ by BAT flight software ]
     Image S/N Ratio:    7.78
     Image Trigger?:     NO
     Rate S/N Ratio:     14.2828568570857  [ if not an image trigger ]
     Image S/N Ratio:    7.78

  Analysis Position:   [ source = BAT ]
    RA: 203.098397836289   Dec: 34.0753830112892  [deg; J2000]

  Refined Position:   [ source = BAT pre-slew burst ]
    RA: 203.147297894378   Dec: 34.0869269740027  [deg; J2000]
        { 13h 32m 35.4s , +34d 05' 12.9" }
         +/- 1.31679771749279 [arcmin] (estimated 90% radius based on SNR)
         +/- 0.559297929773727 [arcmin] (formal 1-sigma fit error)
    SNR: 20.5294284452897

  Angular difference between the analysis and refined position is 2.526856 arcmin

  Partial Coding Fraction: 0.7734375    [ including projection effects ]

  Duration
     T90: 101.759999930859 +/- 24.0315634280469
        Measured from: -5.83599996566772
                   to: 95.9239999651909     [s; relative to TRIGTIME]
     T50: 31.8879998922348 +/- 6.30764996930951
        Measured from: 1.49200004339218
                   to: 33.379999935627     [s; relative to TRIGTIME]


  Fluence
     Peak Flux  (peak 1 second)
        Measured from: 0.0640000104904175
                   to: 1.06400001049042     [s; relative to TRIGTIME]
     Total Fluence
        Measured from: -28.6559999585152
                   to: 127.388000011444     [s; relative to TRIGTIME]

             Band 1     Band 2     Band 3     Band 4
              15-25      25-50     50-100    100-350     keV
 Total     1.082411   1.110622   0.576647   0.153630
           0.067421   0.069829   0.061550   0.054287 [error]
 Peak      0.036886   0.048177   0.036122   0.015742
           0.006441   0.006848   0.006061   0.005043 [error]

     [ fluence units of on-axis counts / fully illuminated detector ]

======================================================================


====== Table of the duration information =============================

        Value   tstart    tstop
T100  156.044  -28.656  127.388
T90   101.760   -5.836   95.924
T50    31.888    1.492   33.380
Peak    1.000    0.064    1.064


====== Spectral Analysis Summary =====================================

Model      : spectral model: simple power-law (PL) and cutoff power-law (CPL)
Ph_index   : photon index: E^{Ph_index}
Ph_90err   : 90% error of the photon index
Epeak      : Epeak in keV
Epeak_90err: 90% error of Epeak
Norm       : normalization at 50 keV in both the PL model and CPL model
Nomr_90err : 90% error of the normalization
chi2       : Chi-Squared
dof        : degree of freedo

=== Time-averaged spectral analysis ===
(Best model with acceptable fit: PL)

Model Ph_index Ph_90err_low Ph_90err_hi  Epeak  Epeak_90err_low  Epeak_90err_hi  Norm       Nomr_90err_low    Norm_90err_hi    chi2    dof
PL      -2.086    -0.147      0.141       -           -               -         1.01e-03     -9.86e-05          9.71e-05      59.430   57
CPL     -1.516    -0.487      0.633       34.059     -28.527        13.288      2.19e-03     -1.01e-03          3.01e-03      56.150   56


=== 1-s peak spectral analysis ===
(Best model with acceptable fit: PL)

Model Ph_index Ph_90err_low Ph_90err_hi  Epeak  Epeak_90err_low  Epeak_90err_hi  Norm       Nomr_90err_low    Norm_90err_hi    chi2    dof
PL      -1.198     -0.265     0.278       -           -               -         9.17e-03     -1.30e-03          1.30e-03      67.540   57
CPL     -1.211     -0.250     0.297     9999.360    -9999.360      -9999.360      9.22e-03     -1.31e-03          1.31e-03      67.570   56


=== Fluence/Peak Flux Summary ===

              Model    Band1     Band2     Band3     Band4     Band5     Total
                       15-25     25-50    50-100    100-350    15-150    15-350    keV
Fluence         PL   3.50e-07  4.51e-07  4.25e-07  7.06e-07  1.46e-06  1.93e-06   erg/cm2
      90%_error_low -3.59e-08 -3.36e-08 -5.63e-08 -1.68e-07 -1.29e-07 -2.37e-07   erg/cm2
      90%_error_hi   3.65e-08  3.36e-08  5.76e-08  2.02e-07  1.31e-07  2.62e-07   erg/cm2
Peak flux       PL   2.83e-01  3.41e-01  2.97e-01  4.44e-01  1.08e+00  1.36e+00   ph/cm2/s
      90%_error_low -8.10e-02 -6.11e-02 -4.92e-02 -1.43e-01 -1.60e-01 -2.02e-01   ph/cm2/s
      90%_error_hi   8.77e-02  5.88e-02  4.81e-02  1.86e-01  1.61e-01  2.06e-01   ph/cm2/s

Fluence        CPL   3.35e-07  4.81e-07  4.06e-07  2.56e-07  1.37e-06  1.48e-06   erg/cm2
      90%_error_low -3.95e-08 -4.38e-08 -6.89e-08 -1.55e-07 -1.47e-07 -2.22e-07   erg/cm2
      90%_error_hi   3.96e-08  4.49e-08  6.50e-08  4.05e-07  1.54e-07  4.30e-07   erg/cm2
Peak flux      CPL   2.83e-01  3.41e-01  2.94e-01  4.40e-01  1.08e+00  1.36e+00   ph/cm2/s
      90%_error_low -8.12e-02 -6.25e-02 -4.83e-02     N/A   -1.70e-01 -2.29e-01   ph/cm2/s
      90%_error_hi   8.77e-02  6.03e-02  5.23e-02     N/A    1.62e-01  1.98e-01   ph/cm2/s

======================================================================
Image
Pre-slew 15.0-350.0 keV image (Event data)
#   RAcent    DECcent   POSerr    Theta     Phi              Peak Cts       SNR   Name
  203.1473    34.0869   0.0094    28.6642     7.3722         1.6696792     20.529 TRIG_00377487

Foreground time interval of the image:
-28.656  18.221 (delta_t =  46.877 [sec])
Background time interval of the image:
-339.379 -28.656 (delta_t = 310.723 [sec])
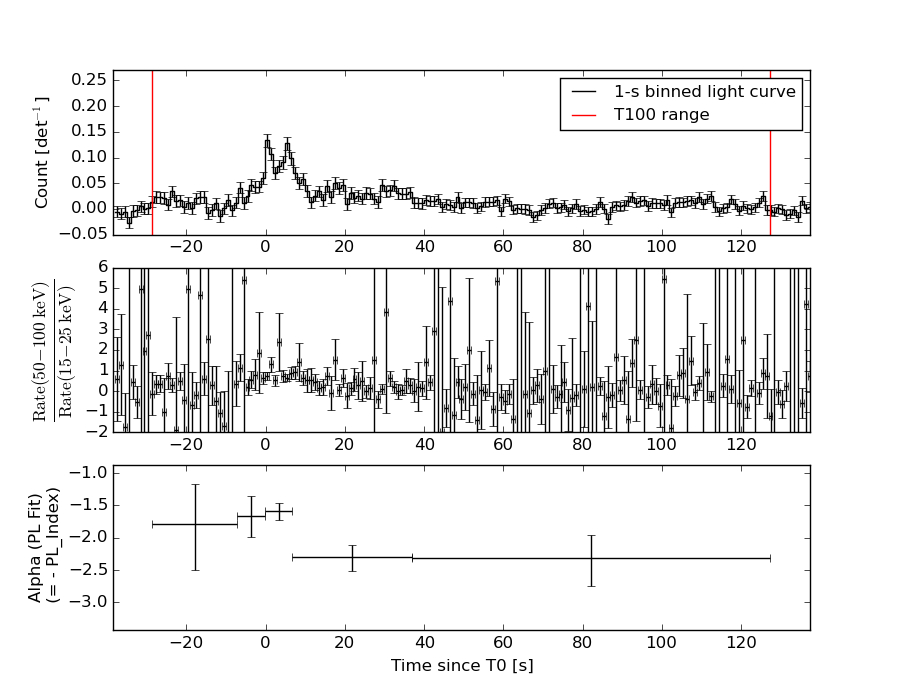
Light Curves
Note: The mask-weighted lightcurves have units of either count/det or counts/sec/det, where a det is 0.4 x 0.4 = 0.16 sq cm.
Full-time range; 1 s binning
Other quick-look light curves:
- 64 ms binning (zoomed)
- 16 ms binning (zoomed)
- 8 ms binning (zoomed)
- 2 ms binning (zoomed)
- SN=5 or 10 s binning (full-time range)
- Raw light curve
Spectra
- 64 ms binning (zoomed)
- 16 ms binning (zoomed)
- 8 ms binning (zoomed)
- 2 ms binning (zoomed)
- SN=5 or 10 s binning (full-time range)
- Raw light curve
Spectra
Notes:
- 1) The fitting includes the systematic errors.
- 2) When the burst includes telescope slew time periods, the fitting uses an average response file made from multiple 5-s response files through out the slew time plus single time preiod for the non-slew times, and weighted by the total counts in the corresponding time period using addrmf. An average response file is needed becuase a spectral fit using the pre-slew DRM will introduce some errors in both a spectral shape and a normalization if the PHA file contains a lot of the slew/post-slew time interval.
- 3) For fits to more complicated models (e.g. a power-law over a cutoff power-law), the BAT team has decided to require a chi-square improvement of more than 6 for each extra dof.
Time averaged spectrum fit using the average DRM
Power-law model
Time interval is from  -28.656 sec. to  127.388 sec.

Spectral model in power-law:
------------------------------------------------------------
Parameters  : value       lower 90%   higher 90%
Photon index: -2.08642     ( -0.14655   0.140826 )
Norm@50keV  : 1.01081E-03    ( -9.85773e-05   9.70878e-05 )
------------------------------------------------------------
#Fit statistic : Chi-Squared =          59.43 using 59 PHA bins.
# Reduced chi-squared =          1.043 for     57 degrees of freedom
# Null hypothesis probability =   3.870278e-01

Photon flux (15-150 keV)    in 156 sec: 0.157982 ( -0.011634  0.011637 ) ph/cm2/s
Energy fluence (15-150 keV)             : 1.46347e-06 ( -1.28707e-07  1.31028e-07 ) ergs/cm2
Cutoff power-law model
Time interval is from  -28.656 sec. to  127.388 sec.
Spectral model in the cutoff power-law:
------------------------------------------------------------
Parameters  : value       lower 90%   higher 90%
Photon index: -1.51611     ( -0.486524   0.633236 )
Epeak [keV] : 34.0586      ( -28.5271 13.2882 )
Norm@50keV  : 2.19457E-03    ( -0.00101245   0.00301218 )
------------------------------------------------------------
#Fit statistic : Chi-Squared =          56.15 using 59 PHA bins.
# Reduced chi-squared =          1.003 for     56 degrees of freedom
# Null hypothesis probability =   4.693750e-01

Photon flux (15-150 keV)    in 156 sec: 0.154279 ( -0.012094  0.012109 ) ph/cm2/s
Energy fluence (15-150 keV)             : 1.37285e-06 ( -1.47379e-07  1.53602e-07 ) ergs/cm2
1-s peak spectrum fit
Power-law model
Time interval is from    0.064 sec. to    1.064 sec.

Spectral model in power-law:
------------------------------------------------------------
Parameters  : value       lower 90%   higher 90%
Photon index: -1.19794     ( -0.265118   0.277639 )
Norm@50keV  : 9.17367E-03    ( -0.00130445   0.00130125 )
------------------------------------------------------------
#Fit statistic : Chi-Squared =          67.54 using 59 PHA bins.
# Reduced chi-squared =          1.185 for     57 degrees of freedom
# Null hypothesis probability =   1.602513e-01

Photon flux (15-150 keV)    in 1 sec: 1.07650 ( -0.159918  0.16058 ) ph/cm2/s
Energy fluence (15-150 keV)             : 9.31344e-08 ( -1.45367e-08  1.46411e-08 ) ergs/cm2
Cutoff power-law model
Time interval is from    0.064 sec. to    1.064 sec.
Spectral model in the cutoff power-law:
------------------------------------------------------------
Parameters  : value       lower 90%   higher 90%
Photon index: -1.21128     ( -0.251231   0.296035 )
Epeak [keV] : 9999.36      ( -9999.36 -9999.36 )
Norm@50keV  : 9.21875E-03    ( -0.00130564   0.00130615 )
------------------------------------------------------------
#Fit statistic : Chi-Squared =          67.57 using 59 PHA bins.
# Reduced chi-squared =          1.207 for     56 degrees of freedom
# Null hypothesis probability =   1.382179e-01

Photon flux (15-150 keV)    in 1 sec: 1.08038 ( -0.169504  0.16168 ) ph/cm2/s
Energy fluence (15-150 keV)             : 2.81546e-08 ( -7.0416e-09  5.90974e-09 ) ergs/cm2
Time-resolved spectra
Distribution
T90 vs. Hardness ratio plot
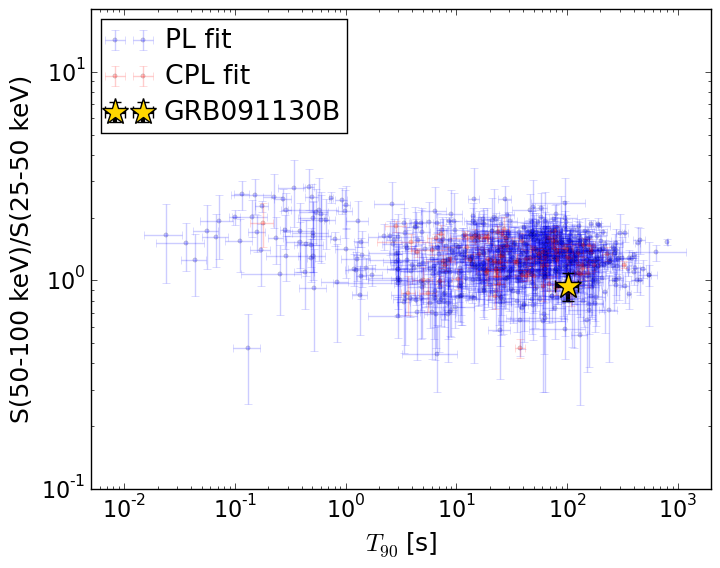
T90                                   = 101.76 sec.
Hardness ratio (energy fluence ratio) = 0.941889899241
S(15-50 keV) vs. S(50-150 keV) plot
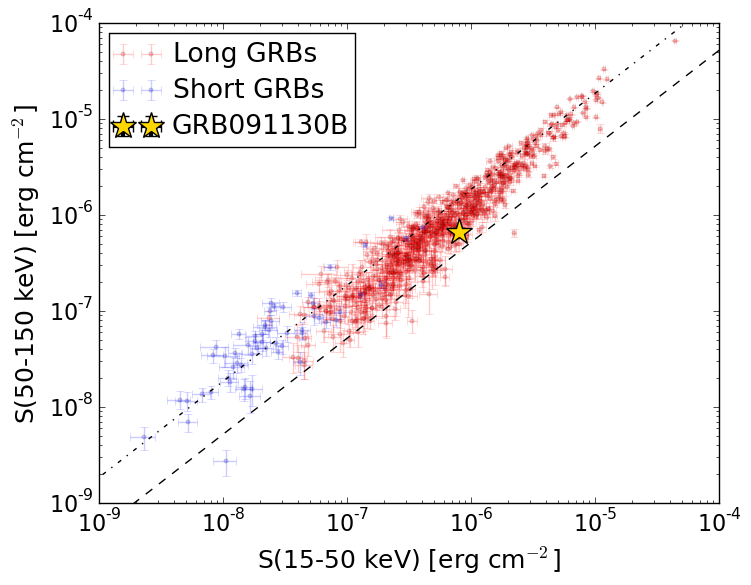
S(15-50 keV)  = 8.014723e-07
S(50-150 keV) = 6.620027e-07
The dash-dotted line and the dashed line traces the fluences calculated from the Band function with Epeak = 15 and 150 keV, respectively. Both lines assume a canonical values of alpha = -1 and beta = -2.5.
Mask shadow pattern
IMX = 5.421540797947368E-01, IMY = -7.014620699431262E-02
Spacecraft aspect plot
Bright source in the pre-burst/pre-slew/post-slew images
Pre-burst image of 15-350 keV band
Time interval of the image:
-339.379360 -28.656000

# RAcent  DECcent POSerr Theta    Phi  PeakCts   SNR AngSep     Name
#  [deg]    [deg]    ['] [deg]  [deg]                   [']
254.3775  35.3279    4.0  13.1  178.2   0.6683   2.9    4.0	Her X-1
268.3635  -1.4614   23.4  46.7 -133.0   0.3896   0.5    0.6	SW J1753.5-0127
288.7960  10.9504    3.0  51.9 -163.9   2.5593   3.9    0.3	GRS 1915+105
299.5890  35.1979    0.8  49.1  162.2  11.1291  14.6    0.2	Cyg X-1
275.9653   6.6619    4.4  45.2 -148.4   1.3589   2.6 ------	UNKNOWN
Pre-slew background subtracted image of 15-350 keV band
Time interval of the image:
-28.656000 18.220590

# RAcent  DECcent POSerr Theta    Phi  PeakCts   SNR AngSep     Name
#  [deg]    [deg]    ['] [deg]  [deg]                   [']
254.3034  35.5102    0.0  13.0  177.4  -0.0986  -1.4   12.6	Her X-1
268.2707  -1.4707    9.9  46.7 -132.9  -0.2851  -1.2    5.9	SW J1753.5-0127
288.7640  11.0535  104.6  51.8 -164.0   0.0224   0.1    6.8	GRS 1915+105
299.6261  35.0224    5.7  49.1  162.4  -0.4305  -2.0   10.9	Cyg X-1
242.3945  74.8604    2.9  39.0   92.2   1.1489   3.9 ------	UNKNOWN
300.7114  27.8998    2.3  52.7  170.4   1.3538   5.1 ------	UNKNOWN
203.1473  34.0869    0.6  28.7    7.4   1.6697  20.5 ------	UNKNOWN
Post-slew image of 15-350 keV band
Time interval of the image:
74.020580 231.820600

# RAcent  DECcent POSerr Theta    Phi  PeakCts   SNR AngSep     Name
#  [deg]    [deg]    ['] [deg]  [deg]                   [']
254.6151  35.4778   51.1  41.9 -153.7  -0.0539  -0.2   11.2	Her X-1
152.2945  33.7493    2.2  41.7   58.0   2.8145   5.2 ------	UNKNOWN
150.3884  16.8890    2.9  50.0   37.2   2.7370   4.0 ------	UNKNOWN
201.2718  76.3757    2.5  42.3  132.9   1.8695   4.6 ------	UNKNOWN
167.5259  13.8491    2.3  38.0   20.1   1.0255   5.0 ------	UNKNOWN
163.2046  -8.2054    2.7  56.7    2.9   3.3845   4.3 ------	UNKNOWN
268.4179  42.9631    2.6  50.6 -167.1   1.4573   4.5 ------	UNKNOWN
266.6114  24.8992    4.6  55.2 -145.1   2.1058   2.5 ------	UNKNOWN
256.5054  19.2980    3.6  49.4 -133.4   1.9762   3.2 ------	UNKNOWN