Analysis Summary
Notes:
- 1) No attempt has been made to eliminate the non-significant decimal places.
- 2) This batgrbproduct analysis is done using the HEASARC data.
- 3) This batgrbproduct analysis is using the flight position for the mask-weighting calculation.
======================================================================
BAT GRB EVENT DATA PROCESSING REPORT
Process Script Ver: batgrbproduct v2.46
Process Start Time: Sun Jan 19 12:28:05 EST 2014
Host Name: batevent1
Current Working Dir: /local/data/batevent/batevent_reproc/trigger378554
======================================================================
Trigger: 00378554 Segment: 000
BAT Trigger Time: 281954765.888 [s; MET]
Trigger Stop: 281954766.912 [s; MET]
UTC: 2009-12-08T08:46:00.559040 [includes UTCF correction]
Where From?: TDRSS position message
BAT
RA: 0.274140327777107 Dec: 65.6736677782883 [deg; J2000]
Catalogged Source?: NO
Point Source?: YES
GRB Indicated?: YES [ by BAT flight software ]
Image S/N Ratio: 14.41
Image Trigger?: NO
Rate S/N Ratio: 55.4707129934347 [ if not an image trigger ]
Image S/N Ratio: 14.41
Analysis Position: [ source = BAT ]
RA: 0.274140327777107 Dec: 65.6736677782883 [deg; J2000]
Refined Position: [ source = BAT pre-slew burst ]
RA: 0.274380074759634 Dec: 65.6700083731657 [deg; J2000]
{ 00h 01m 05.9s , +65d 40' 12.0" }
+/- 1.23989208867154 [arcmin] (estimated 90% radius based on SNR)
+/- 0.555667893092608 [arcmin] (formal 1-sigma fit error)
SNR: 22.372412818193
Angular difference between the analysis and refined position is 0.219644 arcmin
Partial Coding Fraction: 0.8828125 [ including projection effects ]
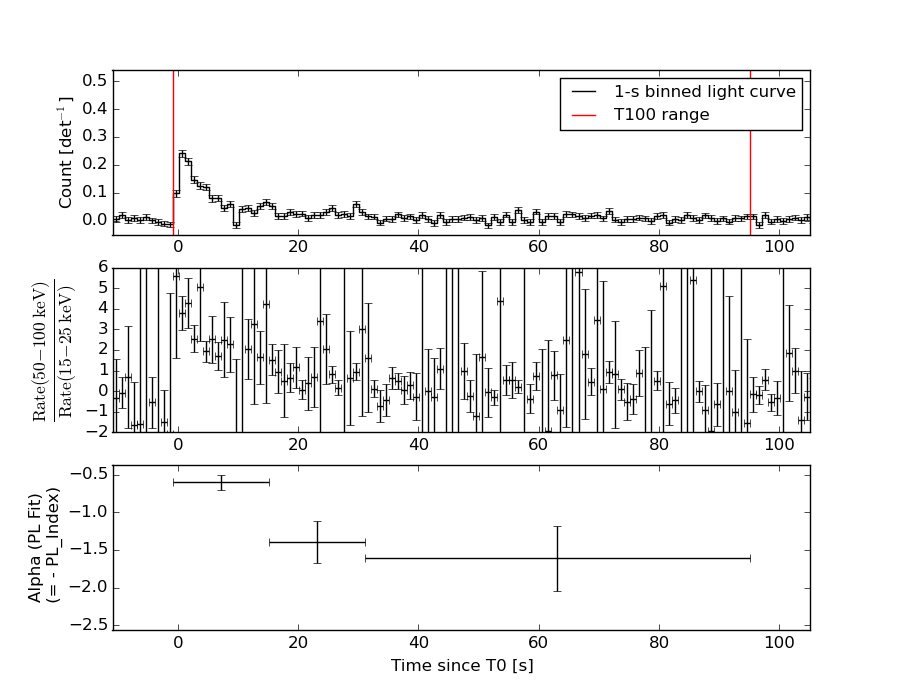
Duration
T90: 80 +/- 16
Measured from: -0.888000011444092
to: 79.1119999885559 [s; relative to TRIGTIME]
T50: 32 +/- 16
Measured from: -0.888000011444092
to: 31.1119999885559 [s; relative to TRIGTIME]
Fluence
Peak Flux (peak 1 second)
Measured from: 6.61199998855591
to: 7.61199998855591 [s; relative to TRIGTIME]
Total Fluence
Measured from: -0.888000011444092
to: 95.1119999885559 [s; relative to TRIGTIME]
Band 1 Band 2 Band 3 Band 4
15-25 25-50 50-100 100-350 keV
Total 0.516962 0.718366 0.872866 0.384345
0.052889 0.055521 0.050568 0.044644 [error]
Peak 0.011883 0.028186 0.024974 0.008258
0.005615 0.006118 0.005631 0.004745 [error]
[ fluence units of on-axis counts / fully illuminated detector ]
======================================================================
====== Table of the duration information =============================
Value tstart tstop
T100 96.000 -0.888 95.112
T90 80.000 -0.888 79.112
T50 32.000 -0.888 31.112
Peak 1.000 6.612 7.612
====== Spectral Analysis Summary =====================================
Model : spectral model: simple power-law (PL) and cutoff power-law (CPL)
Ph_index : photon index: E^{Ph_index}
Ph_90err : 90% error of the photon index
Epeak : Epeak in keV
Epeak_90err: 90% error of Epeak
Norm : normalization at 50 keV in both the PL model and CPL model
Nomr_90err : 90% error of the normalization
chi2 : Chi-Squared
dof : degree of freedo
=== Time-averaged spectral analysis ===
(Best model with acceptable fit: PL)
Model Ph_index Ph_90err_low Ph_90err_hi Epeak Epeak_90err_low Epeak_90err_hi Norm Nomr_90err_low Norm_90err_hi chi2 dof
PL -0.943 -0.129 0.134 - - - 1.70e-03 -1.19e-04 1.18e-04 59.300 57
CPL -0.949 -0.118 0.229 9999.360 -9999.360 -9999.360 1.72e-03 -1.23e-04 1.08e-04 59.430 56
=== 1-s peak spectral analysis ===
(Best model with acceptable fit: PL)
Model Ph_index Ph_90err_low Ph_90err_hi Epeak Epeak_90err_low Epeak_90err_hi Norm Nomr_90err_low Norm_90err_hi chi2 dof
PL -1.072 -0.388 0.414 - - - 5.01e-03 -1.18e-03 1.18e-03 52.470 57
CPL -0.286 -1.114 2.314 115.833 -115.833 -115.833 1.19e-02 -1.19e-02 1.33e-01 51.750 56
=== Fluence/Peak Flux Summary ===
Model Band1 Band2 Band3 Band4 Band5 Total
15-25 25-50 50-100 100-350 15-150 15-350 keV
Fluence PL 1.24e-07 3.21e-07 6.69e-07 3.55e-06 1.80e-06 4.67e-06 erg/cm2
90%_error_low -1.91e-08 -2.96e-08 -4.76e-08 -5.95e-07 -1.26e-07 -6.12e-07 erg/cm2
90%_error_hi 2.03e-08 2.91e-08 4.73e-08 6.85e-07 1.27e-07 6.92e-07 erg/cm2
Peak flux PL 1.37e-01 1.78e-01 1.69e-01 2.85e-01 5.80e-01 7.70e-01 ph/cm2/s
90%_error_low -5.79e-02 -5.14e-02 -4.42e-02 -1.29e-01 -1.40e-01 -1.90e-01 ph/cm2/s
90%_error_hi 6.69e-02 5.00e-02 4.35e-02 1.86e-01 1.40e-01 2.02e-01 ph/cm2/s
Fluence CPL 1.24e-07 3.22e-07 6.53e-07 3.60e-06 1.81e-06 4.32e-06 erg/cm2
90%_error_low -1.92e-08 -3.13e-08 -3.12e-08 -1.08e-06 -1.34e-07 -4.34e-07 erg/cm2
90%_error_hi 2.03e-08 2.99e-08 6.38e-08 1.95e-07 1.19e-07 1.01e-06 erg/cm2
Peak flux CPL 1.16e-01 1.90e-01 1.83e-01 1.31e-01 5.64e-01 6.20e-01 ph/cm2/s
90%_error_low -6.69e-02 -5.79e-02 -5.13e-02 -1.31e-01 -1.44e-01 -1.87e-01 ph/cm2/s
90%_error_hi 7.75e-02 6.22e-02 5.43e-02 1.89e-01 1.44e-01 2.63e-01 ph/cm2/s
======================================================================
Image
Pre-slew 15.0-350.0 keV image (Event data)
#   RAcent    DECcent   POSerr    Theta     Phi              Peak Cts       SNR   Name
    0.2744    65.6700   0.0086    25.7513  -177.7297         2.6061020     22.372 TRIG_00378554

Foreground time interval of the image:
 -0.888  95.112 (delta_t =  96.000 [sec])
Background time interval of the image:
-703.487 -648.857 (delta_t =  54.630 [sec])
-239.888  -0.888 (delta_t = 239.000 [sec])
Light Curves
Note: The mask-weighted lightcurves have units of either count/det or counts/sec/det, where a det is 0.4 x 0.4 = 0.16 sq cm.
Full-time range; 1 s binning
Other quick-look light curves:
- 64 ms binning (zoomed)
- 16 ms binning (zoomed)
- 8 ms binning (zoomed)
- 2 ms binning (zoomed)
- SN=5 or 10 s binning (full-time range)
- Raw light curve
Spectra
- 64 ms binning (zoomed)
- 16 ms binning (zoomed)
- 8 ms binning (zoomed)
- 2 ms binning (zoomed)
- SN=5 or 10 s binning (full-time range)
- Raw light curve
Spectra
Notes:
- 1) The fitting includes the systematic errors.
- 2) When the burst includes telescope slew time periods, the fitting uses an average response file made from multiple 5-s response files through out the slew time plus single time preiod for the non-slew times, and weighted by the total counts in the corresponding time period using addrmf. An average response file is needed becuase a spectral fit using the pre-slew DRM will introduce some errors in both a spectral shape and a normalization if the PHA file contains a lot of the slew/post-slew time interval.
- 3) For fits to more complicated models (e.g. a power-law over a cutoff power-law), the BAT team has decided to require a chi-square improvement of more than 6 for each extra dof.
Time averaged spectrum fit using the average DRM
Power-law model

Time interval is from   -0.888 sec. to   95.112 sec.

Spectral model in power-law:
------------------------------------------------------------
Parameters  : value       lower 90%   higher 90%
Photon index: -0.942703     ( -0.129423   0.133573 )
Norm@50keV  : 1.70095E-03    ( -0.000119138   0.000117909 )
------------------------------------------------------------
#Fit statistic : Chi-Squared =          59.30 using 59 PHA bins.
# Reduced chi-squared =          1.040 for     57 degrees of freedom
# Null hypothesis probability =   3.918116e-01

Photon flux (15-150 keV)    in 96 sec: 0.195379 ( -0.013811  0.0139 ) ph/cm2/s
Energy fluence (15-150 keV)             : 1.80319e-06 ( -1.26348e-07  1.26741e-07 ) ergs/cm2
Cutoff power-law model
Time interval is from   -0.888 sec. to   95.112 sec.
Spectral model in the cutoff power-law:
------------------------------------------------------------
Parameters  : value       lower 90%   higher 90%
Photon index: -0.936776     ( -0.119146   0.22858 )
Epeak [keV] : 1.00000E+04      ( -10000 -10000 )
Norm@50keV  : 1.71164E-03    ( -0.000119466   0.000112087 )
------------------------------------------------------------
#Fit statistic : Chi-Squared =          59.41 using 59 PHA bins.
# Reduced chi-squared =          1.061 for     56 degrees of freedom
# Null hypothesis probability =   3.524994e-01

Photon flux (15-150 keV)    in 96 sec: 0.195327 ( -0.013847  0.013869 ) ph/cm2/s
Energy fluence (15-150 keV)             : 1.8106e-06 ( -1.34493e-07  1.1853e-07 ) ergs/cm2
1-s peak spectrum fit
Power-law model
Time interval is from    6.612 sec. to    7.612 sec.

Spectral model in power-law:
------------------------------------------------------------
Parameters  : value       lower 90%   higher 90%
Photon index: -1.07206     ( -0.387892   0.413913 )
Norm@50keV  : 5.01076E-03    ( -0.00118325   0.00118023 )
------------------------------------------------------------
#Fit statistic : Chi-Squared =          52.47 using 59 PHA bins.
# Reduced chi-squared =         0.9206 for     57 degrees of freedom
# Null hypothesis probability =   6.453133e-01

Photon flux (15-150 keV)    in 1 sec: 0.579744 ( -0.139535  0.140229 ) ph/cm2/s
Energy fluence (15-150 keV)             : 5.28701e-08 ( -1.34325e-08  1.36251e-08 ) ergs/cm2
Cutoff power-law model
Time interval is from    6.612 sec. to    7.612 sec.
Spectral model in the cutoff power-law:
------------------------------------------------------------
Parameters  : value       lower 90%   higher 90%
Photon index: -0.286223     ( -1.11414   2.31392 )
Epeak [keV] : 115.833      ( -115.834 -115.834 )
Norm@50keV  : 1.19483E-02    ( -0.011948   0.133346 )
------------------------------------------------------------
#Fit statistic : Chi-Squared =          51.75 using 59 PHA bins.
# Reduced chi-squared =         0.9241 for     56 degrees of freedom
# Null hypothesis probability =   6.363265e-01

Photon flux (15-150 keV)    in 1 sec: 0.563586 ( -0.143891  0.143999 ) ph/cm2/s
Energy fluence (15-150 keV)             : 5.00991e-08 ( -1.50997e-08  1.48346e-08 ) ergs/cm2
Time-resolved spectra
Distribution
T90 vs. Hardness ratio plot
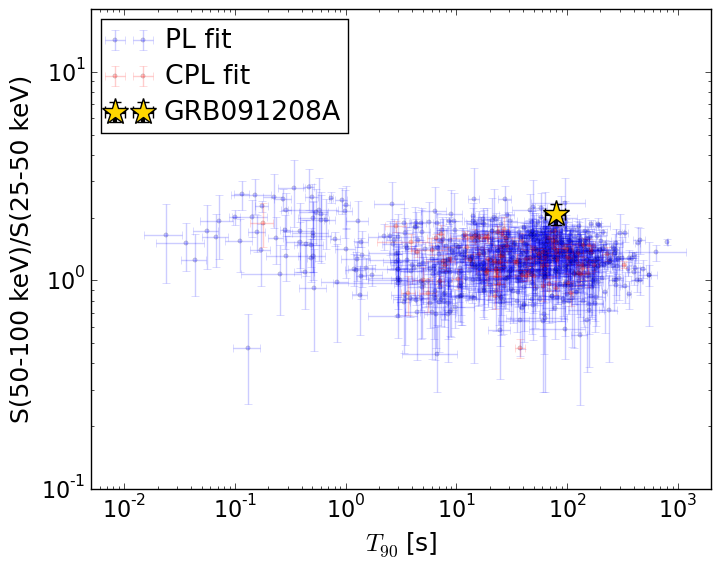
T90                                   = 80.0 sec.
Hardness ratio (energy fluence ratio) = 2.08103821224
S(15-50 keV) vs. S(50-150 keV) plot
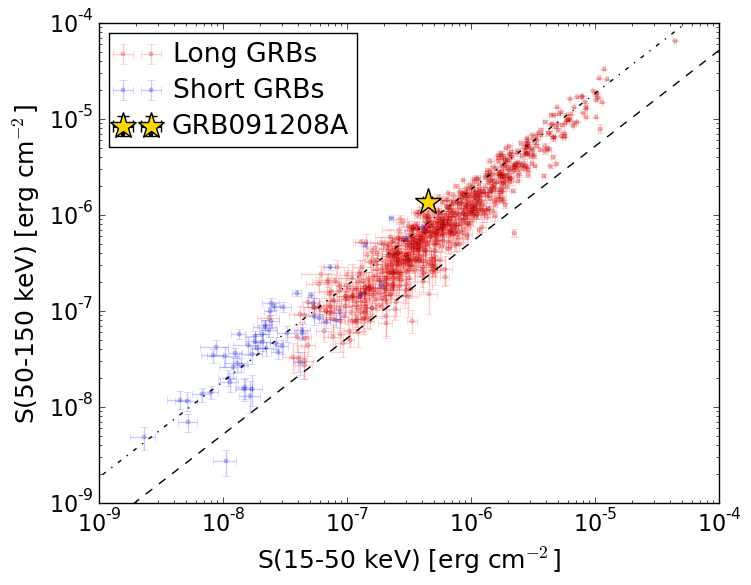
S(15-50 keV)  = 4.453989e-07
S(50-150 keV) = 1.3577814e-06
The dash-dotted line and the dashed line traces the fluences calculated from the Band function with Epeak = 15 and 150 keV, respectively. Both lines assume a canonical values of alpha = -1 and beta = -2.5.
Mask shadow pattern
IMX = -4.819923381330219E-01, IMY = 1.910860112550748E-02
Spacecraft aspect plot
Bright source in the pre-burst/pre-slew/post-slew images
Pre-burst image of 15-350 keV band
Time interval of the image:
-703.487400 -648.857200
-239.888000 -0.888000

# RAcent  DECcent POSerr Theta    Phi  PeakCts   SNR AngSep     Name
#  [deg]    [deg]    ['] [deg]  [deg]                   [']
326.1059  38.2206    7.9  55.0 -150.1   1.5729   1.5    6.8	Cyg X-2
342.3551  33.3035    3.3  59.1 -166.1   5.1305   3.4 ------	UNKNOWN
Pre-slew background subtracted image of 15-350 keV band
Time interval of the image:
-0.888000 95.112000

# RAcent  DECcent POSerr Theta    Phi  PeakCts   SNR AngSep     Name
#  [deg]    [deg]    ['] [deg]  [deg]                   [']
326.0612  38.2905   15.5  55.0 -150.0  -0.3688  -0.7    5.5	Cyg X-2
  0.2744  65.6700    0.5  25.8 -177.7   2.6057  22.4 ------	UNKNOWN
177.6187  30.4527    2.3  58.3   -6.0   3.4612   5.1 ------	UNKNOWN
205.9857  35.8590    2.3  55.0  -34.9   2.9242   4.9 ------	UNKNOWN
Post-slew image of 15-350 keV band
Time interval of the image:
325.012600 782.231400
840.112000 962.224800

# RAcent  DECcent POSerr Theta    Phi  PeakCts   SNR AngSep     Name
#  [deg]    [deg]    ['] [deg]  [deg]                   [']
254.6046  35.5200    0.0  41.8 -152.4  -0.3782  -0.7   12.8	Her X-1
156.5861   8.2700    2.9  49.9   24.7   4.8999   3.9 ------	UNKNOWN
265.5263  54.5030    2.4  47.2  179.3   3.0122   4.9 ------	UNKNOWN
172.4380 -15.3376    3.1  57.4   -9.5   5.8333   3.7 ------	UNKNOWN
268.4392  40.4504    2.2  51.2 -162.7   4.2103   5.3 ------	UNKNOWN
276.4399  35.3101    5.3  58.8 -159.2   5.9542   2.2 ------	UNKNOWN