Analysis Summary
Notes:
- 1) No attempt has been made to eliminate the non-significant decimal places.
- 2) This batgrbproduct analysis is done using the HEASARC data.
- 3) This batgrbproduct analysis is using the flight position for the mask-weighting calculation.
======================================================================
                  BAT GRB EVENT DATA PROCESSING REPORT
    Process Script Ver: batgrbproduct v2.46
    Process Start Time: Sun Jan 19 12:24:06 EST 2014
             Host Name: batevent1
   Current Working Dir: /local/data/batevent/batevent_reproc/trigger378559
======================================================================

  Trigger: 00378559      Segment: 000

  BAT Trigger Time: 281958603.328   [s; MET]
      Trigger Stop: 281958604.352   [s; MET]
               UTC: 2009-12-08T09:49:57.998900    [includes UTCF correction]
       Where From?: TDRSS position message

  BAT
    RA: 29.4105366032275   Dec: 16.8826915846662  [deg; J2000]

     Catalogged Source?: NO
     Point Source?:      YES
     GRB Indicated?:     YES    [ by BAT flight software ]
     Image S/N Ratio:    9.31
     Image Trigger?:     NO
     Rate S/N Ratio:     24.576411454889  [ if not an image trigger ]
     Image S/N Ratio:    9.31

  Analysis Position:   [ source = BAT ]
    RA: 29.4105366032275   Dec: 16.8826915846662  [deg; J2000]

  Refined Position:   [ source = BAT pre-slew burst ]
    RA: 29.4125195602348   Dec: 16.87937265713  [deg; J2000]
        { 01h 57m 39.0s , +16d 52' 45.7" }
         +/- 1.21896877451421 [arcmin] (estimated 90% radius based on SNR)
         +/- 0.627453592362298 [arcmin] (formal 1-sigma fit error)
    SNR: 22.923020145538

  Angular difference between the analysis and refined position is 0.229384 arcmin

  Partial Coding Fraction: 0.1054688    [ including projection effects ]

  Duration
     T90: 14.8000000119209 +/- 3.36083803454341
        Measured from: 0.319999992847443
                   to: 15.1200000047684     [s; relative to TRIGTIME]
     T50: 5.77600002288818 +/- 3.1238949769423
        Measured from: 3.68000000715256
                   to: 9.45600003004074     [s; relative to TRIGTIME]


  Fluence
     Peak Flux  (peak 1 second)
        Measured from: 8.16399997472763
                   to: 9.16399997472763     [s; relative to TRIGTIME]
     Total Fluence
        Measured from: -0.192000031471252
                   to: 19.311999976635     [s; relative to TRIGTIME]

             Band 1     Band 2     Band 3     Band 4
              15-25      25-50     50-100    100-350     keV
 Total     1.365682   1.918675   1.278894   0.301717
           0.090762   0.096773   0.087697   0.070482 [error]
 Peak      0.402375   0.576094   0.494038   0.169270
           0.030710   0.037172   0.032948   0.025651 [error]

     [ fluence units of on-axis counts / fully illuminated detector ]

======================================================================


====== Table of the duration information =============================

        Value   tstart    tstop
T100   19.504   -0.192   19.312
T90    14.800    0.320   15.120
T50     5.776    3.680    9.456
Peak    1.000    8.164    9.164


====== Spectral Analysis Summary =====================================

Model      : spectral model: simple power-law (PL) and cutoff power-law (CPL)
Ph_index   : photon index: E^{Ph_index}
Ph_90err   : 90% error of the photon index
Epeak      : Epeak in keV
Epeak_90err: 90% error of Epeak
Norm       : normalization at 50 keV in both the PL model and CPL model
Nomr_90err : 90% error of the normalization
chi2       : Chi-Squared
dof        : degree of freedo

=== Time-averaged spectral analysis ===
(Best model with acceptable fit: PL)

Model Ph_index Ph_90err_low Ph_90err_hi  Epeak  Epeak_90err_low  Epeak_90err_hi  Norm       Nomr_90err_low    Norm_90err_hi    chi2    dof
PL      -1.761    -0.109      0.107       -           -               -         1.78e-02     -1.12e-03          1.11e-03      42.460   57
CPL     -1.581    -0.272      0.426      116.051     -51.050      -116.051      2.19e-02     -5.13e-03          1.37e-02      41.850   56


=== 1-s peak spectral analysis ===
(Best model with acceptable fit: PL)

Model Ph_index Ph_90err_low Ph_90err_hi  Epeak  Epeak_90err_low  Epeak_90err_hi  Norm       Nomr_90err_low    Norm_90err_hi    chi2    dof
PL      -1.492     -0.115     0.114       -           -               -         1.17e-01     -7.82e-03          7.80e-03      42.730   57
CPL     -1.417     -0.182     0.403      417.591    -417.591      -417.591      1.28e-01     -1.77e-02          6.84e-02      42.780   56


=== Fluence/Peak Flux Summary ===

              Model    Band1     Band2     Band3     Band4     Band5     Total
                       15-25     25-50    50-100    100-350    15-150    15-350    keV
Fluence         PL   5.66e-07  8.87e-07  1.05e-06  2.39e-06  3.20e-06  4.89e-06   erg/cm2
      90%_error_low -5.58e-08 -5.43e-08 -8.74e-08 -3.98e-07 -2.06e-07 -4.76e-07   erg/cm2
      90%_error_hi   5.75e-08  5.42e-08  8.72e-08  4.46e-07  2.07e-07  5.11e-07   erg/cm2
Peak flux       PL   4.79e+00  4.85e+00  3.45e+00  3.90e+00  1.46e+01  1.70e+01   ph/cm2/s
      90%_error_low -5.70e-01 -3.61e-01 -2.78e-01 -6.14e-01 -1.02e+00 -1.13e+00   ph/cm2/s
      90%_error_hi   5.91e-01  3.58e-01  2.75e-01  6.77e-01  1.02e+00  1.13e+00   ph/cm2/s

Fluence        CPL   5.49e-07  9.03e-07  1.06e-06  1.83e-06  3.16e-06  4.34e-06   erg/cm2
      90%_error_low -6.67e-08 -6.39e-08 -9.23e-08 -7.90e-07 -2.23e-07 -8.19e-07   erg/cm2
      90%_error_hi   6.62e-08  6.55e-08  9.40e-08  6.87e-07  2.22e-07  7.57e-07   erg/cm2
Peak flux      CPL   4.80e+00  4.85e+00  3.45e+00  3.87e+00  1.46e+01  1.69e+01   ph/cm2/s
      90%_error_low -7.28e-01 -3.68e-01 -2.83e-01 -1.49e+00 -1.05e+00 -1.81e+00   ph/cm2/s
      90%_error_hi   4.49e-01  4.08e-01  3.32e-01  4.22e-01  9.94e-01  1.24e+00   ph/cm2/s

======================================================================
Image
Pre-slew 15.0-350.0 keV image (Event data)
#   RAcent    DECcent   POSerr    Theta     Phi              Peak Cts       SNR   Name
   29.4125    16.8794   0.0084    47.2977   146.6671         5.1794964     22.923 TRIG_00378559

Foreground time interval of the image:
 -0.192  15.973 (delta_t =  16.165 [sec])
Background time interval of the image:
-453.727 -365.232 (delta_t =  88.495 [sec])
-239.328  -0.192 (delta_t = 239.136 [sec])
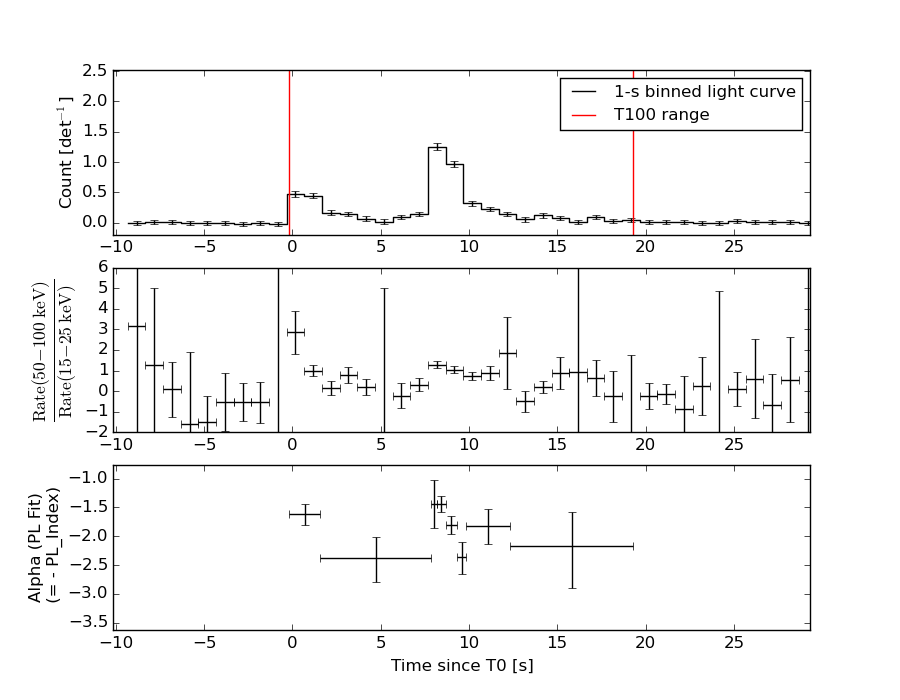
Light Curves
Note: The mask-weighted lightcurves have units of either count/det or counts/sec/det, where a det is 0.4 x 0.4 = 0.16 sq cm.
Full-time range; 1 s binning
Other quick-look light curves:
- 64 ms binning (zoomed)
- 16 ms binning (zoomed)
- 8 ms binning (zoomed)
- 2 ms binning (zoomed)
- SN=5 or 10 s binning (full-time range)
- Raw light curve
Spectra
- 64 ms binning (zoomed)
- 16 ms binning (zoomed)
- 8 ms binning (zoomed)
- 2 ms binning (zoomed)
- SN=5 or 10 s binning (full-time range)
- Raw light curve
Spectra
Notes:
- 1) The fitting includes the systematic errors.
- 2) When the burst includes telescope slew time periods, the fitting uses an average response file made from multiple 5-s response files through out the slew time plus single time preiod for the non-slew times, and weighted by the total counts in the corresponding time period using addrmf. An average response file is needed becuase a spectral fit using the pre-slew DRM will introduce some errors in both a spectral shape and a normalization if the PHA file contains a lot of the slew/post-slew time interval.
- 3) For fits to more complicated models (e.g. a power-law over a cutoff power-law), the BAT team has decided to require a chi-square improvement of more than 6 for each extra dof.
Time averaged spectrum fit using the average DRM
Power-law model

Time interval is from   -0.192 sec. to   19.312 sec.

Spectral model in power-law:
------------------------------------------------------------
Parameters  : value       lower 90%   higher 90%
Photon index: -1.76146     ( -0.108725   0.106852 )
Norm@50keV  : 1.77769E-02    ( -0.00111758   0.0011106 )
------------------------------------------------------------
#Fit statistic : Chi-Squared =          42.46 using 59 PHA bins.
# Reduced chi-squared =         0.7449 for     57 degrees of freedom
# Null hypothesis probability =   9.243062e-01

Photon flux (15-150 keV)    in 19.5 sec: 2.41409 ( -0.15017  0.15052 ) ph/cm2/s
Energy fluence (15-150 keV)             : 3.19724e-06 ( -2.0639e-07  2.07191e-07 ) ergs/cm2
Cutoff power-law model
Time interval is from   -0.192 sec. to   19.312 sec.
Spectral model in the cutoff power-law:
------------------------------------------------------------
Parameters  : value       lower 90%   higher 90%
Photon index: -1.58056     ( -0.271937   0.425905 )
Epeak [keV] : 116.051      ( -51.0511 -116.052 )
Norm@50keV  : 2.19486E-02    ( -0.00513069   0.0136971 )
------------------------------------------------------------
#Fit statistic : Chi-Squared =          41.85 using 59 PHA bins.
# Reduced chi-squared =         0.7473 for     56 degrees of freedom
# Null hypothesis probability =   9.200500e-01

Photon flux (15-150 keV)    in 19.5 sec: 2.39145 ( -0.15765  0.1579 ) ph/cm2/s
Energy fluence (15-150 keV)             : 3.15968e-06 ( -2.23421e-07  2.22169e-07 ) ergs/cm2
1-s peak spectrum fit
Power-law model
Time interval is from    8.164 sec. to    9.164 sec.

Spectral model in power-law:
------------------------------------------------------------
Parameters  : value       lower 90%   higher 90%
Photon index: -1.49174     ( -0.114824   0.114326 )
Norm@50keV  : 0.117335    ( -0.00781899   0.00780416 )
------------------------------------------------------------
#Fit statistic : Chi-Squared =          42.73 using 59 PHA bins.
# Reduced chi-squared =         0.7496 for     57 degrees of freedom
# Null hypothesis probability =   9.198363e-01

Photon flux (15-150 keV)    in 1 sec: 14.6161 ( -1.0181  1.0206 ) ph/cm2/s
Energy fluence (15-150 keV)             : 1.11476e-06 ( -7.94271e-08  7.96681e-08 ) ergs/cm2
Cutoff power-law model
Time interval is from    8.164 sec. to    9.164 sec.
Spectral model in the cutoff power-law:
------------------------------------------------------------
Parameters  : value       lower 90%   higher 90%
Photon index: -1.48892     ( -0.177393   0.407974 )
Epeak [keV] : 9955.20      ( -9459.43 -9459.43 )
Norm@50keV  : 0.117711    ( -0.00786311   0.0782724 )
------------------------------------------------------------
#Fit statistic : Chi-Squared =          42.73 using 59 PHA bins.
# Reduced chi-squared =         0.7630 for     56 degrees of freedom
# Null hypothesis probability =   9.040861e-01

Photon flux (15-150 keV)    in 1 sec: 14.6060 ( -1.0548  0.9943 ) ph/cm2/s
Energy fluence (15-150 keV)             : 1.11332e-06 ( -8.19132e-08  8.10531e-08 ) ergs/cm2
Time-resolved spectra
Distribution
T90 vs. Hardness ratio plot
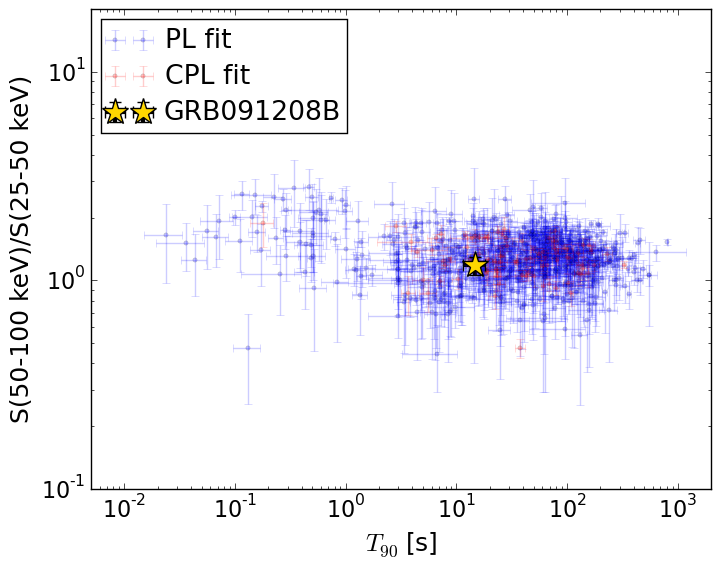
T90                                   = 14.8 sec.
Hardness ratio (energy fluence ratio) = 1.17983117038
S(15-50 keV) vs. S(50-150 keV) plot
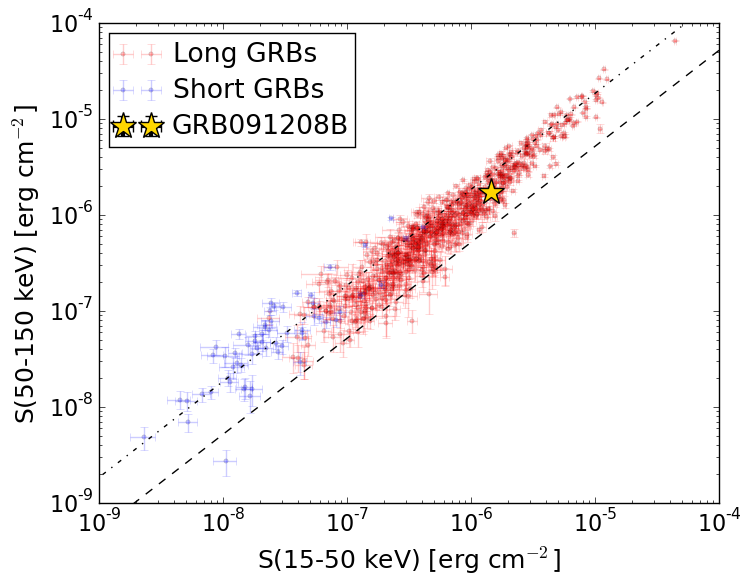
S(15-50 keV)  = 1.4531334e-06
S(50-150 keV) = 1.7440132e-06
The dash-dotted line and the dashed line traces the fluences calculated from the Band function with Epeak = 15 and 150 keV, respectively. Both lines assume a canonical values of alpha = -1 and beta = -2.5.
Mask shadow pattern
IMX = -9.053423314090794E-01, IMY = -5.954437284204772E-01
Spacecraft aspect plot
Bright source in the pre-burst/pre-slew/post-slew images
Pre-burst image of 15-350 keV band
Time interval of the image:
-453.727410 -365.232000
-239.328000 -0.192000

# RAcent  DECcent POSerr Theta    Phi  PeakCts   SNR AngSep     Name
#  [deg]    [deg]    ['] [deg]  [deg]                   [']
 38.0340  18.8896    2.1  44.6  135.5   4.4020   5.6 ------	UNKNOWN
105.2125  53.7996    2.2  32.8   26.9   1.5123   5.4 ------	UNKNOWN
335.8186  25.0125    3.8  57.2 -149.3   4.8785   3.1 ------	UNKNOWN
300.2533  63.0646    3.6  40.9  -92.5   3.7152   3.2 ------	UNKNOWN
Pre-slew background subtracted image of 15-350 keV band
Time interval of the image:
-0.192000 15.972600

# RAcent  DECcent POSerr Theta    Phi  PeakCts   SNR AngSep     Name
#  [deg]    [deg]    ['] [deg]  [deg]                   [']
109.0365  35.7719    2.2  48.3   41.8   0.9922   5.2 ------	UNKNOWN
 29.4125  16.8794    0.5  47.3  146.7   5.1779  22.9 ------	UNKNOWN
 44.4234  45.4999    2.5  17.9  124.7   0.2222   4.6 ------	UNKNOWN
 59.2486  65.1113    2.0   7.6   19.2   0.2217   5.7 ------	UNKNOWN
 11.0936  37.8282    2.3  31.6 -179.0   0.2729   5.0 ------	UNKNOWN
341.2310  69.7974    2.2  23.9  -98.0   0.2709   5.2 ------	UNKNOWN
Post-slew image of 15-350 keV band
Time interval of the image:
98.172600 605.172600

# RAcent  DECcent POSerr Theta    Phi  PeakCts   SNR AngSep     Name
#  [deg]    [deg]    ['] [deg]  [deg]                   [']
 68.1668  51.9850    3.0  46.5   47.8   5.0709   3.9 ------	UNKNOWN
 23.4799 -41.5552    3.7  58.7 -159.2   8.0419   3.1 ------	UNKNOWN
  6.2898 -29.9676    3.5  51.9 -138.7   6.6653   3.3 ------	UNKNOWN
356.8952 -12.3353    3.1  43.4 -114.6   6.5620   3.8 ------	UNKNOWN