Analysis Summary
Notes:
- 1) No attempt has been made to eliminate the non-significant decimal places.
- 2) This batgrbproduct analysis is done using the HEASARC data.
- 3) This batgrbproduct analysis is using the flight position for the mask-weighting calculation.
==========================================================================
           BAT GROUND-DETECTED GRB DATA PROCESSING REPORT
            (This burst occurred during telescope slew)
    Process Script Ver: batgrbproduct v2.46
    Process Start Time: Mon Nov 10 23:39:24 EST 2014
             Host Name: bat1
   Current Working Dir: /local/data/bat1/alien/Swift_3rdBATcatalog/event/batevent_reproc/GRB100115A
======================================================================

  Trigger: 00377179      Segment: 049

  BAT Trigger Time: 285246923.0
               UTC: 2010-01-15T11:15:17.560   [includes UTCF correction]
       Where From?: Ground analysis (best_duration.txt)
  NOTE: BAT trigger time for ground-detected burst during slew is the T100 start time.

  Refined Position:   [ source = BAT mosaic image ]
    RA: 3.34214477589476   Dec: -0.812361227887495  [deg; J2000]
        { 00h 13m 22.1s , 00d -48' -44.5" }
        +/- 1.73995739635 [arcmin] (estimated 90% radius based on SNR)
    SNR: 13.7895027412


  Angular difference between the analysis and refined position is Usage: arcmin

  Partial Coding Fraction: Unavailable because the burst occurred during slew.

  Duration
     T90: 4. +/- 1.4142135623731
        Measured from: 0
                   to: 4     [s; relative to TRIGTIME]
     T50: 1. +/- 1.
        Measured from: 1
                   to: 2     [s; relative to TRIGTIME]


====== Table of the duration information =============================

        Value   tstart    tstop
T100    4.000    0.000    4.000
T90     4.000    0.000    4.000
T50     1.000    1.000    2.000
Peak    1.000    1.000    2.000


====== Spectral Analysis Summary =====================================

Model      : spectral model: simple power-law (PL) and cutoff power-law (CPL)
Ph_index   : photon index: E^{Ph_index}
Ph_90err   : 90% error of the photon index
Epeak      : Epeak in keV
Epeak_90err: 90% error of Epeak
Norm       : normalization at 50 keV in both the PL model and CPL model
Nomr_90err : 90% error of the normalization
chi2       : Chi-Squared
dof        : degree of freedo

=== Time-averaged spectral analysis ===
(Best model with acceptable fit: PL)

Model Ph_index Ph_90err_low Ph_90err_hi  Epeak  Epeak_90err_low  Epeak_90err_hi  Norm       Nomr_90err_low    Norm_90err_hi    chi2    dof
PL      -1.746    -0.198      0.190       -           -               -         5.17e-03     -6.22e-04          6.08e-04      61.210   57
CPL     -1.625    -0.315      0.715      142.666     -91.486      -142.666      6.01e-03     -3.38e-03          8.33e-03      61.110   56


=== 1-s peak spectral analysis ===
(Best model with acceptable fit: N/A)

Model Ph_index Ph_90err_low Ph_90err_hi  Epeak  Epeak_90err_low  Epeak_90err_hi  Norm       Nomr_90err_low    Norm_90err_hi    chi2    dof
PL      -1.574     -0.196     0.191       -           -               -         1.08e-02     -1.29e-03          1.27e-03      73.810   57
CPL     -1.277     -0.462     0.768      116.839    -116.839      -116.839      1.55e-02        N/A               N/A         73.240   56


=== Fluence/Peak Flux Summary ===

              Model    Band1     Band2     Band3     Band4     Band5     Total
                       15-25     25-50    50-100    100-350    15-150    15-350    keV
Fluence         PL   3.33e-08  5.26e-08  6.28e-08  1.46e-07  1.91e-07  2.94e-07   erg/cm2
      90%_error_low -5.14e-09 -5.34e-09 -1.03e-08 -4.40e-08 -2.36e-08 -5.48e-08   erg/cm2
      90%_error_hi   5.31e-09  5.34e-09  1.04e-08  5.52e-08  2.41e-08  6.39e-08   erg/cm2
Peak flux       PL   4.77e-01  4.60e-01  3.09e-01  3.24e-01  1.38e+00  1.57e+00   ph/cm2/s
      90%_error_low -8.20e-02 -5.12e-02 -4.75e-02 -9.01e-02 -1.50e-01 -1.76e-01   ph/cm2/s
      90%_error_hi   8.54e-02  5.10e-02  4.73e-02  1.09e-01  1.50e-01  1.78e-01   ph/cm2/s

Fluence        CPL   3.28e-08  5.34e-08  6.29e-08  1.17e-07  1.89e-07  2.66e-07   erg/cm2
      90%_error_low -5.83e-09 -5.99e-09 -1.05e-08 -7.75e-08 -2.62e-08 -8.36e-08   erg/cm2
      90%_error_hi   5.32e-09  6.76e-09  1.07e-08  3.86e-08  2.57e-08  4.62e-08   erg/cm2
Peak flux      CPL   4.57e-01  4.75e-01  3.15e-01  2.24e-01  1.36e+00  1.47e+00   ph/cm2/s
      90%_error_low -9.54e-02 -6.00e-02 -5.04e-02     N/A   -1.54e-01 -2.09e-01   ph/cm2/s
      90%_error_hi   9.57e-02  6.31e-02  5.17e-02     N/A    1.54e-01  2.53e-01   ph/cm2/s

======================================================================
Image
Note1: The mosaic image is made with timebin = 0.05 s; energybin = 15-350 keV
Note2: The mosaic image uses Galactic coordinate.

#RAcent DECcent POSerr Theta  Phi  Peak_Cts  SNR Name
3.342 -0.812 0.005 25.707 12.211 0.081 13.790 UNKNOWN

Image time interval: 0.000 to 4.000 [sec]
Light Curves
Note: The mask-weighted lightcurves have units of either count/det or counts/sec/det, where a det is 0.4 x 0.4 = 0.16 sq cm.
Best duration plot
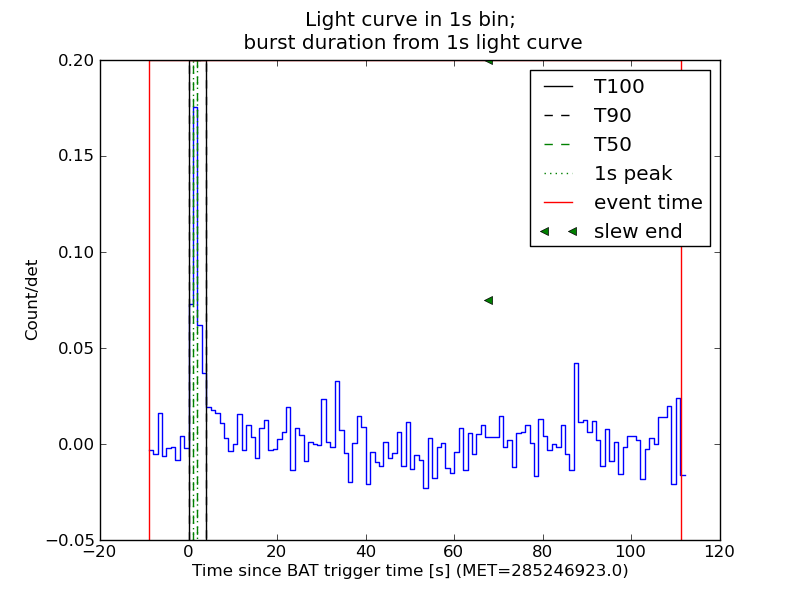
Full-time range; 1 s binning
Other quick-look light curves:
- 64 ms binning (zoomed)
- 16 ms binning (zoomed)
- 8 ms binning (zoomed)
- 2 ms binning (zoomed)
- SN=5 or 10 s binning (full-time range)
- Raw light curve
Spectra
- 64 ms binning (zoomed)
- 16 ms binning (zoomed)
- 8 ms binning (zoomed)
- 2 ms binning (zoomed)
- SN=5 or 10 s binning (full-time range)
- Raw light curve
Spectra
Notes:
- 1) The fitting includes the systematic errors.
- 2) When the burst includes telescope slew time periods, the fitting uses an average response file made from multiple 5-s response files through out the slew time plus single time preiod for the non-slew times, and weighted by the total counts in the corresponding time period using addrmf. An average response file is needed becuase a spectral fit using the pre-slew DRM will introduce some errors in both a spectral shape and a normalization if the PHA file contains a lot of the slew/post-slew time interval.
- 3) For fits to more complicated models (e.g. a power-law over a cutoff power-law), the BAT team has decided to require a chi-square improvement of more than 6 for each extra dof.
Time averaged spectrum fit using the average DRM
Power-law model

Time interval is from    0.000 sec. to    4.000 sec.

Spectral model in power-law:
------------------------------------------------------------
Parameters  : value       lower 90%   higher 90%
Photon index: -1.74621     ( -0.197868   0.189953 )
Norm@50keV  : 5.16790E-03    ( -0.00062182   0.000607509 )
------------------------------------------------------------
#Fit statistic : Chi-Squared =          61.21 using 59 PHA bins.
# Reduced chi-squared =          1.074 for     57 degrees of freedom
# Null hypothesis probability =   3.273036e-01

Photon flux (15-150 keV)    in 4 sec: 0.697846 ( -0.071004  0.071029 ) ph/cm2/s
Energy fluence (15-150 keV)             : 1.90814e-07 ( -2.36164e-08  2.40779e-08 ) ergs/cm2
Cutoff power-law model

Time interval is from    0.000 sec. to    4.000 sec.
Spectral model in the cutoff power-law:
------------------------------------------------------------
Parameters  : value       lower 90%   higher 90%
Photon index: -1.62461     ( -0.314549   0.714818 )
Epeak [keV] : 142.666      ( -91.4944 -142.674 )
Norm@50keV  : 6.01185E-03    ( -0.00337763   0.00832819 )
------------------------------------------------------------
#Fit statistic : Chi-Squared =          61.11 using 59 PHA bins.
# Reduced chi-squared =          1.091 for     56 degrees of freedom
# Null hypothesis probability =   2.975996e-01

Photon flux (15-150 keV)    in 4 sec: 0.694055 ( -0.073654  0.073246 ) ph/cm2/s
Energy fluence (15-150 keV)             : 1.88617e-07 ( -2.61667e-08  2.56624e-08 ) ergs/cm2
1-s peak spectrum fit
Power-law model

Time interval is from    1.000 sec. to    2.000 sec.

Spectral model in power-law:
------------------------------------------------------------
Parameters  : value       lower 90%   higher 90%
Photon index: -1.57387     ( -0.19604   0.190754 )
Norm@50keV  : 1.08067E-02    ( -0.00128554   0.00126628 )
------------------------------------------------------------
#Fit statistic : Chi-Squared =          73.81 using 59 PHA bins.
# Reduced chi-squared =          1.295 for     57 degrees of freedom
# Null hypothesis probability =   6.646230e-02

Photon flux (15-150 keV)    in 1 sec: 1.37774 ( -0.15004  0.1501 ) ph/cm2/s
Energy fluence (15-150 keV)             : 1.01414e-07 ( -1.30836e-08  1.32877e-08 ) ergs/cm2
Cutoff power-law model

Time interval is from    1.000 sec. to    2.000 sec.
Spectral model in the cutoff power-law:
------------------------------------------------------------
Parameters  : value       lower 90%   higher 90%
Photon index: -1.27687     ( -0.462081   0.767796 )
Epeak [keV] : 116.839      ( -116.839 -116.839 )
Norm@50keV  : 1.54928E-02    (     )
------------------------------------------------------------
#Fit statistic : Chi-Squared =          73.24 using 59 PHA bins.
# Reduced chi-squared =          1.308 for     56 degrees of freedom
# Null hypothesis probability =   6.076551e-02

Photon flux (15-150 keV)    in 1 sec: 1.36217 ( -0.15419  0.15401 ) ph/cm2/s
Energy fluence (15-150 keV)             : 9.89487e-08 ( -1.42045e-08  7.62744e-09 ) ergs/cm2
Time-resolved spectra

Distribution
T90 vs. Hardness ratio plot

T90                                   = 4.0 sec.
Hardness ratio (energy fluence ratio) = 1.19236776521
S(15-50 keV) vs. S(50-150 keV) plot

S(15-50 keV)  = 8.590121e-08
S(50-150 keV) = 1.0491424e-07
The dash-dotted line and the dashed line traces the fluences calculated from the Band function with Epeak = 15 and 150 keV, respectively. Both lines assume a canonical values of alpha = -1 and beta = -2.5.
Mask shadow pattern
Mask shadow pattern unavailable because this burst occurs during telescope slews.Spacecraft aspect plot
