Analysis Summary
Notes:
- 1) No attempt has been made to eliminate the non-significant decimal places.
- 2) This batgrbproduct analysis is done using the HEASARC data.
- 3) This batgrbproduct analysis is using the flight position for the mask-weighting calculation.
======================================================================
BAT GRB EVENT DATA PROCESSING REPORT
Process Script Ver: batgrbproduct v2.46
Process Start Time: Sun May 10 04:08:53 EDT 2015
Host Name: bat1
Current Working Dir: /local/data/bat1/alien/Swift_3rdBATcatalog/event/batevent_reproc/trigger383063
======================================================================
Trigger: 00383063 Segment: 000
BAT Trigger Time: 285618331.2 [s; MET]
Trigger Stop: 285618333.248 [s; MET]
UTC: 2010-01-19T18:25:25.746880 [includes UTCF correction]
Where From?: TDRSS position message
BAT
RA: 299.32651470397 Dec: -53.1602425157852 [deg; J2000]
Catalogged Source?: NO
Point Source?: YES
GRB Indicated?: YES [ by BAT flight software ]
Image S/N Ratio: 9.61
Image Trigger?: NO
Rate S/N Ratio: 40.8900966005217 [ if not an image trigger ]
Image S/N Ratio: 9.61
Analysis Position: [ source = BAT ]
RA: 299.32651470397 Dec: -53.1602425157852 [deg; J2000]
Refined Position: [ source = BAT pre-slew burst ]
RA: 299.306782100349 Dec: -53.1499545257311 [deg; J2000]
{ 19h 57m 13.6s , -53d 08' 59.8" }
+/- 1.17498692782387 [arcmin] (estimated 90% radius based on SNR)
+/- 0.467082704780608 [arcmin] (formal 1-sigma fit error)
SNR: 24.1585679621471
Angular difference between the analysis and refined position is 0.940786 arcmin
Partial Coding Fraction: 0.07617188 [ including projection effects ]
Duration
T90: 23.0679998993874 +/- 3.22292846748935
Measured from: -9.27599996328354
to: 13.7919999361038 [s; relative to TRIGTIME]
T50: 12.4119999408722 +/- 0.773749343250594
Measured from: -4.10799998044968
to: 8.30399996042252 [s; relative to TRIGTIME]
Fluence
Peak Flux (peak 1 second)
Measured from: 2.12000000476837
to: 3.12000000476837 [s; relative to TRIGTIME]
Total Fluence
Measured from: -15.7599999904633
to: 15.4520000219345 [s; relative to TRIGTIME]
Band 1 Band 2 Band 3 Band 4
15-25 25-50 50-100 100-350 keV
Total 2.674249 5.626869 6.445211 3.029499
0.157125 0.187296 0.190270 0.172979 [error]
Peak 0.116750 0.245954 0.418324 0.210456
0.030647 0.036639 0.042165 0.037190 [error]
[ fluence units of on-axis counts / fully illuminated detector ]
======================================================================
====== Table of the duration information =============================
Value tstart tstop
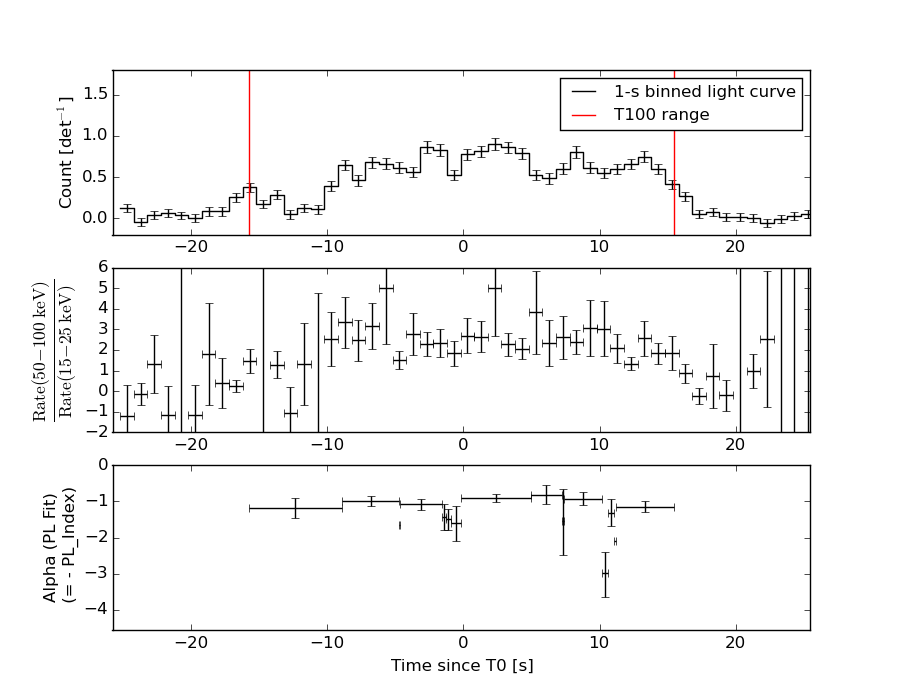
T100 31.212 -15.760 15.452
T90 23.068 -9.276 13.792
T50 12.412 -4.108 8.304
Peak 1.000 2.120 3.120
====== Spectral Analysis Summary =====================================
Model : spectral model: simple power-law (PL) and cutoff power-law (CPL)
Ph_index : photon index: E^{Ph_index}
Ph_90err : 90% error of the photon index
Epeak : Epeak in keV
Epeak_90err: 90% error of Epeak
Norm : normalization at 50 keV in both the PL model and CPL model
Nomr_90err : 90% error of the normalization
chi2 : Chi-Squared
dof : degree of freedo
=== Time-averaged spectral analysis ===
(Best model with acceptable fit: N/A)
Model Ph_index Ph_90err_low Ph_90err_hi Epeak Epeak_90err_low Epeak_90err_hi Norm Nomr_90err_low Norm_90err_hi chi2 dof
PL -1.011 -0.062 0.063 - - - 4.11e-02 -1.48e-03 1.47e-03 67.540 57
CPL -0.936 -0.101 0.249 877.049 -877.049 -877.049 4.42e-02 -1.68e-03 1.14e-02 67.260 56
=== 1-s peak spectral analysis ===
(Best model with acceptable fit: N/A)
Model Ph_index Ph_90err_low Ph_90err_hi Epeak Epeak_90err_low Epeak_90err_hi Norm Nomr_90err_low Norm_90err_hi chi2 dof
PL -0.652 -0.229 0.246 - - - 6.51e-02 -9.49e-03 9.15e-03 57.120 57
CPL -0.643 -0.231 0.249 10000.000 -10000.000 -10000.000 6.56e-02 -9.53e-03 7.90e-03 57.140 56
=== Fluence/Peak Flux Summary ===
Model Band1 Band2 Band3 Band4 Band5 Total
15-25 25-50 50-100 100-350 15-150 15-350 keV
Fluence PL 1.04e-06 2.58e-06 5.12e-06 2.53e-05 1.38e-05 3.40e-05 erg/cm2
90%_error_low -7.93e-08 -1.19e-07 -1.85e-07 -2.10e-06 -4.90e-07 -2.17e-06 erg/cm2
90%_error_hi 8.18e-08 1.18e-07 1.85e-07 2.24e-06 4.90e-07 2.28e-06 erg/cm2
Peak flux PL 1.97e-03 2.04e-02 1.92e-01 1.21e+01 7.95e-01 1.23e+01 ph/cm2/s
90%_error_low -1.50e-03 -1.47e-02 -1.27e-01 -1.21e+01 -5.02e-01 -1.23e+01 ph/cm2/s
90%_error_hi 2.35e-03 2.00e-02 1.49e-01 5.83e+00 5.50e-01 6.00e+00 ph/cm2/s
Fluence CPL 1.02e-06 2.59e-06 5.17e-06 2.31e-05 1.38e-05 3.19e-05 erg/cm2
90%_error_low -1.06e-07 -1.05e-07 -2.20e-07 -5.71e-06 -4.98e-07 -5.65e-06 erg/cm2
90%_error_hi 8.92e-08 1.22e-07 2.40e-07 1.53e-06 4.91e-07 2.80e-06 erg/cm2
Peak flux CPL 1.19e+00 2.01e+00 2.54e+00 6.99e+00 7.59e+00 1.26e+01 ph/cm2/s
90%_error_low N/A -4.73e-01 N/A N/A -1.26e+00 -3.55e+00 ph/cm2/s
90%_error_hi N/A 4.56e-01 N/A N/A 1.19e+00 1.62e+00 ph/cm2/s
======================================================================
Image
Pre-slew 15.0-350.0 keV image (Event data)
#   RAcent    DECcent   POSerr    Theta     Phi              Peak Cts       SNR   Name
  299.3068   -53.1500   0.0080    48.7835  -134.6594        19.4482090     24.159 TRIG_00383063

Foreground time interval of the image:
-15.760  15.452 (delta_t =  31.212 [sec])
Background time interval of the image:
-179.200 -15.760 (delta_t = 163.440 [sec])
Light Curves
Note: The mask-weighted lightcurves have units of either count/det or counts/sec/det, where a det is 0.4 x 0.4 = 0.16 sq cm.
Full-time range; 1 s binning
Other quick-look light curves:
- 64 ms binning (zoomed)
- 16 ms binning (zoomed)
- 8 ms binning (zoomed)
- 2 ms binning (zoomed)
- SN=5 or 10 s binning (full-time range)
- Raw light curve
Spectra
- 64 ms binning (zoomed)
- 16 ms binning (zoomed)
- 8 ms binning (zoomed)
- 2 ms binning (zoomed)
- SN=5 or 10 s binning (full-time range)
- Raw light curve
Spectra
Notes:
- 1) The fitting includes the systematic errors.
- 2) When the burst includes telescope slew time periods, the fitting uses an average response file made from multiple 5-s response files through out the slew time plus single time preiod for the non-slew times, and weighted by the total counts in the corresponding time period using addrmf. An average response file is needed becuase a spectral fit using the pre-slew DRM will introduce some errors in both a spectral shape and a normalization if the PHA file contains a lot of the slew/post-slew time interval.
- 3) For fits to more complicated models (e.g. a power-law over a cutoff power-law), the BAT team has decided to require a chi-square improvement of more than 6 for each extra dof.
Time averaged spectrum fit using the average DRM
Power-law model
Time interval is from  -15.760 sec. to   15.452 sec.

Spectral model in power-law:
------------------------------------------------------------
Parameters  : value       lower 90%   higher 90%
Photon index: -1.01102     ( -0.0622624   0.0629294 )
Norm@50keV  : 4.11139E-02    ( -0.00148044   0.00147483 )
------------------------------------------------------------
#Fit statistic : Chi-Squared =          67.54 using 59 PHA bins.
# Reduced chi-squared =          1.185 for     57 degrees of freedom
# Null hypothesis probability =   1.600924e-01

Photon flux (15-150 keV)    in 31.21 sec: 0.155307 0.164523 0.144737 0.126527 0.110773 9.72879E-02 8.58570E-02 7.62477E-02 6.82233E-02 6.15541E-02 5.60265E-02 5.14490E-02 4.76544E-02 4.45010E-02 4.18706E-02 3.96660E-02 3.78083E-02 3.62337E-02 3.48909E-02 3.37387E-02 3.27440E-02 3.18801E-02 3.11254E-02 3.04625E-02 2.98770E-02 2.93573E-02 2.88938E-02 2.84785E-02 2.81049E-02 2.77674E-02 2.74613E-02 2.71828E-02 2.69285E-02 2.66955E-02 2.64815E-02 2.61032E-02 2.57786E-02 2.54974E-02 2.52518E-02 2.48457E-02 2.18913E-02 (    ) ph/cm2/s
Energy fluence (15-150 keV)             : 1.3823e-05 ( -4.89548e-07  4.90396e-07 ) ergs/cm2
Cutoff power-law model
Time interval is from  -15.760 sec. to   15.452 sec.
Spectral model in the cutoff power-law:
------------------------------------------------------------
Parameters  : value       lower 90%   higher 90%
Photon index: -0.93553     ( -0.100726   0.249411 )
Epeak [keV] : 877.049      ( -877.05 -877.05 )
Norm@50keV  : 4.41586E-02    ( -0.0016783   0.011376 )
------------------------------------------------------------
#Fit statistic : Chi-Squared =          67.26 using 59 PHA bins.
# Reduced chi-squared =          1.201 for     56 degrees of freedom
# Null hypothesis probability =   1.441371e-01

Photon flux (15-150 keV)    in 31.21 sec:  (    ) ph/cm2/s
Energy fluence (15-150 keV)             : 1.37973e-05 ( -4.98446e-07  4.91448e-07 ) ergs/cm2
1-s peak spectrum fit
Power-law model
Time interval is from    2.120 sec. to    3.120 sec.

Spectral model in power-law:
------------------------------------------------------------
Parameters  : value       lower 90%   higher 90%
Photon index: -0.652143     ( -0.229083   0.246187 )
Norm@50keV  : 6.50581E-02    ( -0.00949041   0.00914798 )
------------------------------------------------------------
#Fit statistic : Chi-Squared =          57.12 using 59 PHA bins.
# Reduced chi-squared =          1.002 for     57 degrees of freedom
# Null hypothesis probability =   4.707830e-01

Photon flux (15-150 keV)    in 1 sec: 0.794778 ( -0.502035  0.550462 ) ph/cm2/s
Energy fluence (15-150 keV)             : 8.11802e-07 ( -1.01374e-07  1.01386e-07 ) ergs/cm2
Cutoff power-law model
Time interval is from    2.120 sec. to    3.120 sec.
Spectral model in the cutoff power-law:
------------------------------------------------------------
Parameters  : value       lower 90%   higher 90%
Photon index: -0.643392     ( -0.231394   0.248633 )
Epeak [keV] : 1.00000E+04      ( -10000 -10000 )
Norm@50keV  : 6.55809E-02    ( -0.0095281   0.00790447 )
------------------------------------------------------------
#Fit statistic : Chi-Squared =          57.14 using 59 PHA bins.
# Reduced chi-squared =          1.020 for     56 degrees of freedom
# Null hypothesis probability =   4.323940e-01

Photon flux (15-150 keV)    in 1 sec: 7.59124 ( -1.25987  1.18535 ) ph/cm2/s
Energy fluence (15-150 keV)             : 8.11559e-07 ( -1.24317e-07  1.24644e-07 ) ergs/cm2
Time-resolved spectra
Distribution
T90 vs. Hardness ratio plot
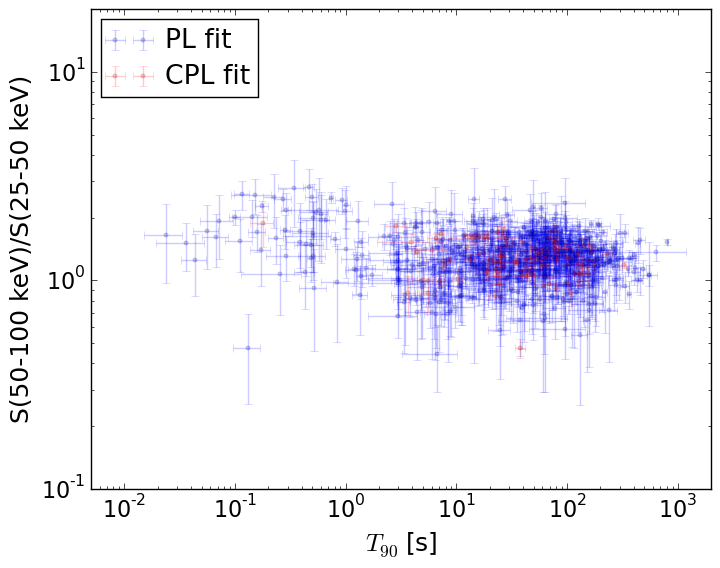
T90                                   = N/A sec.
Hardness ratio (energy fluence ratio) = N/A
S(15-50 keV) vs. S(50-150 keV) plot
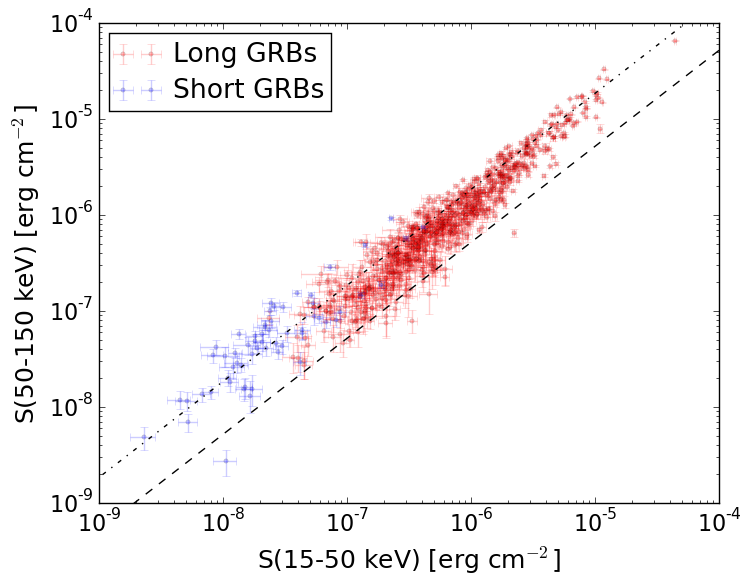
S(15-50 keV)  = N/A
S(50-150 keV) = N/A
The dash-dotted line and the dashed line traces the fluences calculated from the Band function with Epeak = 15 and 150 keV, respectively. Both lines assume a canonical values of alpha = -1 and beta = -2.5.
Mask shadow pattern
IMX = -8.024386640723181E-01, IMY = 8.120364178031654E-01
Spacecraft aspect plot
Bright source in the pre-burst/pre-slew/post-slew images
Pre-burst image of 15-350 keV band
Time interval of the image:
-179.200000 -15.760000

# RAcent  DECcent POSerr Theta    Phi  PeakCts   SNR AngSep     Name
#  [deg]    [deg]    ['] [deg]  [deg]                   [']
 10.5218  -5.0012    2.4  26.0   48.1   2.6267   4.9 ------	UNKNOWN
346.9851   9.3895    2.5  34.9   -5.3   2.3590   4.5 ------	UNKNOWN
338.6932  30.7232    3.2  57.4   -9.4   8.2809   3.7 ------	UNKNOWN
326.8030 -81.4081    3.1  57.4 -170.2   8.3334   3.7 ------	UNKNOWN
322.0800 -76.6061    2.2  53.8 -166.2   7.1839   5.2 ------	UNKNOWN
314.7630   5.5362    2.4  48.2  -50.7  10.2779   4.8 ------	UNKNOWN
Pre-slew background subtracted image of 15-350 keV band
Time interval of the image:
-15.760000 15.452000

# RAcent  DECcent POSerr Theta    Phi  PeakCts   SNR AngSep     Name
#  [deg]    [deg]    ['] [deg]  [deg]                   [']
347.9754  12.4502    2.9  37.8   -2.9   0.5041   3.9 ------	UNKNOWN
330.7157  -5.7354    2.8  28.8  -46.5   0.5983   4.2 ------	UNKNOWN
318.3168 -44.9780    3.2  34.4 -129.1   0.6477   3.6 ------	UNKNOWN
316.0584   0.3517    3.1  43.9  -55.1   2.1904   3.8 ------	UNKNOWN
299.3068 -53.1499    0.5  48.8 -134.7  19.4487  22.5 ------	UNKNOWN
Post-slew image of 15-350 keV band
Time interval of the image:
528.100630 962.893400

# RAcent  DECcent POSerr Theta    Phi  PeakCts   SNR AngSep     Name
#  [deg]    [deg]    ['] [deg]  [deg]                   [']
135.4534 -40.7431   15.9  14.7  103.6  -0.2154  -0.7   11.8	Vela X-1
170.3208 -60.5973    0.9  16.8 -121.3   4.0744  13.2    1.5	Cen X-3
186.6731 -62.7812    2.3  24.6 -115.5   2.1395   5.0    0.8	GX 301-2
159.2259 -14.9716    3.5  42.8  145.3   2.7014   3.3 ------	UNKNOWN
113.1221 -35.3810    2.7  27.1   63.2   1.8559   4.2 ------	UNKNOWN
160.3388 -21.9199    3.0  36.5  150.2   2.1243   3.8 ------	UNKNOWN
201.1806 -17.8182    3.5  59.1 -166.2   6.6626   3.3 ------	UNKNOWN
 29.8424 -52.0440    3.0  58.3  -19.7   6.8161   3.9 ------	UNKNOWN
235.2930 -70.2081    2.8  41.0  -93.4   7.0642   4.1 ------	UNKNOWN