Analysis Summary
Notes:
- 1) No attempt has been made to eliminate the non-significant decimal places.
- 2) This batgrbproduct analysis is done using the HEASARC data.
- 3) This batgrbproduct analysis is using the flight position for the mask-weighting calculation.
======================================================================
BAT GRB EVENT DATA PROCESSING REPORT
Process Script Ver: batgrbproduct v2.46
Process Start Time: Fri Jan 17 19:59:31 EST 2014
Host Name: batevent1
Current Working Dir: /local/data/batevent/batevent_reproc/trigger412081
======================================================================
Trigger: 00412081 Segment: 000
BAT Trigger Time: 287676447.552 [s; MET]
Trigger Stop: 287676448.064 [s; MET]
UTC: 2010-02-12T14:07:22.028320 [includes UTCF correction]
Where From?: TDRSS position message
BAT
RA: 356.46191166072 Dec: 49.4973281295149 [deg; J2000]
Catalogged Source?: NO
Point Source?: YES
GRB Indicated?: YES [ by BAT flight software ]
Image S/N Ratio: 14.49
Image Trigger?: NO
Rate S/N Ratio: 28.4077454226836 [ if not an image trigger ]
Image S/N Ratio: 14.49
Analysis Position: [ source = BAT ]
RA: 356.46191166072 Dec: 49.4973281295149 [deg; J2000]
Refined Position: [ source = BAT pre-slew burst ]
RA: 356.468407357116 Dec: 49.4879627632955 [deg; J2000]
{ 23h 45m 52.4s , +49d 29' 16.7" }
+/- 1.80016509565804 [arcmin] (estimated 90% radius based on SNR)
+/- 0.673007133645447 [arcmin] (formal 1-sigma fit error)
SNR: 13.1336812058078
Angular difference between the analysis and refined position is 0.616315 arcmin
Partial Coding Fraction: 0.8671875 [ including projection effects ]
Duration
T90: 163.763999938965 +/- 13.3436019227038
Measured from: -38.2919999957085
to: 125.471999943256 [s; relative to TRIGTIME]
T50: 82.1039999723434 +/- 25.1611751903544
Measured from: -0.199999988079071
to: 81.9039999842644 [s; relative to TRIGTIME]
Fluence
Peak Flux (peak 1 second)
Measured from: -0.339999973773956
to: 0.660000026226044 [s; relative to TRIGTIME]
Total Fluence
Measured from: -44.1159999966621
to: 134.051999986172 [s; relative to TRIGTIME]
Band 1 Band 2 Band 3 Band 4
15-25 25-50 50-100 100-350 keV
Total 1.010014 0.967388 0.348640 0.100529
0.069203 0.073232 0.070118 0.074914 [error]
Peak 0.070471 0.097282 0.086107 0.009130
0.006360 0.007013 0.006822 0.006281 [error]
[ fluence units of on-axis counts / fully illuminated detector ]
======================================================================
====== Table of the duration information =============================
Value tstart tstop
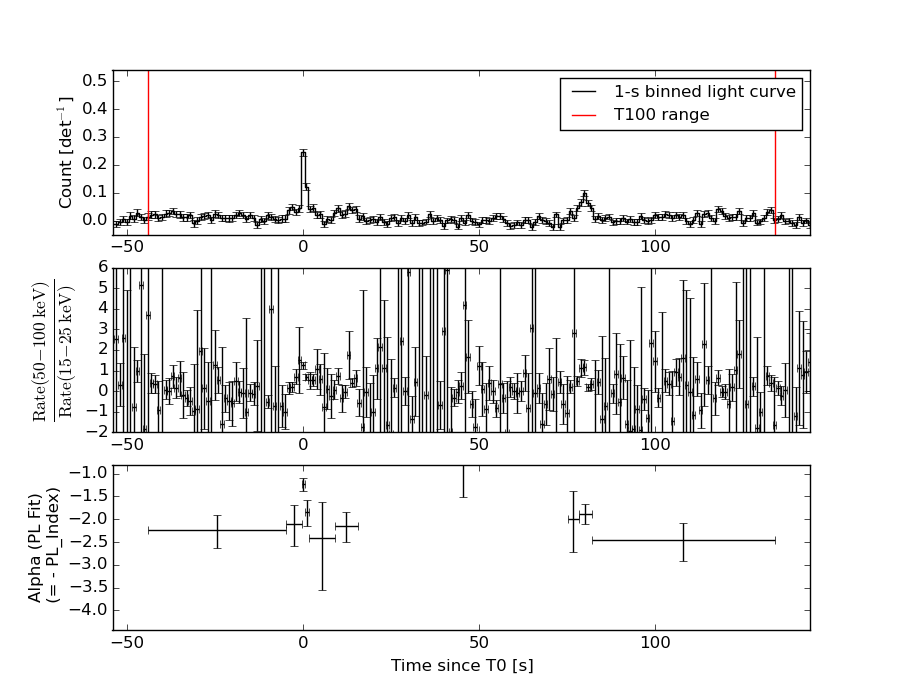
T100 178.168 -44.116 134.052
T90 163.764 -38.292 125.472
T50 82.104 -0.200 81.904
Peak 1.000 -0.340 0.660
====== Spectral Analysis Summary =====================================
Model : spectral model: simple power-law (PL) and cutoff power-law (CPL)
Ph_index : photon index: E^{Ph_index}
Ph_90err : 90% error of the photon index
Epeak : Epeak in keV
Epeak_90err: 90% error of Epeak
Norm : normalization at 50 keV in both the PL model and CPL model
Nomr_90err : 90% error of the normalization
chi2 : Chi-Squared
dof : degree of freedo
=== Time-averaged spectral analysis ===
(Best model with acceptable fit: PL)
Model Ph_index Ph_90err_low Ph_90err_hi Epeak Epeak_90err_low Epeak_90err_hi Norm Nomr_90err_low Norm_90err_hi chi2 dof
PL -2.240 -0.199 0.187 - - - 6.78e-04 -9.42e-05 9.33e-05 58.280 57
CPL -2.224 -0.468 0.172 9999.360 N/A N/A 6.89e-04 N/A N/A 58.330 56
=== 1-s peak spectral analysis ===
(Best model with acceptable fit: N/A)
Model Ph_index Ph_90err_low Ph_90err_hi Epeak Epeak_90err_low Epeak_90err_hi Norm Nomr_90err_low Norm_90err_hi chi2 dof
PL -1.284 -0.141 0.140 - - - 1.81e-02 -1.41e-03 1.41e-03 77.380 57
CPL -1.114 -0.293 0.548 273.377 -273.377 -273.377 2.19e-02 -5.03e-03 1.77e-02 77.040 56
=== Fluence/Peak Flux Summary ===
Model Band1 Band2 Band3 Band4 Band5 Total
15-25 25-50 50-100 100-350 15-150 15-350 keV
Fluence PL 3.11e-07 3.65e-07 3.09e-07 4.43e-07 1.14e-06 1.43e-06 erg/cm2
90%_error_low -3.62e-08 -3.54e-08 -5.78e-08 -1.42e-07 -1.31e-07 -2.20e-07 erg/cm2
90%_error_hi 3.67e-08 3.50e-08 6.09e-08 1.84e-07 1.36e-07 2.54e-07 erg/cm2
Peak flux PL 6.06e-01 6.93e-01 5.69e-01 7.83e-01 2.15e+00 2.65e+00 ph/cm2/s
90%_error_low -8.38e-02 -5.89e-02 -5.59e-02 -1.52e-01 -1.66e-01 -2.19e-01 ph/cm2/s
90%_error_hi 8.77e-02 5.83e-02 5.54e-02 1.74e-01 1.66e-01 2.24e-01 ph/cm2/s
Fluence CPL 2.98e-07 3.98e-07 2.62e-07 8.42e-08 1.02e-06 1.04e-06 erg/cm2
90%_error_low -3.95e-08 -4.70e-08 -8.34e-08 -6.74e-08 -1.44e-07 -1.63e-07 erg/cm2
90%_error_hi 3.94e-08 4.81e-08 7.95e-08 2.81e-07 1.71e-07 3.47e-07 erg/cm2
Peak flux CPL 5.85e-01 7.02e-01 5.78e-01 6.39e-01 2.13e+00 2.50e+00 ph/cm2/s
90%_error_low -1.03e-01 -6.43e-02 -6.07e-02 -2.81e-01 -1.75e-01 -3.43e-01 ph/cm2/s
90%_error_hi 1.02e-01 6.60e-02 6.28e-02 2.04e-01 1.74e-01 3.44e-01 ph/cm2/s
======================================================================
Image
Pre-slew 15.0-350.0 keV image (Event data)
#   RAcent    DECcent   POSerr    Theta     Phi              Peak Cts       SNR   Name
  356.4684    49.4880   0.0146    15.5643  -102.3370         1.2339771     13.134 TRIG_00412081

Foreground time interval of the image:
-44.116  10.149 (delta_t =  54.265 [sec])
Background time interval of the image:
-314.851 -44.116 (delta_t = 270.735 [sec])
Light Curves
Note: The mask-weighted lightcurves have units of either count/det or counts/sec/det, where a det is 0.4 x 0.4 = 0.16 sq cm.
Full-time range; 1 s binning
Other quick-look light curves:
Spectra
Notes:
- 1) The fitting includes the systematic errors.
- 2) When the burst includes telescope slew time periods, the fitting uses an average response file made from multiple 5-s response files through out the slew time plus single time preiod for the non-slew times, and weighted by the total counts in the corresponding time period using addrmf. An average response file is needed becuase a spectral fit using the pre-slew DRM will introduce some errors in both a spectral shape and a normalization if the PHA file contains a lot of the slew/post-slew time interval.
- 3) For fits to more complicated models (e.g. a power-law over a cutoff power-law), the BAT team has decided to require a chi-square improvement of more than 6 for each extra dof.
Time averaged spectrum fit using the average DRM
Power-law model
Time interval is from  -44.116 sec. to  134.052 sec.

Spectral model in power-law:
------------------------------------------------------------
Parameters  : value       lower 90%   higher 90%
Photon index: -2.24049     ( -0.198631   0.186806 )
Norm@50keV  : 6.78370E-04    ( -9.42176e-05   9.32692e-05 )
------------------------------------------------------------
#Fit statistic : Chi-Squared =          58.28 using 59 PHA bins.
# Reduced chi-squared =          1.022 for     57 degrees of freedom
# Null hypothesis probability =   4.279677e-01

Photon flux (15-150 keV)    in 178.2 sec: 0.114764 ( -0.010173  0.010173 ) ph/cm2/s
Energy fluence (15-150 keV)             : 1.14371e-06 ( -1.30695e-07  1.3569e-07 ) ergs/cm2
Cutoff power-law model

Time interval is from  -44.116 sec. to  134.052 sec.
Spectral model in the cutoff power-law:
------------------------------------------------------------
Parameters  : value       lower 90%   higher 90%
Photon index: -2.22401     ( -0.467269   0.172404 )
Epeak [keV] : 9999.36      (   )
Norm@50keV  : 6.88675E-04    (     )
------------------------------------------------------------
#Fit statistic : Chi-Squared =          58.31 using 59 PHA bins.
# Reduced chi-squared =          1.041 for     56 degrees of freedom
# Null hypothesis probability =   3.904601e-01

Photon flux (15-150 keV)    in 178.2 sec: 0.110516 ( -0.0106661  0.01082 ) ph/cm2/s
Energy fluence (15-150 keV)             : 1.02037e-06 ( -1.4404e-07  1.70948e-07 ) ergs/cm2
1-s peak spectrum fit
Power-law model
Time interval is from   -0.340 sec. to    0.660 sec.

Spectral model in power-law:
------------------------------------------------------------
Parameters  : value       lower 90%   higher 90%
Photon index: -1.28417     ( -0.140579   0.139866 )
Norm@50keV  : 1.80901E-02    ( -0.00140991   0.00140607 )
------------------------------------------------------------
#Fit statistic : Chi-Squared =          77.38 using 59 PHA bins.
# Reduced chi-squared =          1.358 for     57 degrees of freedom
# Null hypothesis probability =   3.752043e-02

Photon flux (15-150 keV)    in 1 sec: 2.15205 ( -0.16624  0.16637 ) ph/cm2/s
Energy fluence (15-150 keV)             : 1.79486e-07 ( -1.62071e-08  1.6394e-08 ) ergs/cm2
Cutoff power-law model

Time interval is from   -0.340 sec. to    0.660 sec.
Spectral model in the cutoff power-law:
------------------------------------------------------------
Parameters  : value       lower 90%   higher 90%
Photon index: -1.11426     ( -0.292874   0.548147 )
Epeak [keV] : 273.377      ( -273.358 -273.358 )
Norm@50keV  : 2.18717E-02    ( -0.00502682   0.0176836 )
------------------------------------------------------------
#Fit statistic : Chi-Squared =          77.04 using 59 PHA bins.
# Reduced chi-squared =          1.376 for     56 degrees of freedom
# Null hypothesis probability =   3.258107e-02

Photon flux (15-150 keV)    in 1 sec: 2.13387 ( -0.17456  0.17405 ) ph/cm2/s
Energy fluence (15-150 keV)             : 1.77129e-07 ( -1.77761e-08  1.76132e-08 ) ergs/cm2
Time-resolved spectra
Distribution
T90 vs. Hardness ratio plot
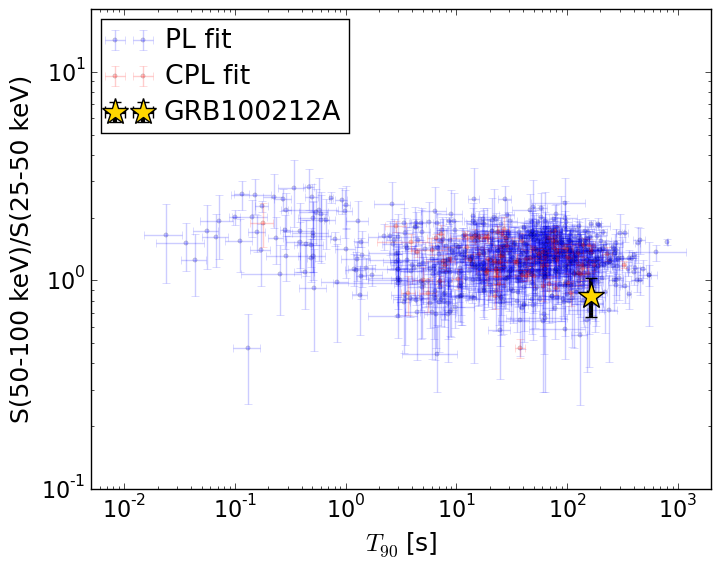
T90                                   = 163.764 sec.
Hardness ratio (energy fluence ratio) = 0.846506154593
S(15-50 keV) vs. S(50-150 keV) plot
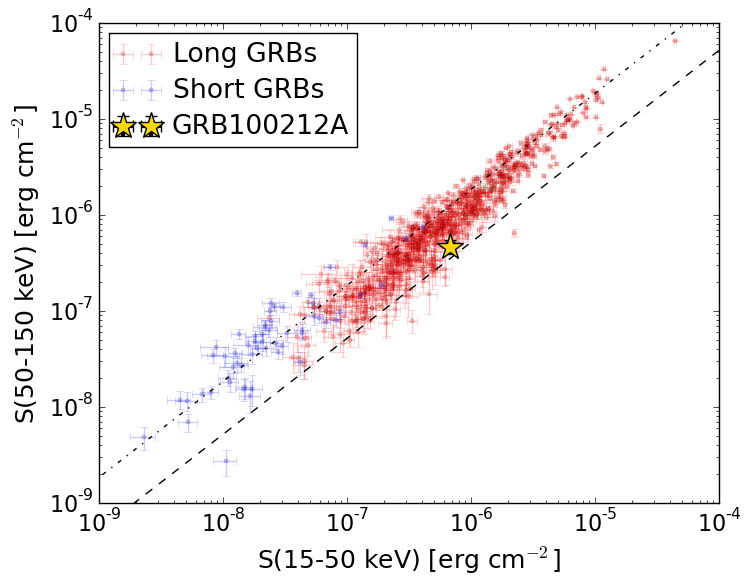
S(15-50 keV)  = 6.762016e-07
S(50-150 keV) = 4.675273e-07
The dash-dotted line and the dashed line traces the fluences calculated from the Band function with Epeak = 15 and 150 keV, respectively. Both lines assume a canonical values of alpha = -1 and beta = -2.5.
Mask shadow pattern
IMX = -5.951191007813444E-02, IMY = 2.721016923148862E-01
Spacecraft aspect plot
Bright source in the pre-burst/pre-slew/post-slew images
Pre-burst image of 15-350 keV band
Time interval of the image:
-314.851400 -44.116000

# RAcent  DECcent POSerr Theta    Phi  PeakCts   SNR AngSep     Name
#  [deg]    [deg]    ['] [deg]  [deg]                   [']
299.6120  35.1855    0.7  48.7  -39.8  13.9939  17.8    1.4	Cyg X-1
308.1725  40.9607    2.6  40.2  -43.2   1.8318   4.5    2.9	Cyg X-3
326.1173  38.2998    7.4  35.0  -64.8   0.6612   1.6    2.9	Cyg X-2
341.4732  65.4911    3.1  10.6  -18.3   0.7610   3.7 ------	UNKNOWN
 28.4554  32.1514    2.3  34.8 -160.8   1.2442   5.0 ------	UNKNOWN
 38.0285  18.3084    2.9  50.6 -167.0   2.2049   3.9 ------	UNKNOWN
358.6502  41.7394    2.5  22.8 -111.9   1.1537   4.6 ------	UNKNOWN
 11.9618  31.2684    2.2  33.1 -135.7   1.5499   5.3 ------	UNKNOWN
Pre-slew background subtracted image of 15-350 keV band
Time interval of the image:
-44.116000 10.148600

# RAcent  DECcent POSerr Theta    Phi  PeakCts   SNR AngSep     Name
#  [deg]    [deg]    ['] [deg]  [deg]                   [']
299.5788  35.2976    6.3  48.7  -39.7   0.4804   1.8    5.8	Cyg X-1
308.1729  40.8431    7.2  40.3  -43.4   0.2475   1.6    7.2	Cyg X-3
326.0925  38.1837    5.6  35.1  -64.8  -0.3227  -2.1    9.1	Cyg X-2
220.6416  64.7796    2.0  48.7   34.6   2.2931   5.7 ------	UNKNOWN
356.4684  49.4880    0.9  15.6 -102.3   1.2340  13.1 ------	UNKNOWN
 31.5200  18.2252    2.1  49.0 -159.2   1.0203   5.6 ------	UNKNOWN
Post-slew image of 15-350 keV band
Time interval of the image:
47.148600 842.504400

# RAcent  DECcent POSerr Theta    Phi  PeakCts   SNR AngSep     Name
#  [deg]    [deg]    ['] [deg]  [deg]                   [']
299.5893  35.2025    0.2  43.2  -28.8  41.9152  47.6    0.1	Cyg X-1
308.1356  40.9828    1.3  34.4  -27.2   5.8397   9.0    2.1	Cyg X-3
326.1286  38.4773    4.6  24.2  -47.2   1.4803   2.5    9.6	Cyg X-2
 57.0597  34.4430    3.1  46.1  143.6   5.9197   3.7 ------	UNKNOWN
 33.0249  27.6551    3.1  35.4  172.8   2.8736   3.8 ------	UNKNOWN
276.3664  49.0602    3.1  49.6    0.4   4.4372   3.8 ------	UNKNOWN
 35.7106  14.9459    2.6  47.0 -178.4   4.2874   4.4 ------	UNKNOWN
348.7430  23.9179    3.2  26.3 -105.6   2.1896   3.6 ------	UNKNOWN
341.9980  26.3055    3.2  25.8  -90.7   2.4330   3.5 ------	UNKNOWN