Analysis Summary
Notes:
- 1) No attempt has been made to eliminate the non-significant decimal places.
- 2) This batgrbproduct analysis is done using the HEASARC data.
- 3) This batgrbproduct analysis is using the flight position for the mask-weighting calculation.
======================================================================
BAT GRB EVENT DATA PROCESSING REPORT
Process Script Ver: batgrbproduct v2.46
Process Start Time: Fri Jan 17 19:52:10 EST 2014
Host Name: batevent1
Current Working Dir: /local/data/batevent/batevent_reproc/trigger412217
======================================================================
Trigger: 00412217 Segment: 000
BAT Trigger Time: 287792873.74 [s; MET]
Trigger Stop: 287792873.804 [s; MET]
UTC: 2010-02-13T22:27:48.212320 [includes UTCF correction]
Where From?: (*SHORT BURST*) TDRSS scaled map message
BAT
RA: 349.428219015384 Dec: 43.3834539169845 [deg; J2000]
Catalogged Source?: NO
Point Source?: YES
GRB Indicated?: YES [ by BAT flight software ]
Image S/N Ratio: 7.01
Image Trigger?: NO
Rate S/N Ratio: 12.1655250605964 [ if not an image trigger ]
Image S/N Ratio: 7.01
Analysis Position: [ source = BAT ]
RA: 349.428219015384 Dec: 43.3834539169845 [deg; J2000]
Refined Position: [ source = BAT pre-slew burst ]
RA: 349.375576883238 Dec: 43.3713184050059 [deg; J2000]
{ 23h 17m 30.1s , +43d 22' 16.7" }
+/- 1.38999449337775 [arcmin] (estimated 90% radius based on SNR)
+/- 0.392826952452956 [arcmin] (formal 1-sigma fit error)
SNR: 19.0026417286463
Angular difference between the analysis and refined position is 2.408464 arcmin
Partial Coding Fraction: 0.59375 [ including projection effects ]
Duration
T90: 2.21599996089935 +/- 0.257619864022535
Measured from: -0.164000034332275
to: 2.05199992656708 [s; relative to TRIGTIME]
T50: 1.17199993133545 +/- 0.808240031162311
Measured from: 0.236000001430511
to: 1.40799993276596 [s; relative to TRIGTIME]
Fluence
Peak Flux (peak 1 second)
Measured from: 1.01199996471405
to: 2.01199996471405 [s; relative to TRIGTIME]
Total Fluence
Measured from: -0.392000019550323
to: 2.1599999666214 [s; relative to TRIGTIME]
Band 1 Band 2 Band 3 Band 4
15-25 25-50 50-100 100-350 keV
Total 0.102529 0.138211 0.137618 0.031417
0.010741 0.011396 0.010837 0.009050 [error]
Peak 0.067764 0.091624 0.089674 0.012491
0.007078 0.007722 0.007469 0.006007 [error]
[ fluence units of on-axis counts / fully illuminated detector ]
======================================================================
====== Table of the duration information =============================
Value tstart tstop
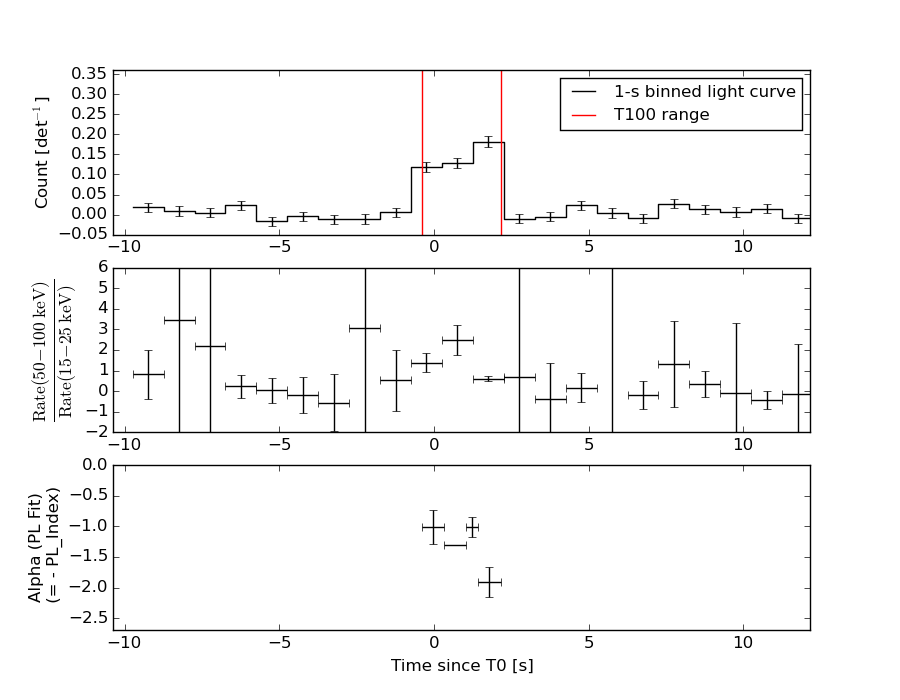
T100 2.552 -0.392 2.160
T90 2.216 -0.164 2.052
T50 1.172 0.236 1.408
Peak 1.000 1.012 2.012
====== Spectral Analysis Summary =====================================
Model : spectral model: simple power-law (PL) and cutoff power-law (CPL)
Ph_index : photon index: E^{Ph_index}
Ph_90err : 90% error of the photon index
Epeak : Epeak in keV
Epeak_90err: 90% error of Epeak
Norm : normalization at 50 keV in both the PL model and CPL model
Nomr_90err : 90% error of the normalization
chi2 : Chi-Squared
dof : degree of freedo
=== Time-averaged spectral analysis ===
(Best model with acceptable fit: PL)
Model Ph_index Ph_90err_low Ph_90err_hi Epeak Epeak_90err_low Epeak_90err_hi Norm Nomr_90err_low Norm_90err_hi chi2 dof
PL -1.294 -0.143 0.143 - - - 1.06e-02 -8.95e-04 8.93e-04 61.900 57
CPL -0.842 -0.504 0.591 134.748 -49.495 -134.748 1.76e-02 -7.35e-03 1.57e-02 59.720 56
=== 1-s peak spectral analysis ===
(Best model with acceptable fit: PL)
Model Ph_index Ph_90err_low Ph_90err_hi Epeak Epeak_90err_low Epeak_90err_hi Norm Nomr_90err_low Norm_90err_hi chi2 dof
PL -1.333 -0.145 0.144 - - - 1.76e-02 -1.55e-03 1.55e-03 64.950 57
CPL -0.713 -0.565 0.646 106.750 -31.481 415.430 3.58e-02 -1.68e-02 3.72e-02 61.400 56
=== Fluence/Peak Flux Summary ===
Model Band1 Band2 Band3 Band4 Band5 Total
15-25 25-50 50-100 100-350 15-150 15-350 keV
Fluence PL 2.86e-08 5.95e-08 9.72e-08 3.57e-07 2.68e-07 5.42e-07 erg/cm2
90%_error_low -4.14e-09 -5.41e-09 -1.02e-08 -7.49e-08 -2.54e-08 -8.33e-08 erg/cm2
90%_error_hi 4.30e-09 5.37e-09 1.02e-08 8.75e-08 2.56e-08 9.39e-08 erg/cm2
Peak flux PL 6.18e-01 6.87e-01 5.46e-01 7.17e-01 2.12e+00 2.57e+00 ph/cm2/s
90%_error_low -9.02e-02 -6.46e-02 -5.90e-02 -1.46e-01 -1.85e-01 -2.34e-01 ph/cm2/s
90%_error_hi 9.40e-02 6.41e-02 5.85e-02 1.67e-01 1.85e-01 2.37e-01 ph/cm2/s
Fluence CPL 2.62e-08 6.22e-08 1.01e-07 1.91e-07 2.61e-07 3.80e-07 erg/cm2
90%_error_low -4.96e-09 -6.26e-09 -1.13e-08 -9.27e-08 -2.72e-08 -9.59e-08 erg/cm2
90%_error_hi 5.04e-09 6.42e-09 1.16e-08 1.92e-07 2.72e-08 1.94e-07 erg/cm2
Peak flux CPL 5.51e-01 7.28e-01 5.79e-01 3.77e-01 2.07e+00 2.23e+00 ph/cm2/s
90%_error_low -1.09e-01 -7.56e-02 -6.79e-02 -1.62e-01 -1.90e-01 -2.56e-01 ph/cm2/s
90%_error_hi 1.11e-01 7.74e-02 6.96e-02 3.05e-01 1.90e-01 3.38e-01 ph/cm2/s
======================================================================
Image
Pre-slew 15.0-350.0 keV image (Event data)
#   RAcent    DECcent   POSerr    Theta     Phi              Peak Cts       SNR   Name
  349.3756    43.3713   0.0101    24.5953   -91.8839         0.4085600     19.003 TRIG_00412217

Foreground time interval of the image:
 -0.392   2.160 (delta_t =   2.552 [sec])
Background time interval of the image:
-239.740  -0.392 (delta_t = 239.348 [sec])
Light Curves
Note: The mask-weighted lightcurves have units of either count/det or counts/sec/det, where a det is 0.4 x 0.4 = 0.16 sq cm.
Full-time range; 1 s binning
Other quick-look light curves:
- 64 ms binning (zoomed)
- 16 ms binning (zoomed)
- 8 ms binning (zoomed)
- 2 ms binning (zoomed)
- SN=5 or 10 s binning (full-time range)
- Raw light curve
Spectra
- 64 ms binning (zoomed)
- 16 ms binning (zoomed)
- 8 ms binning (zoomed)
- 2 ms binning (zoomed)
- SN=5 or 10 s binning (full-time range)
- Raw light curve
Spectra
Notes:
- 1) The fitting includes the systematic errors.
- 2) When the burst includes telescope slew time periods, the fitting uses an average response file made from multiple 5-s response files through out the slew time plus single time preiod for the non-slew times, and weighted by the total counts in the corresponding time period using addrmf. An average response file is needed becuase a spectral fit using the pre-slew DRM will introduce some errors in both a spectral shape and a normalization if the PHA file contains a lot of the slew/post-slew time interval.
- 3) For fits to more complicated models (e.g. a power-law over a cutoff power-law), the BAT team has decided to require a chi-square improvement of more than 6 for each extra dof.
Time averaged spectrum fit using the average DRM
Power-law model
Time interval is from   -0.392 sec. to    2.160 sec.

Spectral model in power-law:
------------------------------------------------------------
Parameters  : value       lower 90%   higher 90%
Photon index: -1.29353     ( -0.142544   0.142678 )
Norm@50keV  : 1.06286E-02    ( -0.000895389   0.000893371 )
------------------------------------------------------------
#Fit statistic : Chi-Squared =          61.90 using 59 PHA bins.
# Reduced chi-squared =          1.086 for     57 degrees of freedom
# Null hypothesis probability =   3.057006e-01

Photon flux (15-150 keV)    in 2.552 sec: 1.26653 ( -0.10744  0.10754 ) ph/cm2/s
Energy fluence (15-150 keV)             : 2.68491e-07 ( -2.53596e-08  2.55927e-08 ) ergs/cm2
Cutoff power-law model
Time interval is from   -0.392 sec. to    2.160 sec.
Spectral model in the cutoff power-law:
------------------------------------------------------------
Parameters  : value       lower 90%   higher 90%
Photon index: -0.842168     ( -0.504006   0.591446 )
Epeak [keV] : 134.748      ( -49.4965 -134.75 )
Norm@50keV  : 1.76261E-02    ( -0.00735423   0.0156528 )
------------------------------------------------------------
#Fit statistic : Chi-Squared =          59.72 using 59 PHA bins.
# Reduced chi-squared =          1.066 for     56 degrees of freedom
# Null hypothesis probability =   3.422513e-01

Photon flux (15-150 keV)    in 2.552 sec: 1.24402 ( -0.11078  0.11068 ) ph/cm2/s
Energy fluence (15-150 keV)             : 2.60825e-07 ( -2.72311e-08  2.72207e-08 ) ergs/cm2
1-s peak spectrum fit
Power-law model
Time interval is from    1.012 sec. to    2.012 sec.

Spectral model in power-law:
------------------------------------------------------------
Parameters  : value       lower 90%   higher 90%
Photon index: -1.33261     ( -0.144909   0.144046 )
Norm@50keV  : 1.76342E-02    ( -0.00155481   0.00155066 )
------------------------------------------------------------
#Fit statistic : Chi-Squared =          64.95 using 59 PHA bins.
# Reduced chi-squared =          1.140 for     57 degrees of freedom
# Null hypothesis probability =   2.193059e-01

Photon flux (15-150 keV)    in 1 sec: 2.11699 ( -0.18503  0.18513 ) ph/cm2/s
Energy fluence (15-150 keV)             : 1.72934e-07 ( -1.71259e-08  1.72964e-08 ) ergs/cm2
Cutoff power-law model
Time interval is from    1.012 sec. to    2.012 sec.
Spectral model in the cutoff power-law:
------------------------------------------------------------
Parameters  : value       lower 90%   higher 90%
Photon index: -0.712934     ( -0.565095   0.645938 )
Epeak [keV] : 106.750      ( -31.4806 415.43 )
Norm@50keV  : 3.58361E-02    ( -0.0167576   0.0371979 )
------------------------------------------------------------
#Fit statistic : Chi-Squared =          61.40 using 59 PHA bins.
# Reduced chi-squared =          1.096 for     56 degrees of freedom
# Null hypothesis probability =   2.887643e-01

Photon flux (15-150 keV)    in 1 sec: 2.07194 ( -0.1901  0.18986 ) ph/cm2/s
Energy fluence (15-150 keV)             : 1.66184e-07 ( -1.84331e-08  1.84918e-08 ) ergs/cm2
Time-resolved spectra
Distribution
T90 vs. Hardness ratio plot
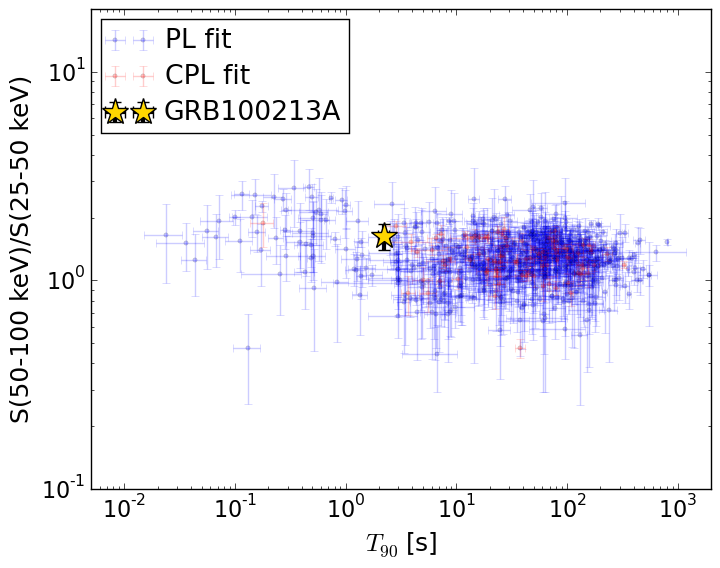
T90                                   = 2.216 sec.
Hardness ratio (energy fluence ratio) = 1.6318116762
S(15-50 keV) vs. S(50-150 keV) plot
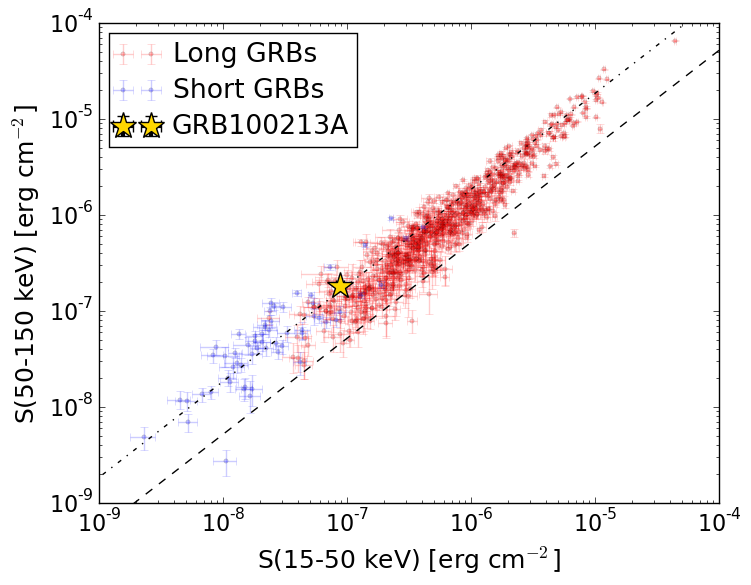
S(15-50 keV)  = 8.809394e-08
S(50-150 keV) = 1.8039883e-07
The dash-dotted line and the dashed line traces the fluences calculated from the Band function with Epeak = 15 and 150 keV, respectively. Both lines assume a canonical values of alpha = -1 and beta = -2.5.
Mask shadow pattern
IMX = -1.504800972880541E-02, IMY = 4.574892327589972E-01
Spacecraft aspect plot
Bright source in the pre-burst/pre-slew/post-slew images
Pre-burst image of 15-350 keV band
Time interval of the image:
-239.740000 -0.392000

# RAcent  DECcent POSerr Theta    Phi  PeakCts   SNR AngSep     Name
#  [deg]    [deg]    ['] [deg]  [deg]                   [']
308.0571  41.0946   13.5  45.2  -50.7   0.5298   0.9    8.9	Cyg X-3
326.1714  38.3318  408.7  38.8  -69.7  -0.0135  -0.0    0.6	Cyg X-2
256.1941  76.4150    2.8  37.2   13.5   1.0017   4.1 ------	UNKNOWN
265.6416  48.1934    2.5  57.5  -14.3   3.8025   4.6 ------	UNKNOWN
 14.2221   7.6458    3.2  54.0 -143.2   3.9474   3.6 ------	UNKNOWN
Pre-slew background subtracted image of 15-350 keV band
Time interval of the image:
-0.392000 2.160000

# RAcent  DECcent POSerr Theta    Phi  PeakCts   SNR AngSep     Name
#  [deg]    [deg]    ['] [deg]  [deg]                   [']
308.0173  41.0993    4.5  45.2  -50.6   0.1465   2.6    9.8	Cyg X-3
326.1258  38.1789    3.0  39.0  -69.8   0.1635   3.9    8.8	Cyg X-2
273.2644  53.4350    2.2  50.4  -15.6   0.1914   5.1 ------	UNKNOWN
349.3756  43.3713    0.6  24.6  -91.9   0.4085  19.0 ------	UNKNOWN
287.3277  49.9631    2.7  47.7  -27.5   0.1542   4.3 ------	UNKNOWN
  9.1287  22.5790    3.0  39.4 -135.0   0.1100   3.8 ------	UNKNOWN
Post-slew image of 15-350 keV band
Time interval of the image:
56.960600 364.260590

# RAcent  DECcent POSerr Theta    Phi  PeakCts   SNR AngSep     Name
#  [deg]    [deg]    ['] [deg]  [deg]                   [']
299.5729  35.2063    0.6  38.8  -19.6   5.1028  19.8    0.9	Cyg X-1
308.0998  40.9725    1.1  30.4  -14.9   2.2271  10.5    1.3	Cyg X-3
325.9872  38.2019    7.9  18.4  -33.2   0.2829   1.5   11.3	Cyg X-2
299.5404  40.0444    2.1  36.8  -12.4   1.2786   5.5 ------	UNKNOWN
293.0992  19.4464    3.2  52.5  -33.3   2.7764   3.7 ------	UNKNOWN
338.8530   3.3534    3.8  41.1  -98.6   3.8033   3.1 ------	UNKNOWN