Analysis Summary
Notes:
- 1) No attempt has been made to eliminate the non-significant decimal places.
- 2) This batgrbproduct analysis is done using the HEASARC data.
- 3) This batgrbproduct analysis is using the flight position for the mask-weighting calculation.
======================================================================
                  BAT GRB EVENT DATA PROCESSING REPORT
    Process Script Ver: batgrbproduct v2.46
    Process Start Time: Fri Jan 17 19:47:58 EST 2014
             Host Name: batevent1
   Current Working Dir: /local/data/batevent/batevent_reproc/trigger412220
======================================================================

  Trigger: 00412220      Segment: 000

  BAT Trigger Time: 287794719.744   [s; MET]
      Trigger Stop: 287794723.84   [s; MET]
               UTC: 2010-02-13T22:58:34.216240    [includes UTCF correction]
       Where From?: TDRSS position message

  BAT
    RA: 124.337626580859   Dec: 43.4552068987612  [deg; J2000]

     Catalogged Source?: NO
     Point Source?:      YES
     GRB Indicated?:     YES    [ by BAT flight software ]
     Image S/N Ratio:    10.85
     Image Trigger?:     NO
     Rate S/N Ratio:     11.1803398874989  [ if not an image trigger ]
     Image S/N Ratio:    10.85

  Analysis Position:   [ source = BAT ]
    RA: 124.337626580859   Dec: 43.4552068987612  [deg; J2000]

  Refined Position:   [ source = BAT pre-slew burst ]
    RA: 124.309721978964   Dec: 43.4602614977526  [deg; J2000]
        { 08h 17m 14.3s , +43d 27' 36.9" }
         +/- 1.15305250953836 [arcmin] (estimated 90% radius based on SNR)
         +/- 0.514827216667112 [arcmin] (formal 1-sigma fit error)
    SNR: 24.8177579076713

  Angular difference between the analysis and refined position is 1.252596 arcmin

  Partial Coding Fraction: 0.5625    [ including projection effects ]

  Duration
     T90: 91.8560000061989 +/- 20.3447612447196
        Measured from: -1.85600000619888
                   to: 90     [s; relative to TRIGTIME]
     T50: 24.9760000109673 +/- 5.74319770554251
        Measured from: 5.08799999952316
                   to: 30.0640000104904     [s; relative to TRIGTIME]


  Fluence
     Peak Flux  (peak 1 second)
        Measured from: 2.99599999189377
                   to: 3.99599999189377     [s; relative to TRIGTIME]
     Total Fluence
        Measured from: -6.08000004291534
                   to: 111.087999999523     [s; relative to TRIGTIME]

             Band 1     Band 2     Band 3     Band 4
              15-25      25-50     50-100    100-350     keV
 Total     1.020942   0.940349   0.364125   0.094816
           0.062490   0.064305   0.056479   0.049208 [error]
 Peak      0.031356   0.038190   0.021217  -0.002535
           0.006770   0.007155   0.006269   0.005055 [error]

     [ fluence units of on-axis counts / fully illuminated detector ]

======================================================================


====== Table of the duration information =============================

        Value   tstart    tstop
T100  117.168   -6.080  111.088
T90    91.856   -1.856   90.000
T50    24.976    5.088   30.064
Peak    1.000    2.996    3.996


====== Spectral Analysis Summary =====================================

Model      : spectral model: simple power-law (PL) and cutoff power-law (CPL)
Ph_index   : photon index: E^{Ph_index}
Ph_90err   : 90% error of the photon index
Epeak      : Epeak in keV
Epeak_90err: 90% error of Epeak
Norm       : normalization at 50 keV in both the PL model and CPL model
Nomr_90err : 90% error of the normalization
chi2       : Chi-Squared
dof        : degree of freedo

=== Time-averaged spectral analysis ===
(Best model with acceptable fit: PL)

Model Ph_index Ph_90err_low Ph_90err_hi  Epeak  Epeak_90err_low  Epeak_90err_hi  Norm       Nomr_90err_low    Norm_90err_hi    chi2    dof
PL      -2.292    -0.166      0.158       -           -               -         1.09e-03     -1.26e-04          1.24e-04      53.810   57
CPL     -2.281    -0.141      0.147     9999.360      N/A           N/A         1.10e-03        N/A               N/A         53.850   56


=== 1-s peak spectral analysis ===
(Best model with acceptable fit: PL)

Model Ph_index Ph_90err_low Ph_90err_hi  Epeak  Epeak_90err_low  Epeak_90err_hi  Norm       Nomr_90err_low    Norm_90err_hi    chi2    dof
PL      -1.921     -0.386     0.348       -           -               -         5.56e-03     -1.49e-03          1.44e-03      66.550   57
CPL      0.129     -1.788     2.634       42.244     -12.088        25.387      8.83e-02     -8.83e-02          3.21e+00      62.590   56


=== Fluence/Peak Flux Summary ===

              Model    Band1     Band2     Band3     Band4     Band5     Total
                       15-25     25-50    50-100    100-350    15-150    15-350    keV
Fluence         PL   3.46e-07  3.95e-07  3.22e-07  4.40e-07  1.22e-06  1.50e-06   erg/cm2
      90%_error_low -3.63e-08 -3.26e-08 -4.99e-08 -1.19e-07 -1.15e-07 -1.87e-07   erg/cm2
      90%_error_hi   3.69e-08  3.24e-08  5.17e-08  1.47e-07  1.18e-07  2.07e-07   erg/cm2
Peak flux       PL   3.43e-01  2.70e-01  1.42e-01  1.09e-01  8.05e-01  8.64e-01   ph/cm2/s
      90%_error_low -9.76e-02 -5.84e-02 -4.72e-02 -5.57e-02 -1.74e-01 -1.90e-01   ph/cm2/s
      90%_error_hi   1.02e-01  5.84e-02  4.88e-02  8.11e-02  1.74e-01  1.91e-01   ph/cm2/s

Fluence        CPL   3.44e-07  4.04e-07  3.22e-07  4.67e-07  1.22e-06  1.45e-06   erg/cm2
      90%_error_low    N/A       N/A    -4.99e-08 -1.47e-07    N/A    -1.82e-07   erg/cm2
      90%_error_hi     N/A       N/A     5.18e-08  2.00e-07    N/A     3.94e-07   erg/cm2
Peak flux      CPL   2.88e-01  3.39e-01  1.34e-01  1.27e-02  7.73e-01  7.74e-01   ph/cm2/s
      90%_error_low -1.15e-01 -8.35e-02 -6.49e-02 -1.27e-02 -1.73e-01 -1.73e-01   ph/cm2/s
      90%_error_hi   1.17e-01  8.78e-02  6.22e-02  6.79e-02  1.74e-01  1.77e-01   ph/cm2/s

======================================================================
Image
Pre-slew 15.0-350.0 keV image (Event data)
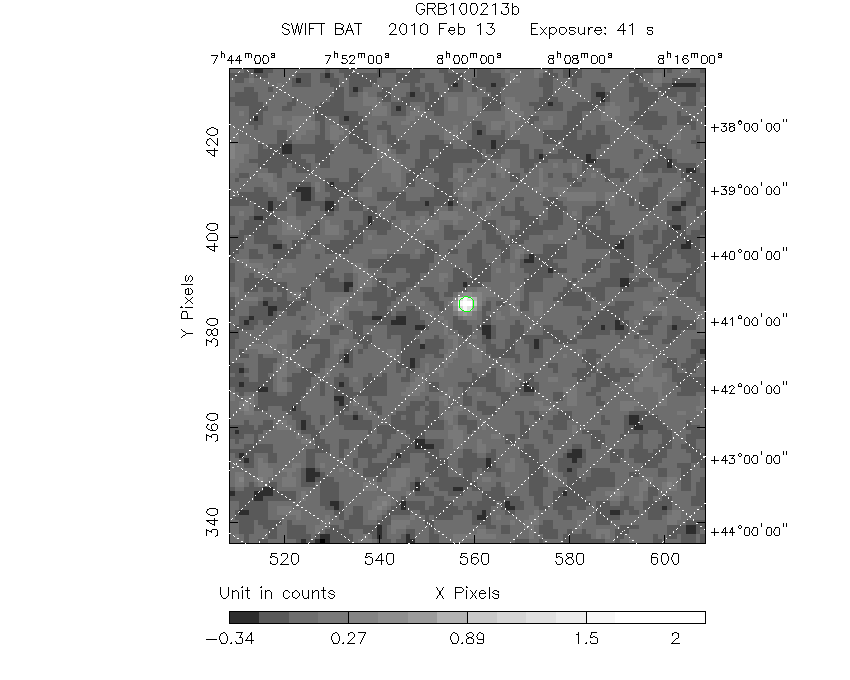
#   RAcent    DECcent   POSerr    Theta     Phi              Peak Cts       SNR   Name
  124.3097    43.4603   0.0078    35.0530    15.7677         2.1686615     24.818 TRIG_00412220

Foreground time interval of the image:
 -6.080  34.957 (delta_t =  41.037 [sec])
Background time interval of the image:
-239.744  -6.080 (delta_t = 233.664 [sec])
Light Curves
Note: The mask-weighted lightcurves have units of either count/det or counts/sec/det, where a det is 0.4 x 0.4 = 0.16 sq cm.
Full-time range; 1 s binning
Other quick-look light curves:
- 64 ms binning (zoomed)
- 16 ms binning (zoomed)
- 8 ms binning (zoomed)
- 2 ms binning (zoomed)
- SN=5 or 10 s binning (full-time range)
- Raw light curve
Spectra
- 64 ms binning (zoomed)
- 16 ms binning (zoomed)
- 8 ms binning (zoomed)
- 2 ms binning (zoomed)
- SN=5 or 10 s binning (full-time range)
- Raw light curve
Spectra
Notes:
- 1) The fitting includes the systematic errors.
- 2) When the burst includes telescope slew time periods, the fitting uses an average response file made from multiple 5-s response files through out the slew time plus single time preiod for the non-slew times, and weighted by the total counts in the corresponding time period using addrmf. An average response file is needed becuase a spectral fit using the pre-slew DRM will introduce some errors in both a spectral shape and a normalization if the PHA file contains a lot of the slew/post-slew time interval.
- 3) For fits to more complicated models (e.g. a power-law over a cutoff power-law), the BAT team has decided to require a chi-square improvement of more than 6 for each extra dof.
Time averaged spectrum fit using the average DRM
Power-law model
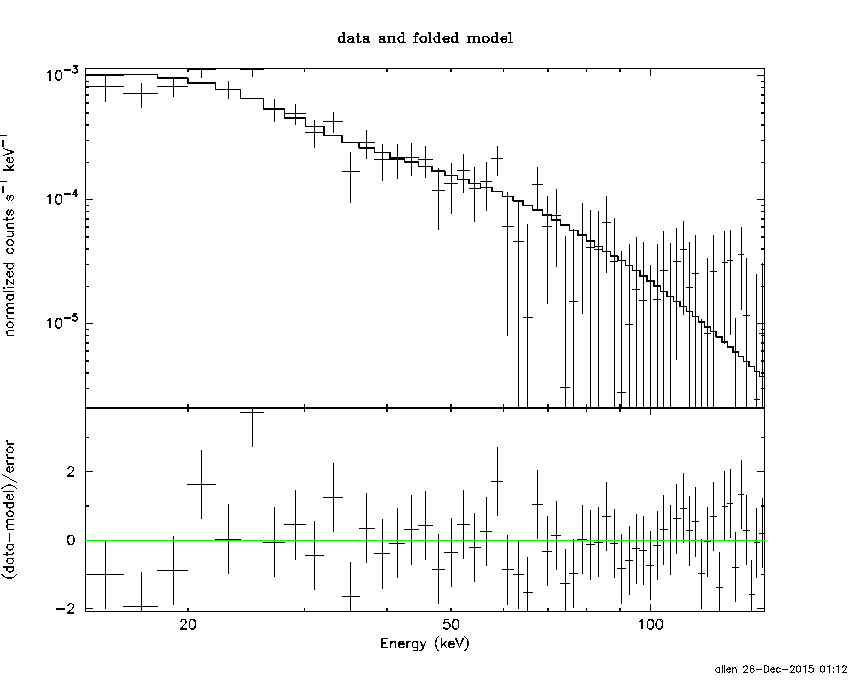
Time interval is from   -6.080 sec. to  111.088 sec.

Spectral model in power-law:
------------------------------------------------------------
Parameters  : value       lower 90%   higher 90%
Photon index: -2.292     ( -0.166059   0.157774 )
Norm@50keV  : 1.09388E-03    ( -0.000125789   0.000124143 )
------------------------------------------------------------
#Fit statistic : Chi-Squared =          53.81 using 59 PHA bins.
# Reduced chi-squared =         0.9441 for     57 degrees of freedom
# Null hypothesis probability =   5.953886e-01

Photon flux (15-150 keV)    in 117.2 sec: 0.190339 ( -0.014985  0.014987 ) ph/cm2/s
Energy fluence (15-150 keV)             : 1.22359e-06 ( -1.15138e-07  1.1759e-07 ) ergs/cm2
Cutoff power-law model
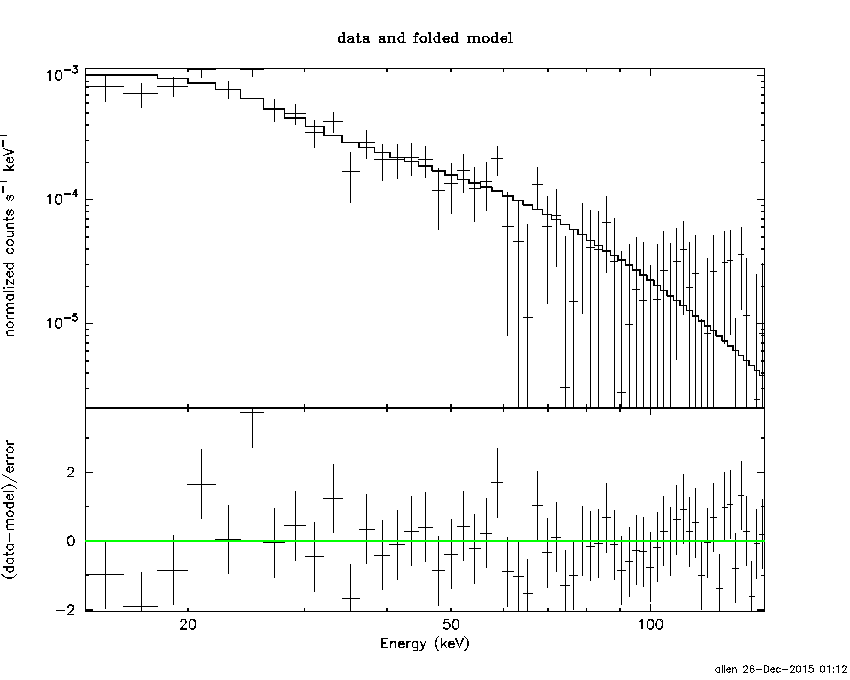
Time interval is from   -6.080 sec. to  111.088 sec.
Spectral model in the cutoff power-law:
------------------------------------------------------------
Parameters  : value       lower 90%   higher 90%
Photon index: -2.28097     ( -0.14036   0.147991 )
Epeak [keV] : 9999.36      (   )
Norm@50keV  : 1.10468E-03    (     )
------------------------------------------------------------
#Fit statistic : Chi-Squared =          53.84 using 59 PHA bins.
# Reduced chi-squared =         0.9614 for     56 degrees of freedom
# Null hypothesis probability =   5.571756e-01

Photon flux (15-150 keV)    in 117.2 sec: 0.185347 ( -0.015761  0.015781 ) ph/cm2/s
Energy fluence (15-150 keV)             : 1.22022e-06 ( 0  0 ) ergs/cm2
1-s peak spectrum fit
Power-law model
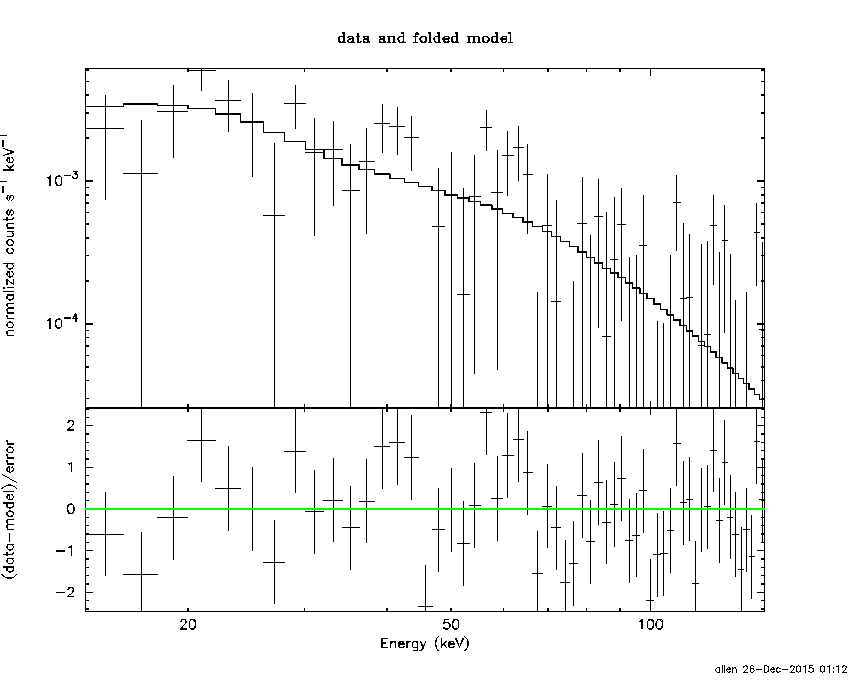
Time interval is from    2.996 sec. to    3.996 sec.

Spectral model in power-law:
------------------------------------------------------------
Parameters  : value       lower 90%   higher 90%
Photon index: -1.921     ( -0.385722   0.348038 )
Norm@50keV  : 5.55685E-03    ( -0.00148764   0.0014447 )
------------------------------------------------------------
#Fit statistic : Chi-Squared =          66.55 using 59 PHA bins.
# Reduced chi-squared =          1.168 for     57 degrees of freedom
# Null hypothesis probability =   1.811924e-01

Photon flux (15-150 keV)    in 1 sec: 0.804723 ( -0.174042  0.174052 ) ph/cm2/s
Energy fluence (15-150 keV)             : 5.11081e-08 ( -1.29892e-08  1.35034e-08 ) ergs/cm2
Cutoff power-law model
Time interval is from    2.996 sec. to    3.996 sec.
Spectral model in the cutoff power-law:
------------------------------------------------------------
Parameters  : value       lower 90%   higher 90%
Photon index: 0.129062     ( -1.78809   2.63331 )
Epeak [keV] : 42.2439      ( -12.0877 25.3874 )
Norm@50keV  : 8.82636E-02    ( -0.0883453   3.20925 )
------------------------------------------------------------
#Fit statistic : Chi-Squared =          62.59 using 59 PHA bins.
# Reduced chi-squared =          1.118 for     56 degrees of freedom
# Null hypothesis probability =   2.540308e-01

Photon flux (15-150 keV)    in 1 sec: 0.772599 ( -0.172521  0.174237 ) ph/cm2/s
Energy fluence (15-150 keV)             : 4.43956e-08 ( -1.15309e-08  1.36688e-08 ) ergs/cm2
Time-resolved spectra
Distribution
T90 vs. Hardness ratio plot
T90                                   = 91.856 sec.
Hardness ratio (energy fluence ratio) = 0.816827019222
S(15-50 keV) vs. S(50-150 keV) plot

S(15-50 keV)  = 7.409447e-07
S(50-150 keV) = 4.826622e-07
The dash-dotted line and the dashed line traces the fluences calculated from the Band function with Epeak = 15 and 150 keV, respectively. Both lines assume a canonical values of alpha = -1 and beta = -2.5.
Mask shadow pattern
IMX = 6.751868112415501E-01, IMY = -1.906477255123337E-01
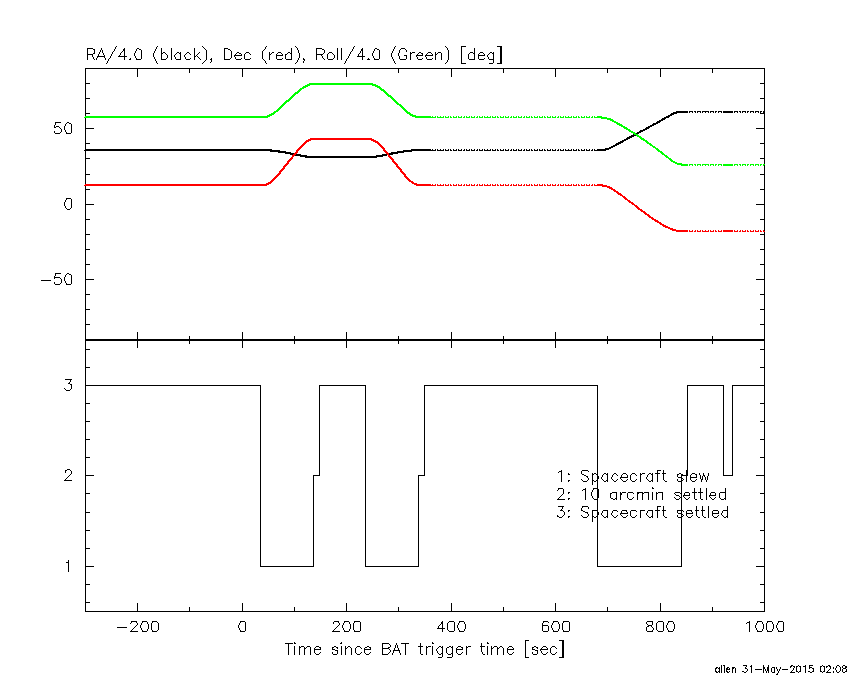
Spacecraft aspect plot
Bright source in the pre-burst/pre-slew/post-slew images
Pre-burst image of 15-350 keV band
Time interval of the image:
-239.744000 -6.080000

# RAcent  DECcent POSerr Theta    Phi  PeakCts   SNR AngSep     Name
#  [deg]    [deg]    ['] [deg]  [deg]                   [']
 96.8805  46.6460    2.3  51.8    0.8   2.1528   5.1 ------	UNKNOWN
115.0850  20.6240    2.8  28.3  -29.4   0.6575   4.1 ------	UNKNOWN
167.5869 -36.4271    2.5  54.0 -163.8   2.2161   4.6 ------	UNKNOWN
146.7529 -41.4824    4.2  54.1 -142.9   2.7792   2.8 ------	UNKNOWN
 94.3353   8.0823    2.5  48.4  -50.1   3.4364   4.7 ------	UNKNOWN
111.0388 -12.8386    2.3  40.9  -86.9   3.7537   5.2 ------	UNKNOWN
Pre-slew background subtracted image of 15-350 keV band
Time interval of the image:
-6.080000 34.956600

# RAcent  DECcent POSerr Theta    Phi  PeakCts   SNR AngSep     Name
#  [deg]    [deg]    ['] [deg]  [deg]                   [']
124.3097  43.4603    0.5  35.1   15.8   2.1682  24.8 ------	UNKNOWN
116.1941 -18.3066    3.0  40.9  -98.2   1.0041   3.8 ------	UNKNOWN
Post-slew image of 15-350 keV band
Time interval of the image:
136.356600 202.156900
203.256000 235.956600

# RAcent  DECcent POSerr Theta    Phi  PeakCts   SNR AngSep     Name
#  [deg]    [deg]    ['] [deg]  [deg]                   [']
 83.6210  22.0157    0.7  39.9 -158.8   2.2726  16.2    0.7	Crab
224.6682  71.4540    2.6  52.3  -26.3   1.3391   4.5 ------	UNKNOWN
237.8988  66.5985    2.5  58.9  -24.4   3.2387   4.6 ------	UNKNOWN
 62.9431  28.3339    2.8  50.8 -135.5   2.0676   4.2 ------	UNKNOWN