Analysis Summary
Notes:
- 1) No attempt has been made to eliminate the non-significant decimal places.
- 2) This batgrbproduct analysis is done using the HEASARC data.
- 3) This batgrbproduct analysis is using the flight position for the mask-weighting calculation.
==========================================================================
BAT GROUND-DETECTED GRB DATA PROCESSING REPORT
Process Script: hand-made scripts that follow steps in batgrbproduct
but without using TDRSS info
Process Start Time: Mon Sep 29 23:59:47 EDT 2014
Host Name: bat1
Current Working Dir: /local/data/bat1/alien/Swift_3rdBATcatalog/event/ground_detect_bursts/scripts
==========================================================================
BAT Trigger Time: 288007625.544
UTC: 2010-02-16T10:07:00.009 [includes UTCF correction]
Where From?: Ground analysis (best_duration.txt)
NOTE: BAT trigger time for ground-detected burst is the T100 start time.
Analysis Position: [ source = GCN ]
RA: 154.263 Dec: 35.524 [deg; J2000]
Refined Position: [ source = BAT pre-slew image ]
RA: 154.263 Dec: 35.524 [deg; J2000]
{ 10h 17m 03.1s , +35d 31' 26.4" }
+/- 3.1240309416 [arcmin] (estimated 90% radius based on SNR)
SNR: 5.97639118832
Angular difference between the analysis and refined position is 0.000000 arcmin
Partial Coding Fraction: 3.476562e-01 [ including projection effects ]
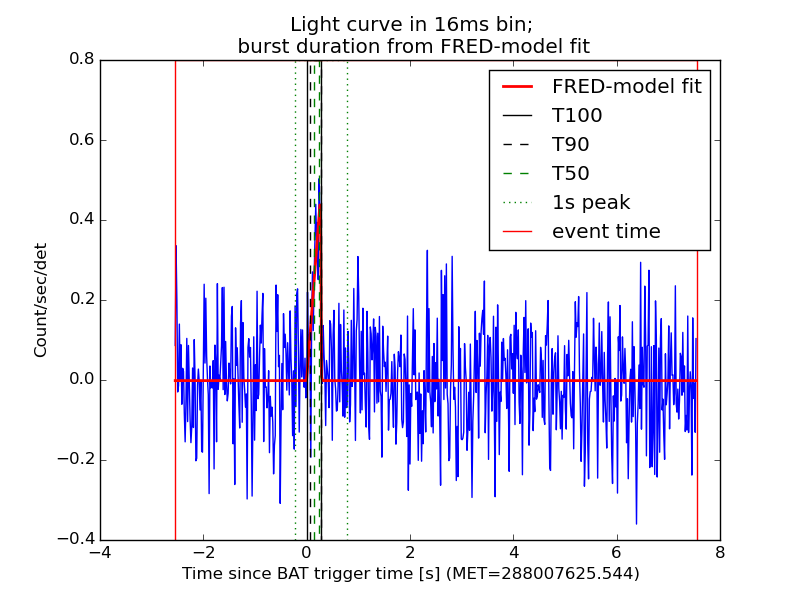
Duration (found by FRED-model fit)
T90: 0.208 +/- N/A
Measured from: 0.064
to: 0.272 [s; relative to TRIGTIME]
T50: 0.096 +/- N/A
Measured from: 0.144
to: 0.24
====== Table of the duration information =============================
Value tstart tstop
T100 0.272 0.000 0.272
T90 0.208 0.064 0.272
T50 0.096 0.144 0.240
Peak 1.000 -0.229 0.771
====== Spectral Analysis Summary =====================================
Model : spectral model: simple power-law (PL) and cutoff power-law (CPL)
Ph_index : photon index: E^{Ph_index}
Ph_90err : 90% error of the photon index
Epeak : Epeak in keV
Epeak_90err: 90% error of Epeak
Norm : normalization at 50 keV in both the PL model and CPL model
Nomr_90err : 90% error of the normalization
chi2 : Chi-Squared
dof : degree of freedo
=== Time-averaged spectral analysis ===
(Best model with acceptable fit: PL)
Model Ph_index Ph_90err_low Ph_90err_hi Epeak Epeak_90err_low Epeak_90err_hi Norm Nomr_90err_low Norm_90err_hi chi2 dof
PL -1.348 -0.469 0.456 - - - 9.92e-03 -3.32e-03 3.32e-03 54.450 57
CPL 1.434 -2.462 4.968 76.964 -19.743 100.188 1.44e-01 -1.44e-01 8.32e+00 50.660 56
=== 1-s peak spectral analysis ===
(Best model with acceptable fit: N/A)
Model Ph_index Ph_90err_low Ph_90err_hi Epeak Epeak_90err_low Epeak_90err_hi Norm Nomr_90err_low Norm_90err_hi chi2 dof
PL 0.012 -0.626 0.882 - - - 4.28e-03 -2.21e-03 2.09e-03 50.870 57
CPL 0.026 -1.507 2.394 9834.600 -9834.600 -9834.600 4.33e-03 -1.28e-03 5.08e-02 50.870 56
=== Fluence/Peak Flux Summary ===
Model Band1 Band2 Band3 Band4 Band5 Total
15-25 25-50 50-100 100-350 15-150 15-350 keV
Fluence PL 2.99e-09 6.03e-09 9.47e-09 3.29e-08 2.64e-08 5.14e-08 erg/cm2
90%_error_low -1.47e-09 -2.23e-09 -3.53e-09 -1.90e-08 -9.11e-09 -2.31e-08 erg/cm2
90%_error_hi 1.69e-09 2.19e-09 3.46e-09 2.68e-08 9.13e-09 2.86e-08 erg/cm2
Peak flux PL 4.23e-02 1.07e-01 2.15e-01 1.09e+00 5.80e-01 1.45e+00 ph/cm2/s
90%_error_low -4.23e-02 -6.66e-02 -2.15e-01 -5.42e-01 -1.86e-01 -5.20e-01 ph/cm2/s
90%_error_hi 6.16e-02 7.85e-02 6.63e-02 1.05e+00 1.93e-01 9.30e-01 ph/cm2/s
Fluence CPL 1.38e-09 7.08e-09 1.44e-08 7.63e-09 2.86e-08 3.05e-08 erg/cm2
90%_error_low -1.25e-09 -3.48e-09 -5.72e-09 -6.33e-09 -9.75e-09 -1.13e-08 erg/cm2
90%_error_hi 2.12e-09 2.98e-09 6.38e-09 1.93e-08 9.70e-09 1.77e-08 erg/cm2
Peak flux CPL 3.93e-02 1.05e-01 2.18e-01 1.06e+00 5.78e-01 1.30e+00 ph/cm2/s
90%_error_low -3.93e-02 -7.52e-02 -7.47e-02 -1.06e+00 -1.83e-01 -7.83e-01 ph/cm2/s
90%_error_hi 6.34e-02 7.97e-02 9.15e-02 1.14e+00 1.82e-01 6.85e-01 ph/cm2/s
======================================================================
Image
15.0-350.0 keV image (Event data)
#RAcent DECcent POSerr Theta  Phi  Peak_Cts  SNR Name
154.263 35.524 0.000 30.615 79.915 0.064 5.976 TRIG_00412522

Image time interval: 0.000 to 0.272 [sec]
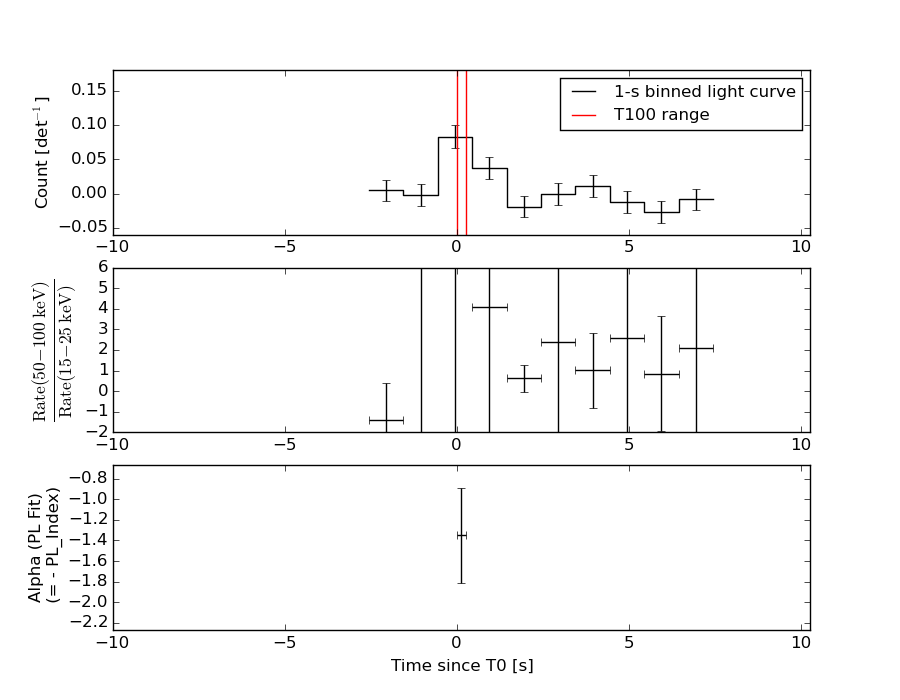
Light Curves
Note: The mask-weighted lightcurves have units of either count/det or counts/sec/det, where a det is 0.4 x 0.4 = 0.16 sq cm.
Best duration plot
Full-time range; 1 s binning
Other quick-look light curves:
- 64 ms binning (zoomed)
- 16 ms binning (zoomed)
- 8 ms binning (zoomed)
- 2 ms binning (zoomed)
- SN=5 or 10 s binning (full-time range)
- Raw light curve
Spectra
- 64 ms binning (zoomed)
- 16 ms binning (zoomed)
- 8 ms binning (zoomed)
- 2 ms binning (zoomed)
- SN=5 or 10 s binning (full-time range)
- Raw light curve
Spectra
Notes:
- 1) The fitting includes the systematic errors.
- 2) When the burst includes telescope slew time periods, the fitting uses an average response file made from multiple 5-s response files through out the slew time plus single time preiod for the non-slew times, and weighted by the total counts in the corresponding time period using addrmf. An average response file is needed becuase a spectral fit using the pre-slew DRM will introduce some errors in both a spectral shape and a normalization if the PHA file contains a lot of the slew/post-slew time interval.
- 3) For fits to more complicated models (e.g. a power-law over a cutoff power-law), the BAT team has decided to require a chi-square improvement of more than 6 for each extra dof.
Time averaged spectrum fit using the average DRM
Power-law model
Time interval is from    0.000 sec. to    0.272 sec.

Spectral model in power-law:
------------------------------------------------------------
Parameters  : value       lower 90%   higher 90%
Photon index: -1.34751     ( -0.469008   0.45613 )
Norm@50keV  : 9.91768E-03    ( -0.00331672   0.00331611 )
------------------------------------------------------------
#Fit statistic : Chi-Squared =          54.45 using 59 PHA bins.
# Reduced chi-squared =         0.9552 for     57 degrees of freedom
# Null hypothesis probability =   5.714234e-01

Photon flux (15-150 keV)    in 0.272 sec: 1.19429 ( -0.41445  0.41702 ) ph/cm2/s
Energy fluence (15-150 keV)             : 2.63632e-08 ( -9.10651e-09  9.12699e-09 ) ergs/cm2
Cutoff power-law model
Time interval is from    0.000 sec. to    0.272 sec.
Spectral model in the cutoff power-law:
------------------------------------------------------------
Parameters  : value       lower 90%   higher 90%
Photon index: 1.43445     ( -2.46258   4.96831 )
Epeak [keV] : 76.9637      ( -19.7429 100.188 )
Norm@50keV  : 0.144397    ( -0.14442   8.3193 )
------------------------------------------------------------
#Fit statistic : Chi-Squared =          50.66 using 59 PHA bins.
# Reduced chi-squared =         0.9046 for     56 degrees of freedom
# Null hypothesis probability =   6.765763e-01

Photon flux (15-150 keV)    in 0.272 sec: 1.17712 ( -0.411969  0.42155 ) ph/cm2/s
Energy fluence (15-150 keV)             : 2.86443e-08 ( -9.75142e-09  9.70069e-09 ) ergs/cm2
1-s peak spectrum fit
Power-law model

Time interval is from   -0.229 sec. to    0.771 sec.

Spectral model in power-law:
------------------------------------------------------------
Parameters  : value       lower 90%   higher 90%
Photon index: 0.0117755     ( -0.626319   0.882154 )
Norm@50keV  : 4.27923E-03    ( -0.00220813   0.00209005 )
------------------------------------------------------------
#Fit statistic : Chi-Squared =          50.87 using 59 PHA bins.
# Reduced chi-squared =         0.8925 for     57 degrees of freedom
# Null hypothesis probability =   7.028594e-01

Photon flux (15-150 keV)    in 1 sec: 0.580123 ( -0.185533  0.193171 ) ph/cm2/s
Energy fluence (15-150 keV)             : 7.69219e-08 ( -2.12969e-08  2.12959e-08 ) ergs/cm2
Cutoff power-law model
Time interval is from   -0.229 sec. to    0.771 sec.
Spectral model in the cutoff power-law:
------------------------------------------------------------
Parameters  : value       lower 90%   higher 90%
Photon index: 0.0263121     ( -1.50731   2.39391 )
Epeak [keV] : 9834.60      ( -9224.23 -9224.23 )
Norm@50keV  : 4.33075E-03    ( -0.00128727   0.0508343 )
------------------------------------------------------------
#Fit statistic : Chi-Squared =          50.87 using 59 PHA bins.
# Reduced chi-squared =         0.9084 for     56 degrees of freedom
# Null hypothesis probability =   6.687921e-01

Photon flux (15-150 keV)    in 1 sec: 0.577733 ( -0.182624  0.182282 ) ph/cm2/s
Energy fluence (15-150 keV)             : 7.70566e-08 ( -2.13585e-08  2.13151e-08 ) ergs/cm2
Time-resolved spectra
Distribution
T90 vs. Hardness ratio plot
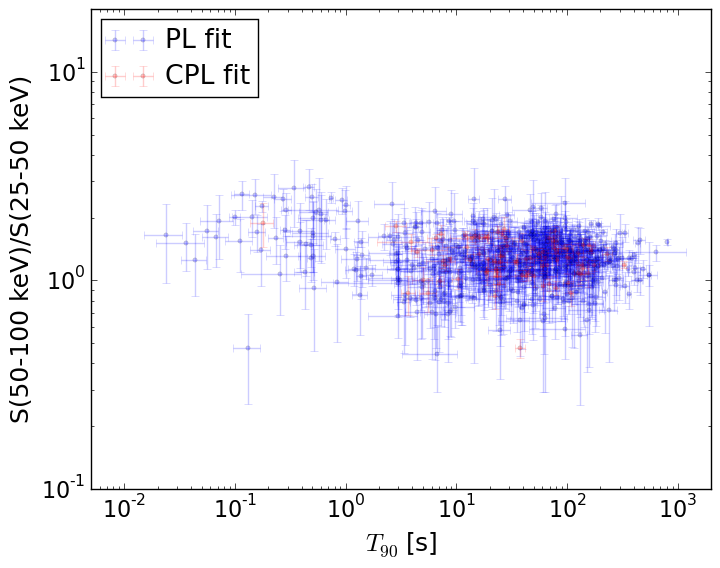
T90                                   = N/A sec.
Hardness ratio (energy fluence ratio) = N/A
S(15-50 keV) vs. S(50-150 keV) plot
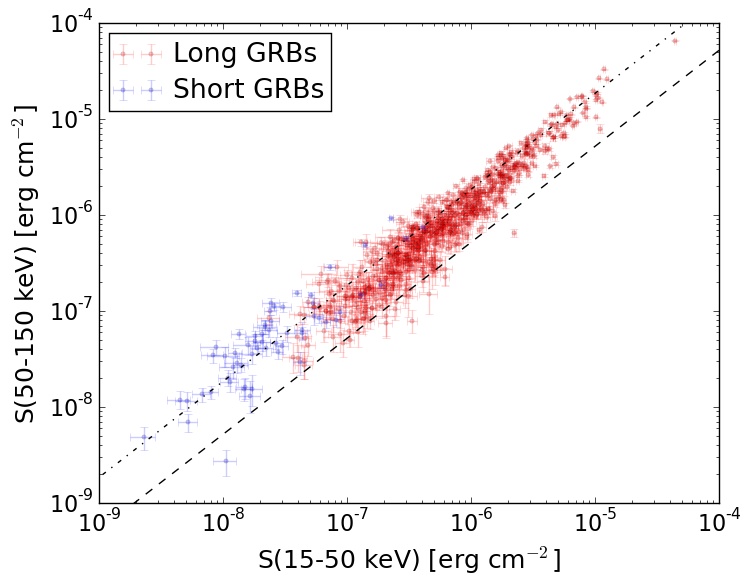
S(15-50 keV)  = N/A
S(50-150 keV) = N/A
The dash-dotted line and the dashed line traces the fluences calculated from the Band function with Epeak = 15 and 150 keV, respectively. Both lines assume a canonical values of alpha = -1 and beta = -2.5.
Mask shadow pattern
IMX = 0.103619090244, IMY = -0.582614365162
Spacecraft aspect plot
Bright source in the event data image
Event data image of 15-350 keV band
Time interval of the image:
0.000000 0.272000

# RAcent  DECcent POSerr Theta    Phi  PeakCts   SNR AngSep     Name
#  [deg]    [deg]    ['] [deg]  [deg]                   [']
154.2860  35.5205    1.9  30.6   79.9   0.0652   6.1 ------	UNKNOWN
150.5188  63.6638    2.5   5.6  140.4   0.0227   4.6 ------	UNKNOWN
247.1030  67.5677    2.0  30.9  -66.1   0.0423   5.7 ------	UNKNOWN
 23.2815  58.7122    2.7  51.9 -139.2   0.1085   4.2 ------	UNKNOWN
Webpage updated on:
Wed Nov 25 14:04:19 EST 2015