Analysis Summary
Notes:
- 1) No attempt has been made to eliminate the non-significant decimal places.
- 2) This batgrbproduct analysis is done using the HEASARC data.
- 3) This batgrbproduct analysis is using the flight position for the mask-weighting calculation.
======================================================================
                  BAT GRB EVENT DATA PROCESSING REPORT
    Process Script Ver: batgrbproduct v2.46
    Process Start Time: Fri Jan 17 19:44:54 EST 2014
             Host Name: batevent1
   Current Working Dir: /local/data/batevent/batevent_reproc/trigger412982
======================================================================

  Trigger: 00412982      Segment: 000

  BAT Trigger Time: 288285352   [s; MET]
      Trigger Stop: 288285416   [s; MET]
               UTC: 2010-02-19T15:15:46.455360    [includes UTCF correction]
       Where From?: TDRSS position message

  BAT
    RA: 154.220640694763   Dec: -12.559076333116  [deg; J2000]

     Catalogged Source?: NO
     Point Source?:      YES
     GRB Indicated?:     YES    [ by BAT flight software ]
     Image S/N Ratio:    7.44
     Image Trigger?:     YES
     Rate S/N Ratio:     0  [ if not an image trigger ]
     Image S/N Ratio:    7.44

  Analysis Position:   [ source = BAT ]
    RA: 154.220640694763   Dec: -12.559076333116  [deg; J2000]

  Refined Position:   [ source = BAT pre-slew burst ]
    RA: 154.185828031436   Dec: -12.5637164236549  [deg; J2000]
        { 10h 16m 44.6s , -12d 33' 49.4" }
         +/- 2.23183072667931 [arcmin] (estimated 90% radius based on SNR)
         +/- 1.20648166159209 [arcmin] (formal 1-sigma fit error)
    SNR: 9.66119563606363

  Angular difference between the analysis and refined position is 2.057683 arcmin

  Partial Coding Fraction: 0.7109375    [ including projection effects ]

  Duration
     T90: 27.5719999670982 +/- 8.64985226233539
        Measured from: 20.1159999966621
                   to: 47.6879999637604     [s; relative to TRIGTIME]
     T50: 13.2919999361038 +/- 6.21360185442746
        Measured from: 22.7919999957085
                   to: 36.0839999318123     [s; relative to TRIGTIME]


  Fluence
     Peak Flux  (peak 1 second)
        Measured from: 31.8920000195503
                   to: 32.8920000195503     [s; relative to TRIGTIME]
     Total Fluence
        Measured from: 12.7879999876022
                   to: 51.8199999928474     [s; relative to TRIGTIME]

             Band 1     Band 2     Band 3     Band 4
              15-25      25-50     50-100    100-350     keV
 Total     0.146150   0.286497   0.216678   0.039743
           0.034302   0.035392   0.031521   0.027488 [error]
 Peak      0.010795   0.020475   0.014503   0.004640
           0.005442   0.005671   0.005044   0.004274 [error]

     [ fluence units of on-axis counts / fully illuminated detector ]

======================================================================


====== Table of the duration information =============================

        Value   tstart    tstop
T100   39.032   12.788   51.820
T90    27.572   20.116   47.688
T50    13.292   22.792   36.084
Peak    1.000   31.892   32.892


====== Spectral Analysis Summary =====================================

Model      : spectral model: simple power-law (PL) and cutoff power-law (CPL)
Ph_index   : photon index: E^{Ph_index}
Ph_90err   : 90% error of the photon index
Epeak      : Epeak in keV
Epeak_90err: 90% error of Epeak
Norm       : normalization at 50 keV in both the PL model and CPL model
Nomr_90err : 90% error of the normalization
chi2       : Chi-Squared
dof        : degree of freedo

=== Time-averaged spectral analysis ===
(Best model with acceptable fit: N/A)

Model Ph_index Ph_90err_low Ph_90err_hi  Epeak  Epeak_90err_low  Epeak_90err_hi  Norm       Nomr_90err_low    Norm_90err_hi    chi2    dof
PL      -1.330    -0.250      0.252       -           -               -         1.21e-03     -1.77e-04          1.77e-04      73.480   57
CPL     -0.890    -0.644      1.090      129.147    -129.147      -129.147      2.01e-03        N/A               N/A         72.780   56


=== 1-s peak spectral analysis ===
(Best model with acceptable fit: PL)

Model Ph_index Ph_90err_low Ph_90err_hi  Epeak  Epeak_90err_low  Epeak_90err_hi  Norm       Nomr_90err_low    Norm_90err_hi    chi2    dof
PL      -1.426     -0.612     0.631       -           -               -         3.28e-03     -1.12e-03          1.09e-03      69.490   57
CPL     -1.435     -0.603     0.646     9999.350    -9999.350      -9999.350      3.27e-03     -3.27e-03          1.82e-01      69.490   56


=== Fluence/Peak Flux Summary ===

              Model    Band1     Band2     Band3     Band4     Band5     Total
                       15-25     25-50    50-100    100-350    15-150    15-350    keV
Fluence         PL   5.16e-08  1.05e-07  1.67e-07  5.92e-07  4.65e-07  9.16e-07   erg/cm2
      90%_error_low -1.28e-08 -1.67e-08 -3.06e-08 -2.04e-07 -7.54e-08 -2.31e-07   erg/cm2
      90%_error_hi   1.37e-08  1.64e-08  3.03e-08  2.69e-07  7.64e-08  2.85e-07   erg/cm2
Peak flux       PL   1.26e-01  1.32e-01  9.84e-02  1.18e-01  4.02e-01  4.75e-01   ph/cm2/s
      90%_error_low -6.72e-02 -4.80e-02 -4.20e-02 -7.75e-02 -1.33e-01 -1.59e-01   ph/cm2/s
      90%_error_hi   7.61e-02  4.58e-02  4.11e-02  1.44e-01  1.33e-01  1.64e-01   ph/cm2/s

Fluence        CPL   4.77e-08  1.10e-07  1.73e-07  3.13e-07  4.50e-07  6.44e-07   erg/cm2
      90%_error_low -1.50e-08 -1.93e-08 -3.31e-08 -2.21e-07 -8.28e-08 -2.37e-07   erg/cm2
      90%_error_hi   1.56e-08  2.03e-08  3.41e-08  5.30e-07  8.22e-08  3.72e-07   erg/cm2
Peak flux      CPL   1.30e-01  1.30e-01  9.71e-02  1.18e-01  4.03e-01  4.78e-01   ph/cm2/s
      90%_error_low     N/A   -4.82e-02 -4.08e-02     N/A   -1.34e-01 -1.93e-01   ph/cm2/s
      90%_error_hi      N/A    5.13e-02  4.30e-02     N/A    1.32e-01  1.48e-01   ph/cm2/s

======================================================================
Image
Pre-slew 15.0-350.0 keV image (Event data)
#   RAcent    DECcent   POSerr    Theta     Phi              Peak Cts       SNR   Name
  154.1858   -12.5637   0.0199    25.4314    32.2792         0.6543365      9.661 TRIG_00412982

Foreground time interval of the image:
 12.788  51.820 (delta_t =  39.032 [sec])
Background time interval of the image:
-239.000  12.788 (delta_t = 251.788 [sec])
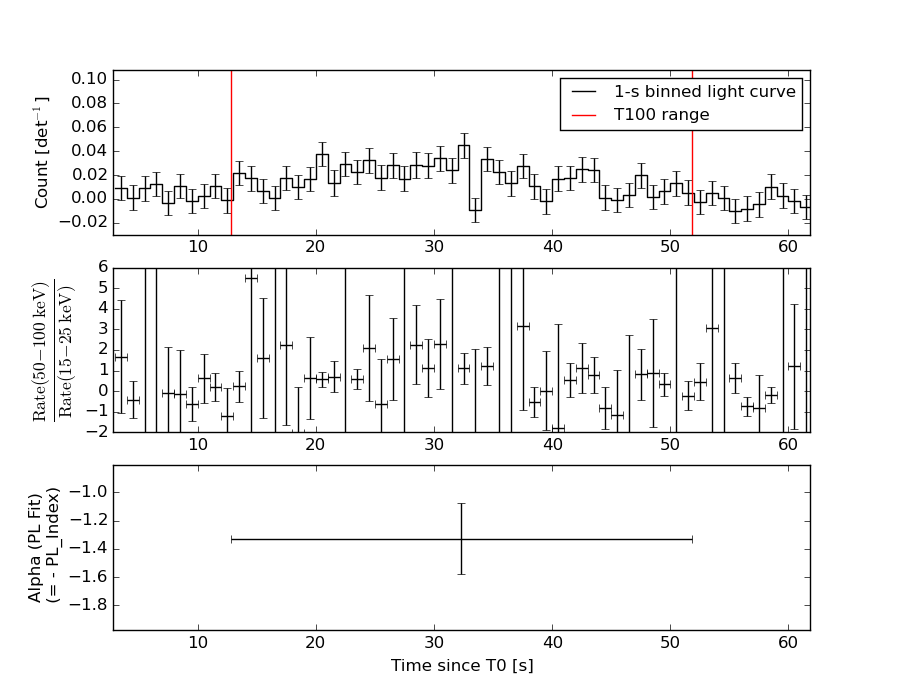
Light Curves
Note: The mask-weighted lightcurves have units of either count/det or counts/sec/det, where a det is 0.4 x 0.4 = 0.16 sq cm.
Full-time range; 1 s binning
Other quick-look light curves:
- 64 ms binning (zoomed)
- 16 ms binning (zoomed)
- 8 ms binning (zoomed)
- 2 ms binning (zoomed)
- SN=5 or 10 s binning (full-time range)
- Raw light curve
Spectra
- 64 ms binning (zoomed)
- 16 ms binning (zoomed)
- 8 ms binning (zoomed)
- 2 ms binning (zoomed)
- SN=5 or 10 s binning (full-time range)
- Raw light curve
Spectra
Notes:
- 1) The fitting includes the systematic errors.
- 2) When the burst includes telescope slew time periods, the fitting uses an average response file made from multiple 5-s response files through out the slew time plus single time preiod for the non-slew times, and weighted by the total counts in the corresponding time period using addrmf. An average response file is needed becuase a spectral fit using the pre-slew DRM will introduce some errors in both a spectral shape and a normalization if the PHA file contains a lot of the slew/post-slew time interval.
- 3) For fits to more complicated models (e.g. a power-law over a cutoff power-law), the BAT team has decided to require a chi-square improvement of more than 6 for each extra dof.
Time averaged spectrum fit using the average DRM
Power-law model
Time interval is from   12.788 sec. to   51.820 sec.

Spectral model in power-law:
------------------------------------------------------------
Parameters  : value       lower 90%   higher 90%
Photon index: -1.33005     ( -0.250274   0.252181 )
Norm@50keV  : 1.21333E-03    ( -0.000177329   0.000176939 )
------------------------------------------------------------
#Fit statistic : Chi-Squared =          73.48 using 59 PHA bins.
# Reduced chi-squared =          1.289 for     57 degrees of freedom
# Null hypothesis probability =   6.986298e-02

Photon flux (15-150 keV)    in 39.03 sec: 0.145587 ( -0.021543  0.021589 ) ph/cm2/s
Energy fluence (15-150 keV)             : 4.64683e-07 ( -7.53529e-08  7.63556e-08 ) ergs/cm2
Cutoff power-law model
Time interval is from   12.788 sec. to   51.820 sec.
Spectral model in the cutoff power-law:
------------------------------------------------------------
Parameters  : value       lower 90%   higher 90%
Photon index: -0.890499     ( -0.643679   1.08997 )
Epeak [keV] : 129.147      ( -129.146 -129.146 )
Norm@50keV  : 2.00696E-03    (     )
------------------------------------------------------------
#Fit statistic : Chi-Squared =          72.78 using 59 PHA bins.
# Reduced chi-squared =          1.300 for     56 degrees of freedom
# Null hypothesis probability =   6.524765e-02

Photon flux (15-150 keV)    in 39.03 sec: 0.142938 ( -0.022235  0.022237 ) ph/cm2/s
Energy fluence (15-150 keV)             : 4.49633e-07 ( -8.27834e-08  8.22405e-08 ) ergs/cm2
1-s peak spectrum fit
Power-law model
Time interval is from   31.892 sec. to   32.892 sec.

Spectral model in power-law:
------------------------------------------------------------
Parameters  : value       lower 90%   higher 90%
Photon index: -1.42603     ( -0.611933   0.630705 )
Norm@50keV  : 3.27851E-03    ( -0.00112355   0.00109226 )
------------------------------------------------------------
#Fit statistic : Chi-Squared =          69.49 using 59 PHA bins.
# Reduced chi-squared =          1.219 for     57 degrees of freedom
# Null hypothesis probability =   1.240238e-01

Photon flux (15-150 keV)    in 1 sec: 0.401692 ( -0.132539  0.132878 ) ph/cm2/s
Energy fluence (15-150 keV)             : 3.15195e-08 ( -1.16531e-08  1.21321e-08 ) ergs/cm2
Cutoff power-law model
Time interval is from   31.892 sec. to   32.892 sec.
Spectral model in the cutoff power-law:
------------------------------------------------------------
Parameters  : value       lower 90%   higher 90%
Photon index: -1.43525     ( -0.604289   0.644794 )
Epeak [keV] : 9999.35      ( -9999.36 -9999.36 )
Norm@50keV  : 3.26866E-03    ( -0.00328429   0.18245 )
------------------------------------------------------------
#Fit statistic : Chi-Squared =          69.49 using 59 PHA bins.
# Reduced chi-squared =          1.241 for     56 degrees of freedom
# Null hypothesis probability =   1.062544e-01

Photon flux (15-150 keV)    in 1 sec: 0.402668 ( -0.133723  0.13219 ) ph/cm2/s
Energy fluence (15-150 keV)             : 3.18105e-08 ( -1.45501e-08  8.30941e-09 ) ergs/cm2
Time-resolved spectra
Distribution
T90 vs. Hardness ratio plot
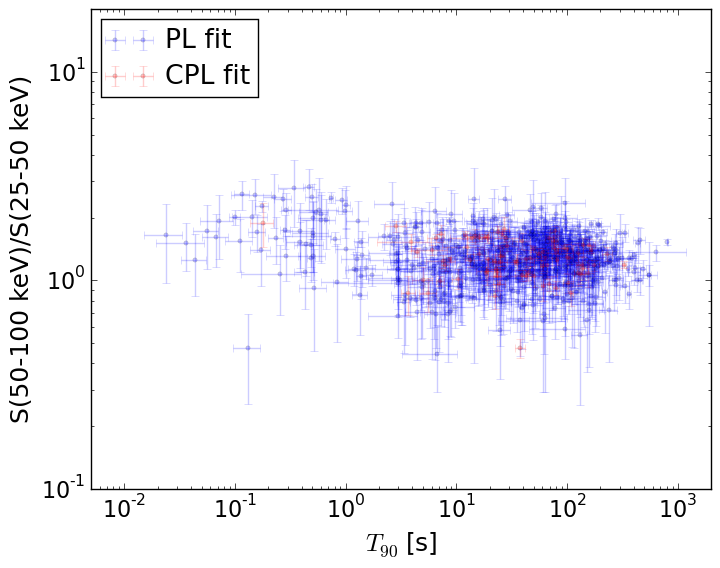
T90                                   = N/A sec.
Hardness ratio (energy fluence ratio) = N/A
S(15-50 keV) vs. S(50-150 keV) plot
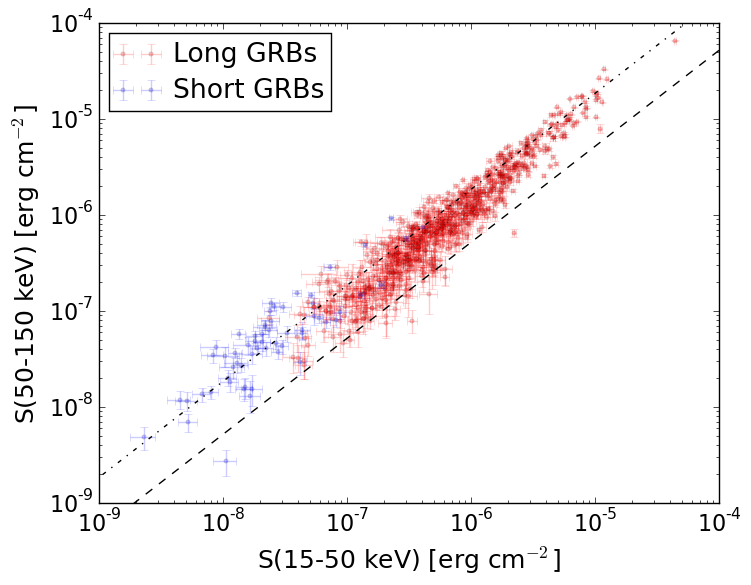
S(15-50 keV)  = N/A
S(50-150 keV) = N/A
The dash-dotted line and the dashed line traces the fluences calculated from the Band function with Epeak = 15 and 150 keV, respectively. Both lines assume a canonical values of alpha = -1 and beta = -2.5.
Mask shadow pattern
IMX = 4.020194749823532E-01, IMY = -2.539418011358059E-01
Spacecraft aspect plot
Bright source in the pre-burst/pre-slew/post-slew images
Pre-burst image of 15-350 keV band
Time interval of the image:
-239.000000 12.788000

# RAcent  DECcent POSerr Theta    Phi  PeakCts   SNR AngSep     Name
#  [deg]    [deg]    ['] [deg]  [deg]                   [']
136.8581 -32.5822    2.6  51.0   31.1   3.6704   4.5 ------	UNKNOWN
150.2170  59.6362    2.5  53.9  163.2   3.9159   4.6 ------	UNKNOWN
177.6826  54.3326    2.3  47.0 -178.3   1.6127   5.1 ------	UNKNOWN
206.6066 -19.2657    2.8  45.4  -57.8   3.0501   4.1 ------	UNKNOWN
Pre-slew background subtracted image of 15-350 keV band
Time interval of the image:
12.788000 51.820000

# RAcent  DECcent POSerr Theta    Phi  PeakCts   SNR AngSep     Name
#  [deg]    [deg]    ['] [deg]  [deg]                   [']
154.1858 -12.5637    1.2  25.4   32.3   0.6545   9.7 ------	UNKNOWN
198.8545  40.6955    2.5  42.0 -151.1   0.4300   4.7 ------	UNKNOWN
Post-slew image of 15-350 keV band
Time interval of the image:
159.700600 963.050000

# RAcent  DECcent POSerr Theta    Phi  PeakCts   SNR AngSep     Name
#  [deg]    [deg]    ['] [deg]  [deg]                   [']
135.5488 -40.5591    0.7  32.5  -59.7  11.0134  17.6    1.0	Vela X-1
 96.5481 -17.3416    2.7  55.7   -9.2   5.8147   4.3 ------	UNKNOWN
205.3646 -37.3810    3.9  51.8 -138.6   5.8675   3.0 ------	UNKNOWN
187.4622 -47.1794    3.0  44.5 -118.8   6.5366   3.9 ------	UNKNOWN