Analysis Summary
Notes:
- 1) No attempt has been made to eliminate the non-significant decimal places.
- 2) This batgrbproduct analysis is done using the HEASARC data.
- 3) This batgrbproduct analysis is using the flight position for the mask-weighting calculation.
======================================================================
BAT GRB EVENT DATA PROCESSING REPORT
Process Script Ver: batgrbproduct v2.46
Process Start Time: Fri Jan 17 19:41:56 EST 2014
Host Name: batevent1
Current Working Dir: /local/data/batevent/batevent_reproc/trigger414592
======================================================================
Trigger: 00414592 Segment: 000
BAT Trigger Time: 289252392 [s; MET]
Trigger Stop: 289252456 [s; MET]
UTC: 2010-03-02T19:53:06.422100 [includes UTCF correction]
Where From?: TDRSS position message
BAT
RA: 195.344380663184 Dec: 74.580871005255 [deg; J2000]
Catalogged Source?: NO
Point Source?: YES
GRB Indicated?: YES [ by BAT flight software ]
Image S/N Ratio: 7.73
Image Trigger?: YES
Rate S/N Ratio: 0 [ if not an image trigger ]
Image S/N Ratio: 7.73
Analysis Position: [ source = BAT ]
RA: 195.344380663184 Dec: 74.580871005255 [deg; J2000]
Refined Position: [ source = BAT pre-slew burst ]
RA: 195.475242785576 Dec: 74.5692925151686 [deg; J2000]
{ 13h 01m 54.1s , +74d 34' 09.5" }
+/- 1.59383391749263 [arcmin] (estimated 90% radius based on SNR)
+/- 0.613321779602 [arcmin] (formal 1-sigma fit error)
SNR: 15.6283814248711
Angular difference between the analysis and refined position is 2.200884 arcmin
Partial Coding Fraction: 0.984375 [ including projection effects ]
Duration
T90: 17.947999894619 +/- 1.64402065685618
Measured from: 48.5440000295639
to: 66.4919999241829 [s; relative to TRIGTIME]
T50: 11.6279999613762 +/- 2.65149015969284
Measured from: 52.2799999713898
to: 63.907999932766 [s; relative to TRIGTIME]
Fluence
Peak Flux (peak 1 second)
Measured from: 63.8719999790192
to: 64.8719999790192 [s; relative to TRIGTIME]
Total Fluence
Measured from: 47.6439999938011
to: 67.2919999957085 [s; relative to TRIGTIME]
Band 1 Band 2 Band 3 Band 4
15-25 25-50 50-100 100-350 keV
Total 0.196334 0.211153 0.147379 0.001826
0.019835 0.020709 0.018056 0.015498 [error]
Peak 0.017478 0.023239 0.015487 0.004000
0.004503 0.004711 0.004112 0.003402 [error]
[ fluence units of on-axis counts / fully illuminated detector ]
======================================================================
====== Table of the duration information =============================
Value tstart tstop
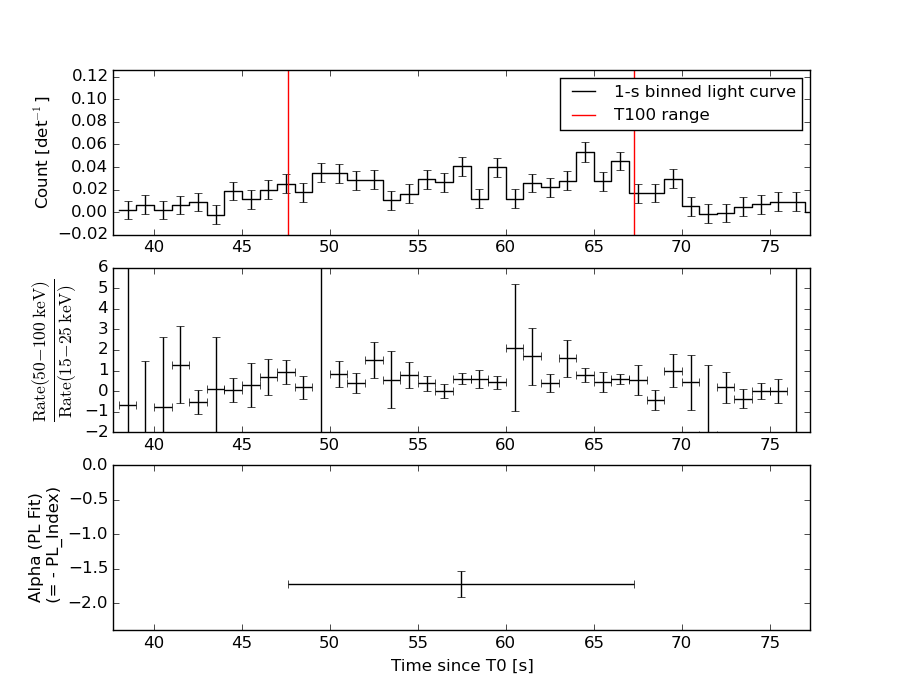
T100 19.648 47.644 67.292
T90 17.948 48.544 66.492
T50 11.628 52.280 63.908
Peak 1.000 63.872 64.872
====== Spectral Analysis Summary =====================================
Model : spectral model: simple power-law (PL) and cutoff power-law (CPL)
Ph_index : photon index: E^{Ph_index}
Ph_90err : 90% error of the photon index
Epeak : Epeak in keV
Epeak_90err: 90% error of Epeak
Norm : normalization at 50 keV in both the PL model and CPL model
Nomr_90err : 90% error of the normalization
chi2 : Chi-Squared
dof : degree of freedo
=== Time-averaged spectral analysis ===
(Best model with acceptable fit: PL)
Model Ph_index Ph_90err_low Ph_90err_hi Epeak Epeak_90err_low Epeak_90err_hi Norm Nomr_90err_low Norm_90err_hi chi2 dof
PL -1.719 -0.196 0.190 - - - 1.74e-03 -2.12e-04 2.08e-04 50.020 57
CPL -1.433 -0.645 0.756 90.170 -39.736 -90.170 2.49e-03 -9.57e-04 3.83e-03 49.480 56
=== 1-s peak spectral analysis ===
(Best model with acceptable fit: PL)
Model Ph_index Ph_90err_low Ph_90err_hi Epeak Epeak_90err_low Epeak_90err_hi Norm Nomr_90err_low Norm_90err_hi chi2 dof
PL -1.343 -0.392 0.396 - - - 3.87e-03 -8.64e-04 8.57e-04 42.600 57
CPL -1.266 -2.683 1.611 458.973 -458.973 -458.973 4.25e-03 N/A N/A 42.630 56
=== Fluence/Peak Flux Summary ===
Model Band1 Band2 Band3 Band4 Band5 Total
15-25 25-50 50-100 100-350 15-150 15-350 keV
Fluence PL 5.36e-08 8.62e-08 1.05e-07 2.50e-07 3.16e-07 4.94e-07 erg/cm2
90%_error_low -8.39e-09 -8.98e-09 -1.73e-08 -7.51e-08 -4.00e-08 -9.35e-08 erg/cm2
90%_error_hi 8.64e-09 8.98e-09 1.74e-08 9.44e-08 4.07e-08 1.09e-07 erg/cm2
Peak flux PL 1.37e-01 1.51e-01 1.19e-01 1.55e-01 4.66e-01 5.63e-01 ph/cm2/s
90%_error_low -5.09e-02 -3.68e-02 -3.33e-02 -7.39e-02 -1.03e-01 -1.28e-01 ph/cm2/s
90%_error_hi 5.60e-02 3.58e-02 3.25e-02 1.08e-01 1.03e-01 1.33e-01 ph/cm2/s
Fluence CPL 5.18e-08 8.92e-08 1.05e-07 1.52e-07 3.07e-07 3.99e-07 erg/cm2
90%_error_low -9.50e-09 -1.07e-08 -1.82e-08 -9.98e-08 -4.42e-08 -1.12e-07 erg/cm2
90%_error_hi 9.48e-09 1.16e-08 1.83e-08 1.86e-07 4.52e-08 1.34e-07 erg/cm2
Peak flux CPL 1.38e-01 1.51e-01 1.19e-01 1.60e-01 4.66e-01 5.68e-01 ph/cm2/s
90%_error_low -5.79e-02 -3.62e-02 -3.20e-02 N/A -1.05e-01 -1.86e-01 ph/cm2/s
90%_error_hi 4.49e-02 4.44e-02 3.62e-02 N/A 1.03e-01 1.19e-01 ph/cm2/s
======================================================================
Image
Pre-slew 15.0-350.0 keV image (Event data)
#   RAcent    DECcent   POSerr    Theta     Phi              Peak Cts       SNR   Name
  195.4752    74.5693   0.0123    13.8607   -42.9273         0.5708646     15.628 TRIG_00414592

Foreground time interval of the image:
 47.644  67.292 (delta_t =  19.648 [sec])
Background time interval of the image:
-239.000  47.644 (delta_t = 286.644 [sec])
Light Curves
Note: The mask-weighted lightcurves have units of either count/det or counts/sec/det, where a det is 0.4 x 0.4 = 0.16 sq cm.
Full-time range; 1 s binning
Other quick-look light curves:
- 64 ms binning (zoomed)
- 16 ms binning (zoomed)
- 8 ms binning (zoomed)
- 2 ms binning (zoomed)
- SN=5 or 10 s binning (full-time range)
- Raw light curve
Spectra
- 64 ms binning (zoomed)
- 16 ms binning (zoomed)
- 8 ms binning (zoomed)
- 2 ms binning (zoomed)
- SN=5 or 10 s binning (full-time range)
- Raw light curve
Spectra
Notes:
- 1) The fitting includes the systematic errors.
- 2) When the burst includes telescope slew time periods, the fitting uses an average response file made from multiple 5-s response files through out the slew time plus single time preiod for the non-slew times, and weighted by the total counts in the corresponding time period using addrmf. An average response file is needed becuase a spectral fit using the pre-slew DRM will introduce some errors in both a spectral shape and a normalization if the PHA file contains a lot of the slew/post-slew time interval.
- 3) For fits to more complicated models (e.g. a power-law over a cutoff power-law), the BAT team has decided to require a chi-square improvement of more than 6 for each extra dof.
Time averaged spectrum fit using the average DRM
Power-law model
Time interval is from   47.644 sec. to   67.292 sec.

Spectral model in power-law:
------------------------------------------------------------
Parameters  : value       lower 90%   higher 90%
Photon index: -1.71889     ( -0.196177   0.189532 )
Norm@50keV  : 1.73852E-03    ( -0.000211846   0.000207553 )
------------------------------------------------------------
#Fit statistic : Chi-Squared =          50.02 using 59 PHA bins.
# Reduced chi-squared =         0.8775 for     57 degrees of freedom
# Null hypothesis probability =   7.321943e-01

Photon flux (15-150 keV)    in 19.65 sec: 0.232451 ( -0.024271  0.024275 ) ph/cm2/s
Energy fluence (15-150 keV)             : 3.15901e-07 ( -3.99563e-08  4.0749e-08 ) ergs/cm2
Cutoff power-law model

Time interval is from   47.644 sec. to   67.292 sec.
Spectral model in the cutoff power-law:
------------------------------------------------------------
Parameters  : value       lower 90%   higher 90%
Photon index: -1.43318     ( -0.644945   0.755949 )
Epeak [keV] : 90.1700      ( -39.7601 -90.1937 )
Norm@50keV  : 2.49143E-03    ( -0.000956334   0.00383067 )
------------------------------------------------------------
#Fit statistic : Chi-Squared =          49.48 using 59 PHA bins.
# Reduced chi-squared =         0.8835 for     56 degrees of freedom
# Null hypothesis probability =   7.185180e-01

Photon flux (15-150 keV)    in 19.65 sec: 0.229706 ( -0.025068  0.025048 ) ph/cm2/s
Energy fluence (15-150 keV)             : 3.07094e-07 ( -4.42231e-08  4.51895e-08 ) ergs/cm2
1-s peak spectrum fit
Power-law model

Time interval is from   63.872 sec. to   64.872 sec.

Spectral model in power-law:
------------------------------------------------------------
Parameters  : value       lower 90%   higher 90%
Photon index: -1.34285     ( -0.392188   0.395778 )
Norm@50keV  : 3.87139E-03    ( -0.000864445   0.00085708 )
------------------------------------------------------------
#Fit statistic : Chi-Squared =          42.60 using 59 PHA bins.
# Reduced chi-squared =         0.7474 for     57 degrees of freedom
# Null hypothesis probability =   9.220024e-01

Photon flux (15-150 keV)    in 1 sec: 0.465717 ( -0.103008  0.103198 ) ph/cm2/s
Energy fluence (15-150 keV)             : 3.78765e-08 ( -9.45349e-09  9.65921e-09 ) ergs/cm2
Cutoff power-law model
Time interval is from   63.872 sec. to   64.872 sec.
Spectral model in the cutoff power-law:
------------------------------------------------------------
Parameters  : value       lower 90%   higher 90%
Photon index: -1.33965     ( -2.67065   1.62368 )
Epeak [keV] : 9999.04      ( -9999.06 -9999.06 )
Norm@50keV  : 3.88658E-03    (     )
------------------------------------------------------------
#Fit statistic : Chi-Squared =          42.60 using 59 PHA bins.
# Reduced chi-squared =         0.7607 for     56 degrees of freedom
# Null hypothesis probability =   9.065099e-01

Photon flux (15-150 keV)    in 1 sec: 0.466312 ( -0.105315  0.103023 ) ph/cm2/s
Energy fluence (15-150 keV)             : 3.78643e-08 ( 0  0 ) ergs/cm2
Time-resolved spectra
Distribution
T90 vs. Hardness ratio plot
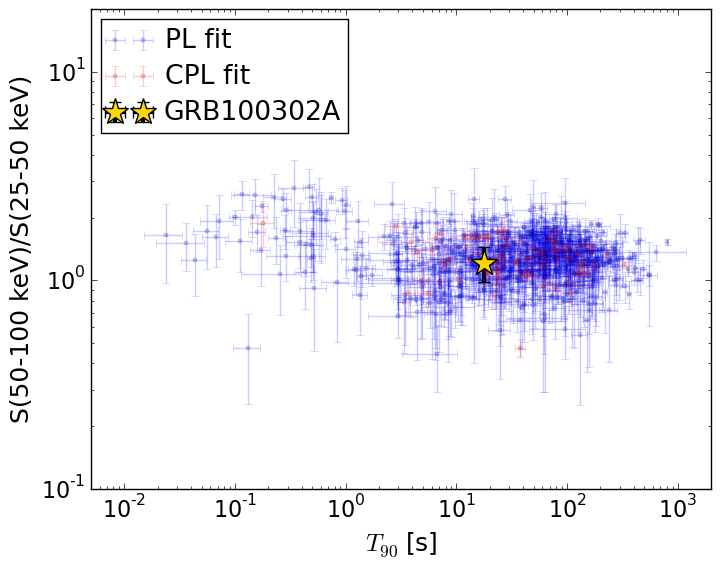
T90                                   = 17.948 sec.
Hardness ratio (energy fluence ratio) = 1.2151780905
S(15-50 keV) vs. S(50-150 keV) plot
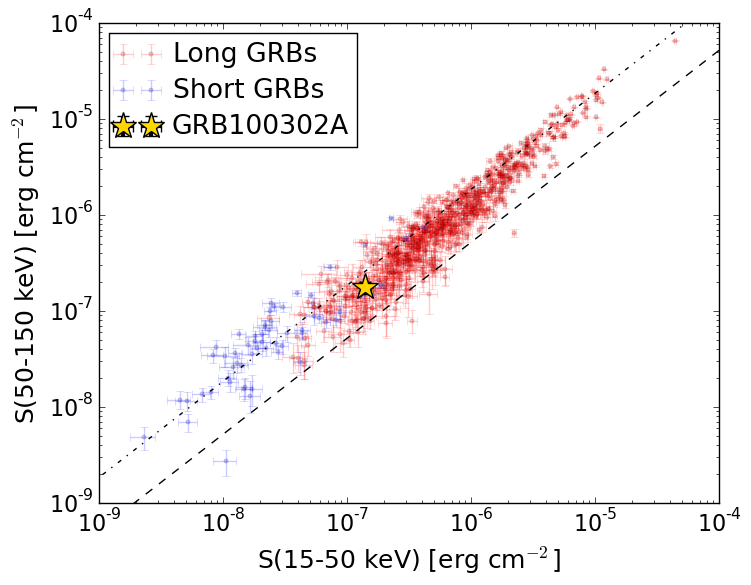
S(15-50 keV)  = 1.3976784e-07
S(50-150 keV) = 1.7613368e-07
The dash-dotted line and the dashed line traces the fluences calculated from the Band function with Epeak = 15 and 150 keV, respectively. Both lines assume a canonical values of alpha = -1 and beta = -2.5.
Mask shadow pattern
IMX = 1.806734798416724E-01, IMY = 1.680524423873691E-01
Spacecraft aspect plot
Bright source in the pre-burst/pre-slew/post-slew images
Pre-burst image of 15-350 keV band
Time interval of the image:
-239.000000 47.644000

# RAcent  DECcent POSerr Theta    Phi  PeakCts   SNR AngSep     Name
#  [deg]    [deg]    ['] [deg]  [deg]                   [']
296.8180  62.8617    4.2  47.1  -53.2   2.6049   2.8 ------	UNKNOWN
 10.6756  72.1211    3.2  40.8  -92.5   3.7693   3.7 ------	UNKNOWN
Pre-slew background subtracted image of 15-350 keV band
Time interval of the image:
47.644000 67.292000

# RAcent  DECcent POSerr Theta    Phi  PeakCts   SNR AngSep     Name
#  [deg]    [deg]    ['] [deg]  [deg]                   [']
153.0105  34.8637    2.4  31.4  115.6   0.3443   4.9 ------	UNKNOWN
175.5694  46.8444    2.7  20.1   74.0   0.2082   4.3 ------	UNKNOWN
195.4753  74.5693    0.7  13.9  -42.9   0.5708  15.6 ------	UNKNOWN
 96.0009  52.5609    2.2  34.7 -159.0   0.2472   5.2 ------	UNKNOWN
 16.5735  71.4250    2.4  40.9  -95.5   0.8070   4.8 ------	UNKNOWN
Post-slew image of 15-350 keV band
Time interval of the image:
113.900600 963.090000

# RAcent  DECcent POSerr Theta    Phi  PeakCts   SNR AngSep     Name
#  [deg]    [deg]    ['] [deg]  [deg]                   [']
254.3255  35.2542    5.0  48.1  -13.9   1.6396   2.3    8.4	Her X-1
 90.1784  41.2650    3.2  54.3  173.1   6.0410   3.7 ------	UNKNOWN
 99.3308  63.0376    2.9  32.2  178.5   1.7567   3.9 ------	UNKNOWN
 75.1602  41.7605    4.8  57.2 -173.8   5.0668   2.4 ------	UNKNOWN
324.7373  76.3651    3.7  26.2  -99.3   1.5143   3.2 ------	UNKNOWN
 62.6971  41.8989    3.5  59.4 -163.2  12.5554   3.3 ------	UNKNOWN
338.8454  62.2142    4.2  41.2  -98.7   7.2904   2.8 ------	UNKNOWN