Analysis Summary
Notes:
- 1) No attempt has been made to eliminate the non-significant decimal places.
- 2) This batgrbproduct analysis is done using the HEASARC data.
- 3) This batgrbproduct analysis is using the flight position for the mask-weighting calculation.
======================================================================
BAT GRB EVENT DATA PROCESSING REPORT
Process Script Ver: batgrbproduct v2.46
Process Start Time: Thu Jun 18 20:34:06 EDT 2015
Host Name: bat1
Current Working Dir: /local/data/bat1/alien/Swift_3rdBATcatalog/event/batevent_reproc/trigger414905
======================================================================
Trigger: 00414905 Segment: 000
BAT Trigger Time: 289472744 [s; MET]
Trigger Stop: 289472808 [s; MET]
UTC: 2010-03-05T09:05:38.414420 [includes UTCF correction]
Where From?: TDRSS position message
BAT
RA: 168.365441485924 Dec: 42.3762936166821 [deg; J2000]
Catalogged Source?: NO
Point Source?: YES
GRB Indicated?: YES [ by BAT flight software ]
Image S/N Ratio: 8.24
Image Trigger?: YES
Rate S/N Ratio: 0 [ if not an image trigger ]
Image S/N Ratio: 8.24
Analysis Position: [ source = BAT ]
RA: 168.365441485924 Dec: 42.3762936166821 [deg; J2000]
Refined Position: [ source = BAT pre-slew burst ]
RA: 168.373879542398 Dec: 42.3795782774473 [deg; J2000]
{ 11h 13m 29.7s , +42d 22' 46.5" }
+/- 1.86225730687667 [arcmin] (estimated 90% radius based on SNR)
+/- 0.946470654814645 [arcmin] (formal 1-sigma fit error)
SNR: 12.5125953104799
Angular difference between the analysis and refined position is 0.422748 arcmin
Partial Coding Fraction: 0.2265625 [ including projection effects ]
Duration
T90: 75.6159999966621 +/- 10.4010584354437
Measured from: -0.695999979972839
to: 74.9200000166893 [s; relative to TRIGTIME]
T50: 43.3280000090599 +/- 9.49842935155917
Measured from: 20.8880000114441
to: 64.216000020504 [s; relative to TRIGTIME]
Fluence
Peak Flux (peak 1 second)
Measured from: 62.716000020504
to: 63.716000020504 [s; relative to TRIGTIME]
Total Fluence
Measured from: -9.17599999904633
to: 78.1840000152588 [s; relative to TRIGTIME]
Band 1 Band 2 Band 3 Band 4
15-25 25-50 50-100 100-350 keV
Total 0.653969 0.760085 0.758454 0.275019
0.092035 0.097239 0.087550 0.078596 [error]
Peak 0.035524 0.035760 0.028434 0.026608
0.010293 0.011067 0.010029 0.008723 [error]
[ fluence units of on-axis counts / fully illuminated detector ]
======================================================================
====== Table of the duration information =============================
Value tstart tstop
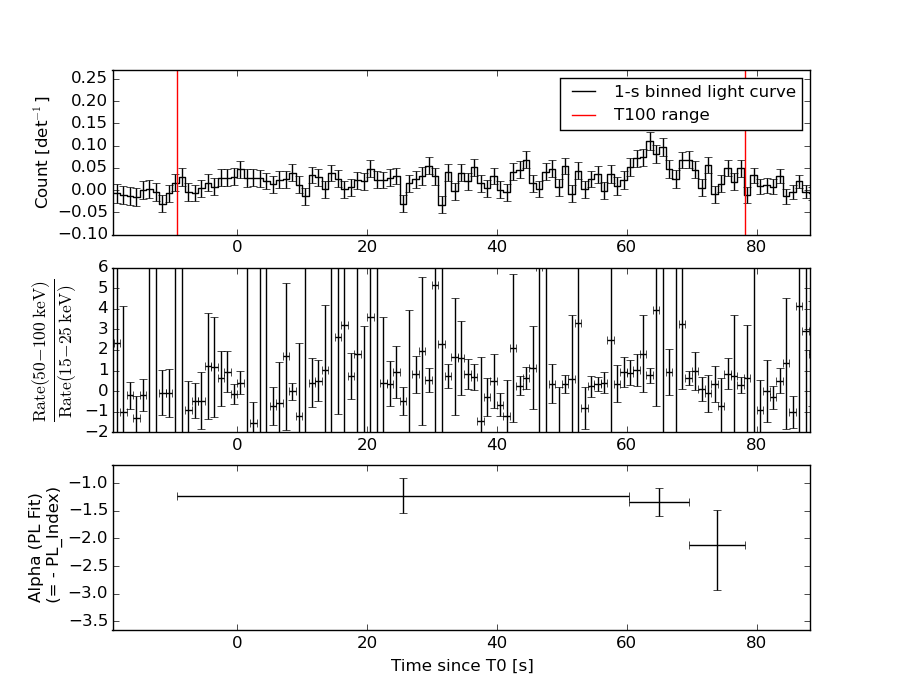
T100 87.360 -9.176 78.184
T90 75.616 -0.696 74.920
T50 43.328 20.888 64.216
Peak 1.000 62.716 63.716
====== Spectral Analysis Summary =====================================
Model : spectral model: simple power-law (PL) and cutoff power-law (CPL)
Ph_index : photon index: E^{Ph_index}
Ph_90err : 90% error of the photon index
Epeak : Epeak in keV
Epeak_90err: 90% error of Epeak
Norm : normalization at 50 keV in both the PL model and CPL model
Nomr_90err : 90% error of the normalization
chi2 : Chi-Squared
dof : degree of freedo
=== Time-averaged spectral analysis ===
(Best model with acceptable fit: PL)
Model Ph_index Ph_90err_low Ph_90err_hi Epeak Epeak_90err_low Epeak_90err_hi Norm Nomr_90err_low Norm_90err_hi chi2 dof
PL -1.349 -0.219 0.220 - - - 1.85e-03 -2.20e-04 2.20e-04 54.030 57
CPL -1.345 -0.221 0.579 9999.330 -9999.330 -9999.330 1.85e-03 -1.85e-03 1.55e-03 54.040 56
=== 1-s peak spectral analysis ===
(Best model with acceptable fit: PL)
Model Ph_index Ph_90err_low Ph_90err_hi Epeak Epeak_90err_low Epeak_90err_hi Norm Nomr_90err_low Norm_90err_hi chi2 dof
PL -1.464 -0.502 0.488 - - - 7.06e-03 -2.18e-03 2.14e-03 57.880 57
CPL -0.159 -1.712 6.019 66.448 -43.992 -66.448 3.47e-02 -3.47e-02 3.97e+01 57.060 56
=== Fluence/Peak Flux Summary ===
Model Band1 Band2 Band3 Band4 Band5 Total
15-25 25-50 50-100 100-350 15-150 15-350 keV
Fluence PL 1.79e-07 3.60e-07 5.66e-07 1.97e-06 1.58e-06 3.07e-06 erg/cm2
90%_error_low -3.90e-08 -4.81e-08 -8.62e-08 -5.94e-07 -2.10e-07 -6.61e-07 erg/cm2
90%_error_hi 4.14e-08 4.72e-08 8.48e-08 7.54e-07 2.11e-07 7.93e-07 erg/cm2
Peak flux PL 2.80e-01 2.88e-01 2.09e-01 2.43e-01 8.73e-01 1.02e+00 ph/cm2/s
90%_error_low -1.27e-01 -9.15e-02 -7.86e-02 -1.42e-01 -2.62e-01 -3.09e-01 ph/cm2/s
90%_error_hi 1.42e-01 8.98e-02 7.74e-02 2.22e-01 2.63e-01 3.15e-01 ph/cm2/s
Fluence CPL 1.82e-07 3.57e-07 5.61e-07 2.11e-06 1.58e-06 2.95e-06 erg/cm2
90%_error_low N/A -5.36e-08 -9.60e-08 -1.25e-06 -2.54e-07 -1.01e-06 erg/cm2
90%_error_hi N/A 6.14e-08 1.07e-07 2.02e-07 2.41e-07 8.80e-07 erg/cm2
Peak flux CPL 2.32e-01 3.32e-01 2.24e-01 6.60e-02 8.38e-01 8.53e-01 ph/cm2/s
90%_error_low -2.32e-01 -1.11e-01 N/A -6.60e-02 -2.86e-01 -3.01e-01 ph/cm2/s
90%_error_hi 1.67e-01 1.42e-01 N/A 2.37e-01 2.73e-01 3.67e-01 ph/cm2/s
======================================================================
Image
Pre-slew 15.0-350.0 keV image (Event data)
#   RAcent    DECcent   POSerr    Theta     Phi              Peak Cts       SNR   Name
  168.3739    42.3796   0.0154    34.4510   103.2848         2.2928482     12.513 TRIG_00414905

Foreground time interval of the image:
 -4.299  71.901 (delta_t =  76.200 [sec])
Background time interval of the image:
Light Curves
Note: The mask-weighted lightcurves have units of either count/det or counts/sec/det, where a det is 0.4 x 0.4 = 0.16 sq cm.
Full-time range; 1 s binning
Other quick-look light curves:
- 64 ms binning (zoomed)
- 16 ms binning (zoomed)
- 8 ms binning (zoomed)
- 2 ms binning (zoomed)
- SN=5 or 10 s binning (full-time range)
- Raw light curve
Spectra
- 64 ms binning (zoomed)
- 16 ms binning (zoomed)
- 8 ms binning (zoomed)
- 2 ms binning (zoomed)
- SN=5 or 10 s binning (full-time range)
- Raw light curve
Spectra
Notes:
- 1) The fitting includes the systematic errors.
- 2) When the burst includes telescope slew time periods, the fitting uses an average response file made from multiple 5-s response files through out the slew time plus single time preiod for the non-slew times, and weighted by the total counts in the corresponding time period using addrmf. An average response file is needed becuase a spectral fit using the pre-slew DRM will introduce some errors in both a spectral shape and a normalization if the PHA file contains a lot of the slew/post-slew time interval.
- 3) For fits to more complicated models (e.g. a power-law over a cutoff power-law), the BAT team has decided to require a chi-square improvement of more than 6 for each extra dof.
Time averaged spectrum fit using the average DRM
Power-law model
Time interval is from   -9.176 sec. to   78.184 sec.

Spectral model in power-law:
------------------------------------------------------------
Parameters  : value       lower 90%   higher 90%
Photon index: -1.34886     ( -0.219353   0.220457 )
Norm@50keV  : 1.84672E-03    ( -0.000220495   0.000220136 )
------------------------------------------------------------
#Fit statistic : Chi-Squared =          54.03 using 59 PHA bins.
# Reduced chi-squared =         0.9478 for     57 degrees of freedom
# Null hypothesis probability =   5.873868e-01

Photon flux (15-150 keV)    in 87.36 sec: 0.222428 ( -0.027291  0.027409 ) ph/cm2/s
Energy fluence (15-150 keV)             : 1.57628e-06 ( -2.09519e-07  2.11288e-07 ) ergs/cm2
Cutoff power-law model

Time interval is from   -9.176 sec. to   78.184 sec.
Spectral model in the cutoff power-law:
------------------------------------------------------------
Parameters  : value       lower 90%   higher 90%
Photon index: -1.34524     ( -0.220759   0.578724 )
Epeak [keV] : 9999.33      ( -9999.36 -9999.36 )
Norm@50keV  : 1.85110E-03    ( -0.00185385   0.00154854 )
------------------------------------------------------------
#Fit statistic : Chi-Squared =          54.04 using 59 PHA bins.
# Reduced chi-squared =         0.9649 for     56 degrees of freedom
# Null hypothesis probability =   5.495823e-01

Photon flux (15-150 keV)    in 87.36 sec: 0.223731 (    ) ph/cm2/s
Energy fluence (15-150 keV)             : 1.58403e-06 ( -2.54393e-07  2.40844e-07 ) ergs/cm2
1-s peak spectrum fit
Power-law model
Time interval is from   62.716 sec. to   63.716 sec.

Spectral model in power-law:
------------------------------------------------------------
Parameters  : value       lower 90%   higher 90%
Photon index: -1.46351     ( -0.501993   0.488261 )
Norm@50keV  : 7.05764E-03    ( -0.0021751   0.00214471 )
------------------------------------------------------------
#Fit statistic : Chi-Squared =          57.88 using 59 PHA bins.
# Reduced chi-squared =          1.015 for     57 degrees of freedom
# Null hypothesis probability =   4.424711e-01

Photon flux (15-150 keV)    in 1 sec: 0.872727 ( -0.2619  0.262513 ) ph/cm2/s
Energy fluence (15-150 keV)             : 6.73798e-08 ( -2.22316e-08  2.28313e-08 ) ergs/cm2
Cutoff power-law model
Time interval is from   62.716 sec. to   63.716 sec.
Spectral model in the cutoff power-law:
------------------------------------------------------------
Parameters  : value       lower 90%   higher 90%
Photon index: -0.158987     ( -1.72438   6.00733 )
Epeak [keV] : 66.4485      ( -43.6614 -66.1177 )
Norm@50keV  : 3.46848E-02    ( -0.0356172   39.7427 )
------------------------------------------------------------
#Fit statistic : Chi-Squared =          57.06 using 59 PHA bins.
# Reduced chi-squared =          1.019 for     56 degrees of freedom
# Null hypothesis probability =   4.355485e-01

Photon flux (15-150 keV)    in 1 sec: 0.837724 ( -0.285598  0.273136 ) ph/cm2/s
Energy fluence (15-150 keV)             : 6.07379e-08 ( -2.40519e-08  2.61381e-08 ) ergs/cm2
Time-resolved spectra
Distribution
T90 vs. Hardness ratio plot
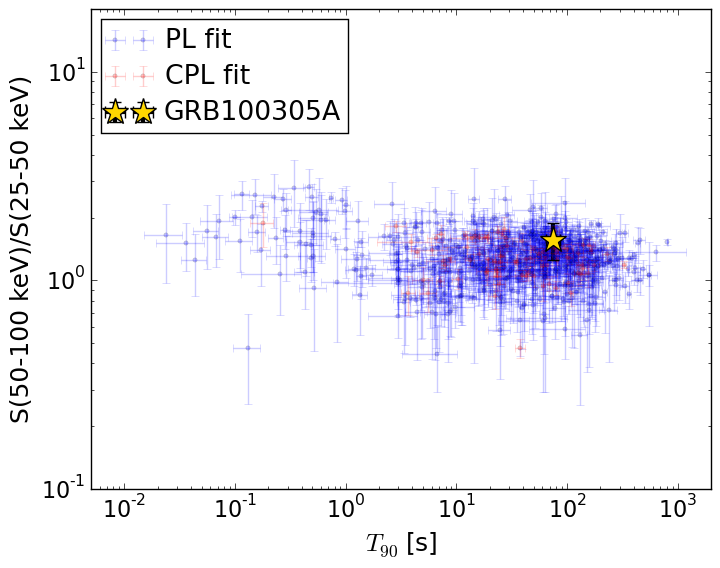
T90                                   = 75.616 sec.
Hardness ratio (energy fluence ratio) = 1.57043493314
S(15-50 keV) vs. S(50-150 keV) plot
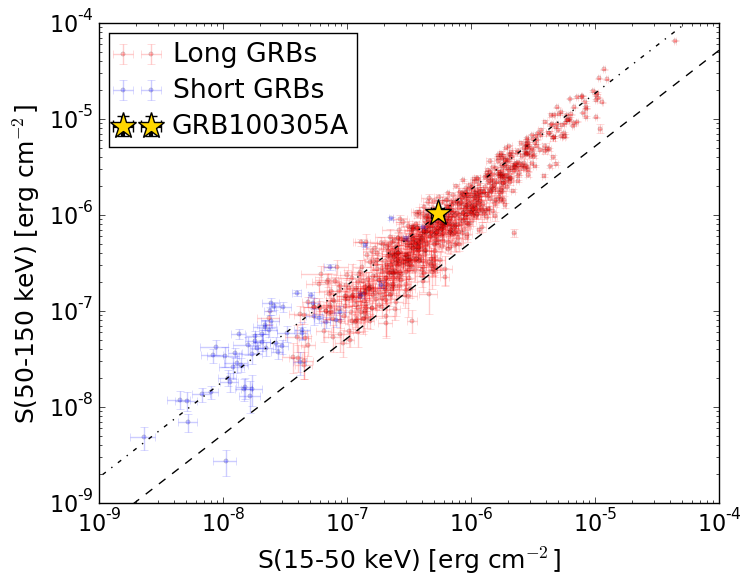
S(15-50 keV)  = 5.392873e-07
S(50-150 keV) = 1.0369687e-06
The dash-dotted line and the dashed line traces the fluences calculated from the Band function with Epeak = 15 and 150 keV, respectively. Both lines assume a canonical values of alpha = -1 and beta = -2.5.
Mask shadow pattern
IMX = -1.576418676268291E-01, IMY = -6.676649840209761E-01
Spacecraft aspect plot
Bright source in the pre-burst/pre-slew/post-slew images
Pre-burst image of 15-350 keV band
Time interval of the image:
Pre-slew background subtracted image of 15-350 keV band
Time interval of the image:
-4.299400 71.900600

# RAcent  DECcent POSerr Theta    Phi  PeakCts   SNR AngSep     Name
#  [deg]    [deg]    ['] [deg]  [deg]                   [']
254.4156  35.4385    6.4  47.8   -3.5   0.3188   1.8    6.1	Her X-1
180.0470  35.6568    2.4  39.6   86.6   1.6610   4.8 ------	UNKNOWN
168.3738  42.3796    0.9  34.5  103.3   2.2930  12.5 ------	UNKNOWN
245.1637  29.5002    2.3  51.3    8.6   1.2496   5.1 ------	UNKNOWN
151.4617  77.7265    2.8  10.7 -166.0   0.3319   4.1 ------	UNKNOWN
266.8389  33.3700    2.6  53.0  -15.3   0.9293   4.5 ------	UNKNOWN
296.1453  61.0377    3.4  34.9  -57.1   0.4527   3.4 ------	UNKNOWN
Post-slew image of 15-350 keV band
Time interval of the image:
126.100600 267.100590

# RAcent  DECcent POSerr Theta    Phi  PeakCts   SNR AngSep     Name
#  [deg]    [deg]    ['] [deg]  [deg]                   [']
172.4964   9.9516    2.4  32.6   78.5   1.0998   4.9 ------	UNKNOWN
124.8380  26.1046    2.3  39.0  165.6   0.9371   5.0 ------	UNKNOWN
105.8305  24.1061    3.0  54.1  177.3   1.6158   3.8 ------	UNKNOWN