Analysis Summary
Notes:
- 1) No attempt has been made to eliminate the non-significant decimal places.
- 2) This batgrbproduct analysis is done using the HEASARC data.
- 3) This batgrbproduct analysis is using the flight position for the mask-weighting calculation.
======================================================================
BAT GRB EVENT DATA PROCESSING REPORT
Process Script Ver: batgrbproduct v2.46
Process Start Time: Fri Jan 17 19:24:45 EST 2014
Host Name: batevent1
Current Working Dir: /local/data/batevent/batevent_reproc/trigger416076
======================================================================
Trigger: 00416076 Segment: 000
BAT Trigger Time: 290398986.048 [s; MET]
Trigger Stop: 290398988.096 [s; MET]
UTC: 2010-03-16T02:23:00.430180 [includes UTCF correction]
Where From?: TDRSS position message
BAT
RA: 252.031620948293 Dec: 71.8254875350265 [deg; J2000]
Catalogged Source?: NO
Point Source?: YES
GRB Indicated?: YES [ by BAT flight software ]
Image S/N Ratio: 8.09
Image Trigger?: NO
Rate S/N Ratio: 13.7113092008021 [ if not an image trigger ]
Image S/N Ratio: 8.09
Analysis Position: [ source = BAT ]
RA: 252.031620948293 Dec: 71.8254875350265 [deg; J2000]
Refined Position: [ source = BAT pre-slew burst ]
RA: 251.954967264097 Dec: 71.8182472120343 [deg; J2000]
{ 16h 47m 49.2s , +71d 49' 05.7" }
+/- 1.66405369542645 [arcmin] (estimated 90% radius based on SNR)
+/- 0.735874335362166 [arcmin] (formal 1-sigma fit error)
SNR: 14.6948461306747
Angular difference between the analysis and refined position is 1.499152 arcmin
Partial Coding Fraction: 0.1621094 [ including projection effects ]
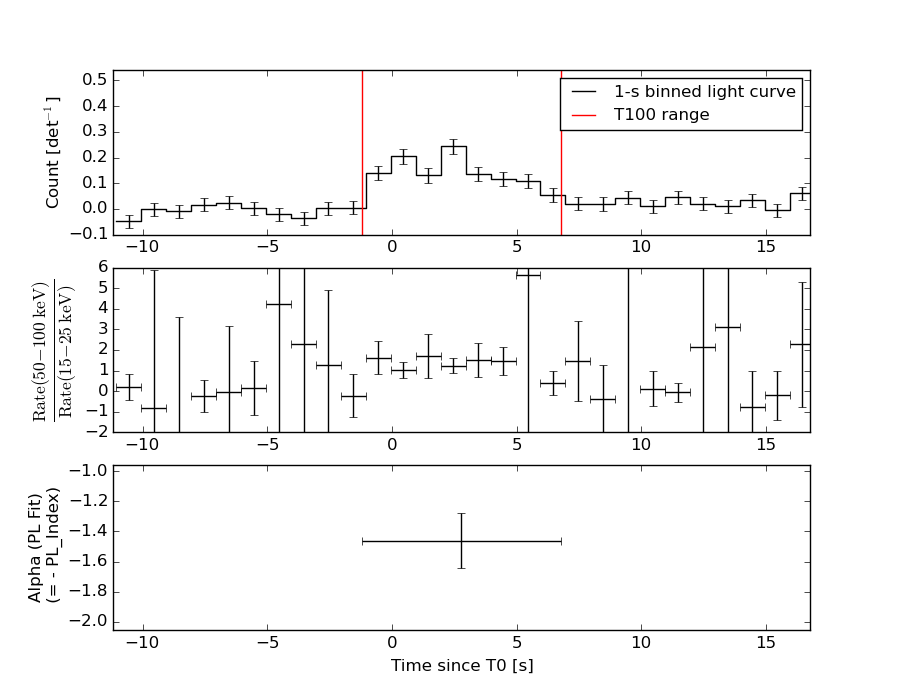
Duration
T90: 6.75200003385544 +/- 0.951865531564711
Measured from: -0.695999979972839
to: 6.0560000538826 [s; relative to TRIGTIME]
T50: 3.45600003004074 +/- 0.845430073540578
Measured from: 0.600000023841858
to: 4.0560000538826 [s; relative to TRIGTIME]
Fluence
Peak Flux (peak 1 second)
Measured from: 1.94800001382828
to: 2.94800001382828 [s; relative to TRIGTIME]
Total Fluence
Measured from: -1.20800000429153
to: 6.7600000500679 [s; relative to TRIGTIME]
Band 1 Band 2 Band 3 Band 4
15-25 25-50 50-100 100-350 keV
Total 0.294856 0.399444 0.405071 0.082008
0.041435 0.044327 0.038530 0.031579 [error]
Peak 0.069012 0.086164 0.081433 0.004933
0.015376 0.015731 0.014633 0.011339 [error]
[ fluence units of on-axis counts / fully illuminated detector ]
======================================================================
====== Table of the duration information =============================
Value tstart tstop
T100 7.968 -1.208 6.760
T90 6.752 -0.696 6.056
T50 3.456 0.600 4.056
Peak 1.000 1.948 2.948
====== Spectral Analysis Summary =====================================
Model : spectral model: simple power-law (PL) and cutoff power-law (CPL)
Ph_index : photon index: E^{Ph_index}
Ph_90err : 90% error of the photon index
Epeak : Epeak in keV
Epeak_90err: 90% error of Epeak
Norm : normalization at 50 keV in both the PL model and CPL model
Nomr_90err : 90% error of the normalization
chi2 : Chi-Squared
dof : degree of freedo
=== Time-averaged spectral analysis ===
(Best model with acceptable fit: PL)
Model Ph_index Ph_90err_low Ph_90err_hi Epeak Epeak_90err_low Epeak_90err_hi Norm Nomr_90err_low Norm_90err_hi chi2 dof
PL -1.462 -0.183 0.182 - - - 1.08e-02 -1.14e-03 1.14e-03 52.510 57
CPL -1.112 -0.499 0.822 139.396 -67.906 -139.396 1.58e-02 N/A N/A 51.820 56
=== 1-s peak spectral analysis ===
(Best model with acceptable fit: PL)
Model Ph_index Ph_90err_low Ph_90err_hi Epeak Epeak_90err_low Epeak_90err_hi Norm Nomr_90err_low Norm_90err_hi chi2 dof
PL -1.459 -0.299 0.299 - - - 1.83e-02 -3.21e-03 3.21e-03 53.640 57
CPL -1.100 -1.389 1.414 134.089 -134.089 -134.089 2.72e-02 -1.19e-02 9.55e-02 53.360 56
=== Fluence/Peak Flux Summary ===
Model Band1 Band2 Band3 Band4 Band5 Total
15-25 25-50 50-100 100-350 15-150 15-350 keV
Fluence PL 1.06e-07 2.00e-07 2.90e-07 8.96e-07 8.22e-07 1.49e-06 erg/cm2
90%_error_low -1.98e-08 -2.33e-08 -3.78e-08 -2.30e-07 -9.27e-08 -2.60e-07 erg/cm2
90%_error_hi 2.09e-08 2.31e-08 3.73e-08 2.76e-07 9.31e-08 2.96e-07 erg/cm2
Peak flux PL 7.24e-01 7.46e-01 5.43e-01 6.34e-01 2.26e+00 2.65e+00 ph/cm2/s
90%_error_low -2.19e-01 -1.49e-01 -1.14e-01 -2.36e-01 -4.16e-01 -4.65e-01 ph/cm2/s
90%_error_hi 2.41e-01 1.46e-01 1.12e-01 3.06e-01 4.18e-01 4.66e-01 ph/cm2/s
Fluence CPL 9.83e-08 2.05e-07 3.01e-07 5.76e-07 8.10e-07 1.18e-06 erg/cm2
90%_error_low -2.53e-08 -2.61e-08 -4.35e-08 -3.21e-07 -9.69e-08 -3.34e-07 erg/cm2
90%_error_hi 2.58e-08 2.69e-08 4.49e-08 5.44e-07 9.65e-08 4.19e-07 erg/cm2
Peak flux CPL 6.71e-01 7.69e-01 5.66e-01 4.42e-01 2.23e+00 2.45e+00 ph/cm2/s
90%_error_low -2.71e-01 -1.64e-01 -1.30e-01 -4.42e-01 -4.29e-01 -5.63e-01 ph/cm2/s
90%_error_hi 2.79e-01 1.72e-01 1.39e-01 2.72e-01 4.29e-01 6.24e-01 ph/cm2/s
======================================================================
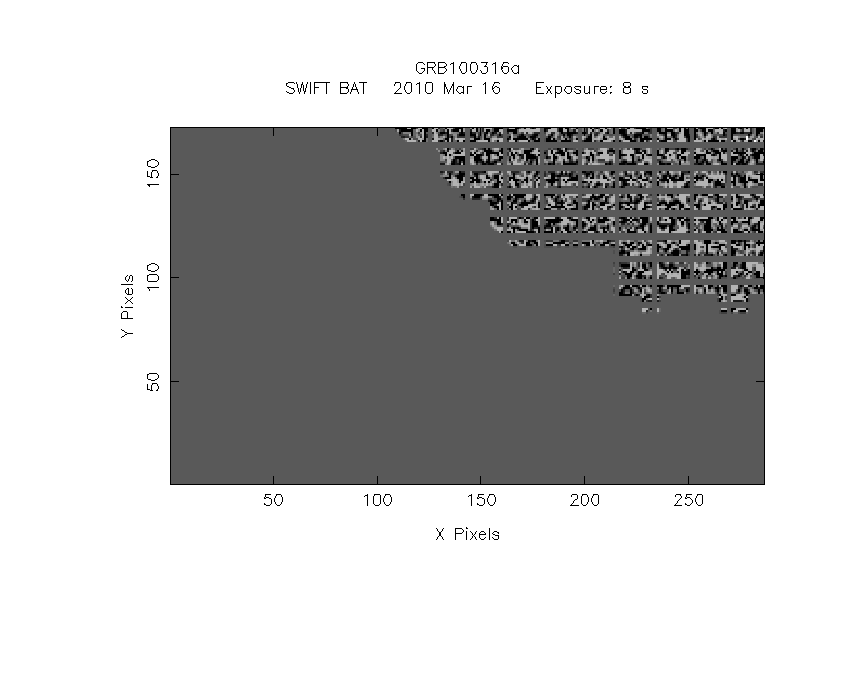
Image
Pre-slew 15.0-350.0 keV image (Event data)
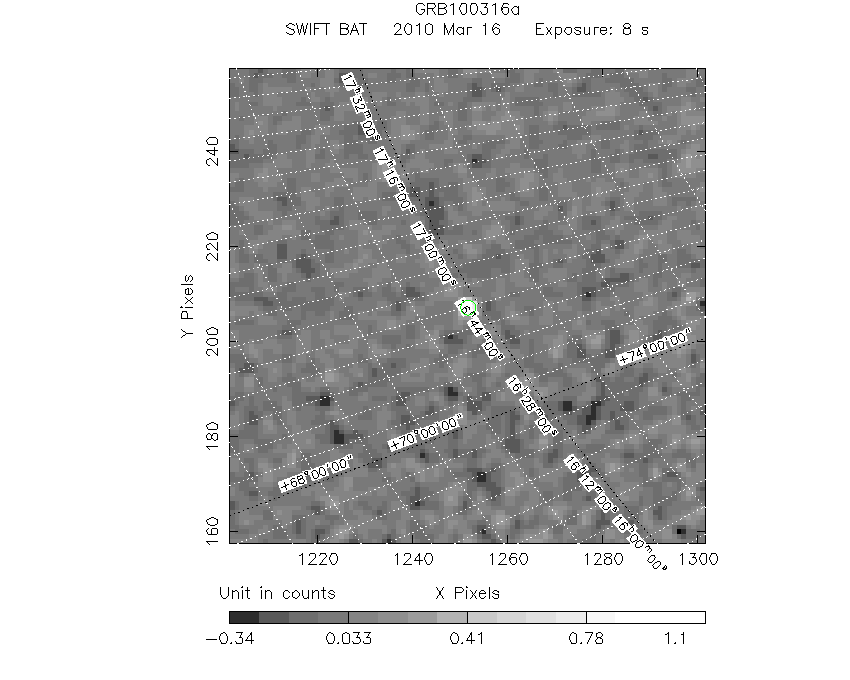
#   RAcent    DECcent   POSerr    Theta     Phi              Peak Cts       SNR   Name
  251.9550    71.8182   0.0130    43.9846   144.0835         1.2491296     14.695 TRIG_00416076

Foreground time interval of the image:
 -1.208   6.760 (delta_t =   7.968 [sec])
Background time interval of the image:
-239.048  -1.208 (delta_t = 237.840 [sec])
Light Curves
Note: The mask-weighted lightcurves have units of either count/det or counts/sec/det, where a det is 0.4 x 0.4 = 0.16 sq cm.
Full-time range; 1 s binning
Other quick-look light curves:
- 64 ms binning (zoomed)
- 16 ms binning (zoomed)
- 8 ms binning (zoomed)
- 2 ms binning (zoomed)
- SN=5 or 10 s binning (full-time range)
- Raw light curve
Spectra
- 64 ms binning (zoomed)
- 16 ms binning (zoomed)
- 8 ms binning (zoomed)
- 2 ms binning (zoomed)
- SN=5 or 10 s binning (full-time range)
- Raw light curve
Spectra
Notes:
- 1) The fitting includes the systematic errors.
- 2) When the burst includes telescope slew time periods, the fitting uses an average response file made from multiple 5-s response files through out the slew time plus single time preiod for the non-slew times, and weighted by the total counts in the corresponding time period using addrmf. An average response file is needed becuase a spectral fit using the pre-slew DRM will introduce some errors in both a spectral shape and a normalization if the PHA file contains a lot of the slew/post-slew time interval.
- 3) For fits to more complicated models (e.g. a power-law over a cutoff power-law), the BAT team has decided to require a chi-square improvement of more than 6 for each extra dof.
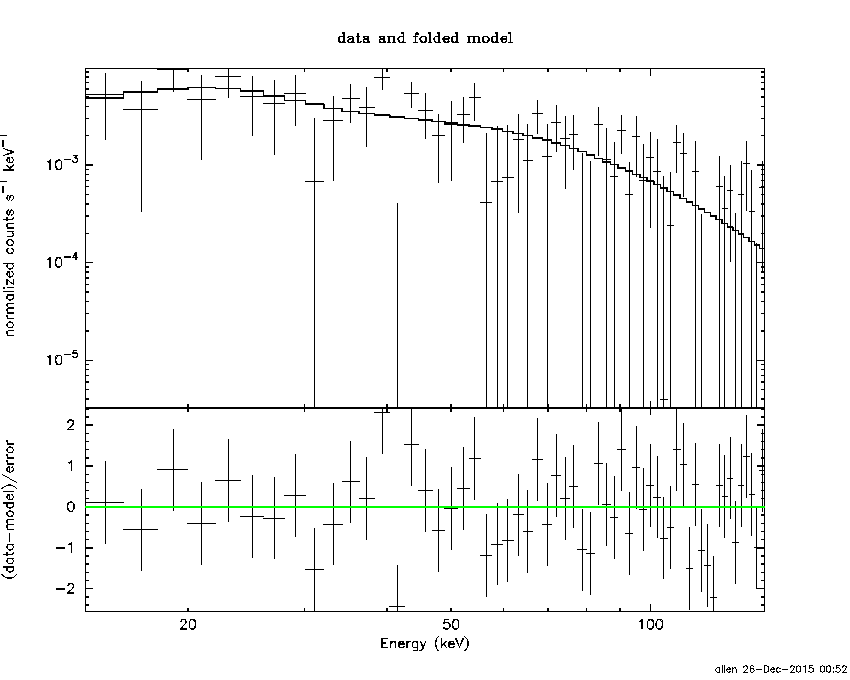
Time averaged spectrum fit using the average DRM
Power-law model
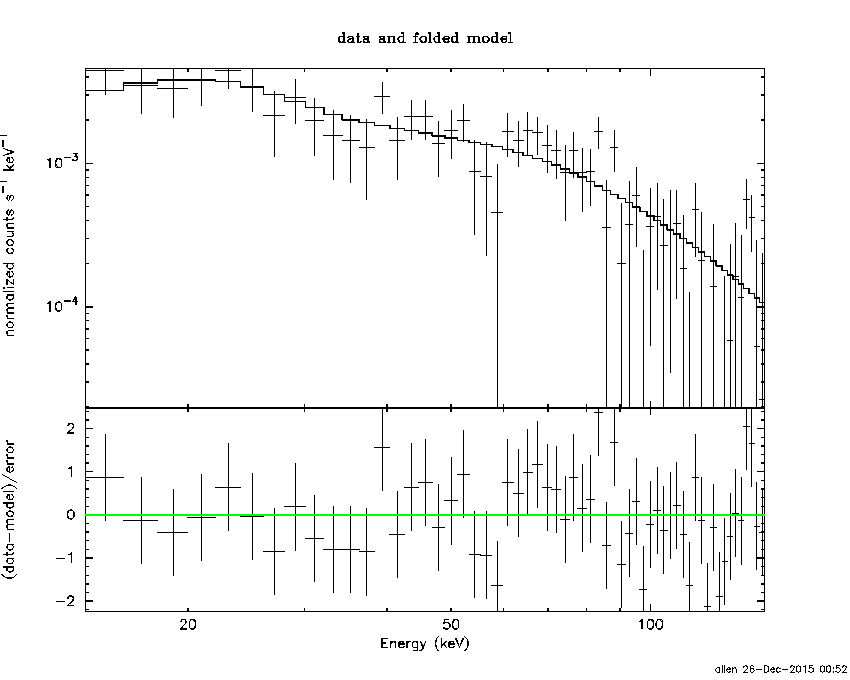
Time interval is from   -1.208 sec. to    6.760 sec.

Spectral model in power-law:
------------------------------------------------------------
Parameters  : value       lower 90%   higher 90%
Photon index: -1.46189     ( -0.182666   0.182066 )
Norm@50keV  : 1.08085E-02    ( -0.00114072   0.00113872 )
------------------------------------------------------------
#Fit statistic : Chi-Squared =          52.51 using 59 PHA bins.
# Reduced chi-squared =         0.9211 for     57 degrees of freedom
# Null hypothesis probability =   6.441854e-01

Photon flux (15-150 keV)    in 7.968 sec: 1.33600 ( -0.14827  0.14882 ) ph/cm2/s
Energy fluence (15-150 keV)             : 8.22449e-07 ( -9.26902e-08  9.30742e-08 ) ergs/cm2
Cutoff power-law model
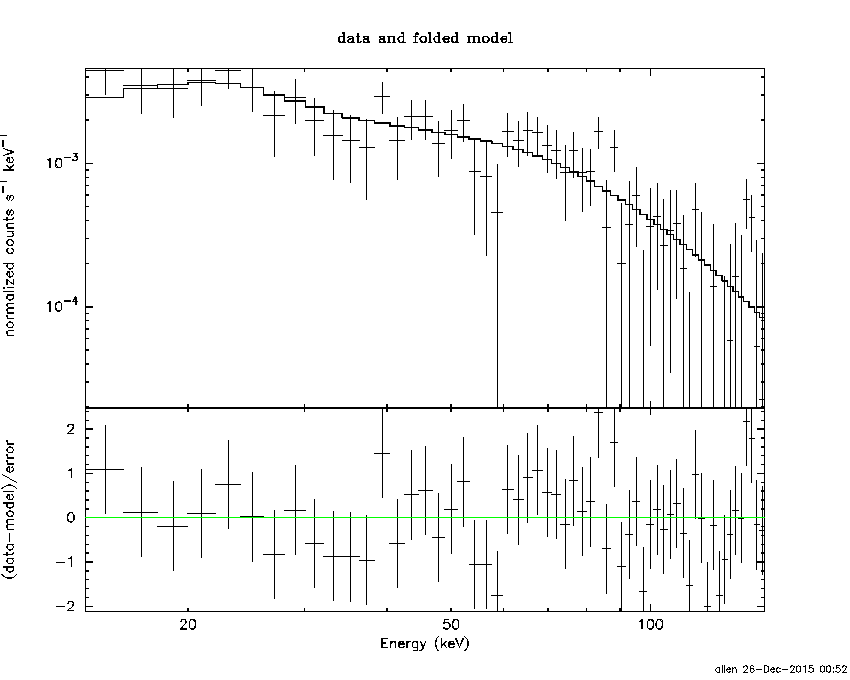
Time interval is from   -1.208 sec. to    6.760 sec.
Spectral model in the cutoff power-law:
------------------------------------------------------------
Parameters  : value       lower 90%   higher 90%
Photon index: -1.11156     ( -0.498816   0.822134 )
Epeak [keV] : 139.396      ( -67.9033 -139.393 )
Norm@50keV  : 1.57605E-02    (     )
------------------------------------------------------------
#Fit statistic : Chi-Squared =          51.82 using 59 PHA bins.
# Reduced chi-squared =         0.9253 for     56 degrees of freedom
# Null hypothesis probability =   6.338429e-01

Photon flux (15-150 keV)    in 7.968 sec: 1.31381 ( -0.15599  0.15546 ) ph/cm2/s
Energy fluence (15-150 keV)             : 8.10306e-07 ( -9.68789e-08  9.65315e-08 ) ergs/cm2
1-s peak spectrum fit
Power-law model
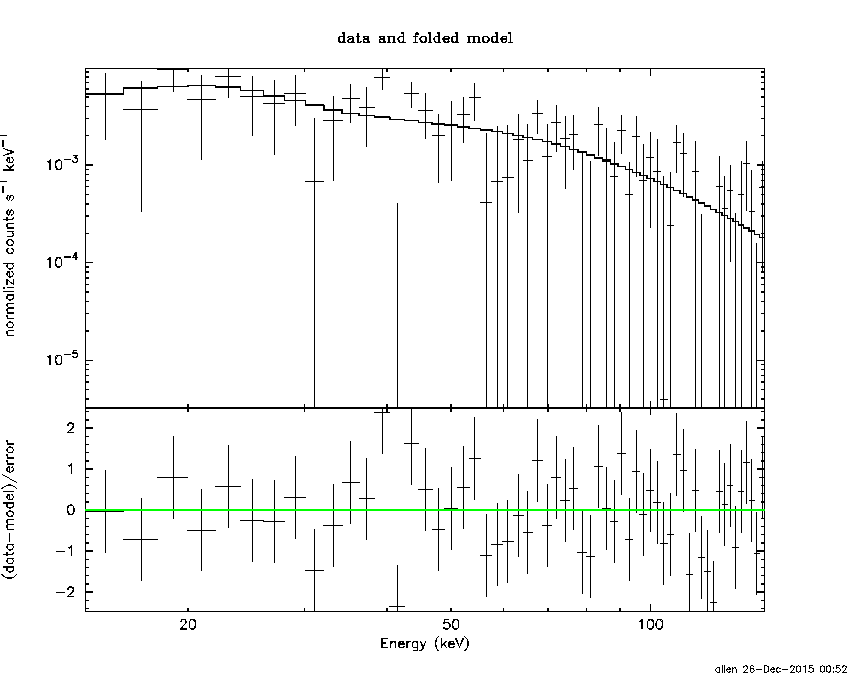
Time interval is from    1.948 sec. to    2.948 sec.

Spectral model in power-law:
------------------------------------------------------------
Parameters  : value       lower 90%   higher 90%
Photon index: -1.45868     ( -0.298903   0.298999 )
Norm@50keV  : 1.82913E-02    ( -0.00321475   0.00321011 )
------------------------------------------------------------
#Fit statistic : Chi-Squared =          53.64 using 59 PHA bins.
# Reduced chi-squared =         0.9411 for     57 degrees of freedom
# Null hypothesis probability =   6.017522e-01

Photon flux (15-150 keV)    in 1 sec: 2.25909 ( -0.41578  0.4179 ) ph/cm2/s
Energy fluence (15-150 keV)             : 1.74779e-07 ( -3.26901e-08  3.28892e-08 ) ergs/cm2
Cutoff power-law model
Time interval is from    1.948 sec. to    2.948 sec.
Spectral model in the cutoff power-law:
------------------------------------------------------------
Parameters  : value       lower 90%   higher 90%
Photon index: -1.09954     ( -1.38869   1.41444 )
Epeak [keV] : 134.089      ( -134.089 -134.089 )
Norm@50keV  : 2.72483E-02    ( -0.0119156   0.0954937 )
------------------------------------------------------------
#Fit statistic : Chi-Squared =          53.36 using 59 PHA bins.
# Reduced chi-squared =         0.9529 for     56 degrees of freedom
# Null hypothesis probability =   5.754241e-01

Photon flux (15-150 keV)    in 1 sec: 2.22783 ( -0.42878  0.42891 ) ph/cm2/s
Energy fluence (15-150 keV)             : 1.71993e-07 ( -3.45065e-08  3.40747e-08 ) ergs/cm2
Time-resolved spectra
Distribution
T90 vs. Hardness ratio plot
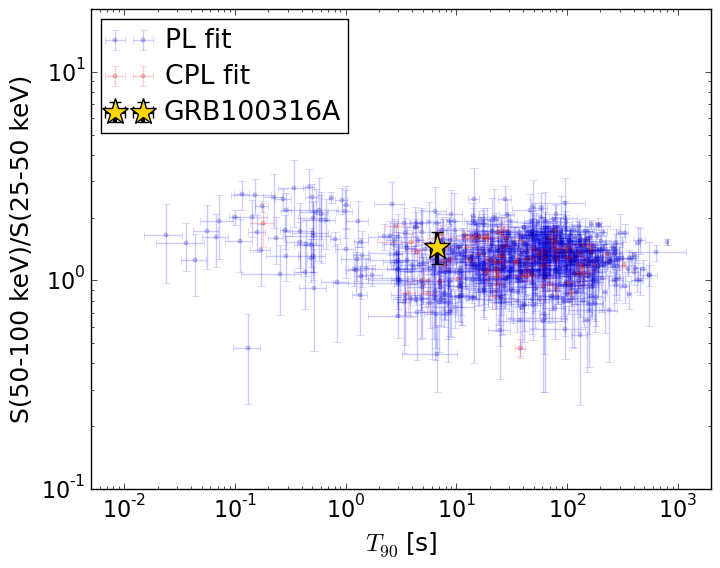
T90                                   = 6.752 sec.
Hardness ratio (energy fluence ratio) = 1.45211134577
S(15-50 keV) vs. S(50-150 keV) plot
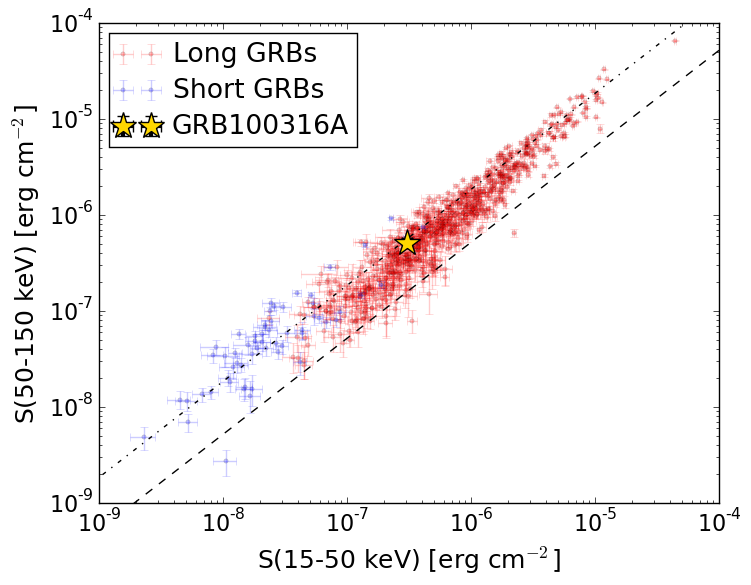
S(15-50 keV)  = 3.056872e-07
S(50-150 keV) = 5.167621e-07
The dash-dotted line and the dashed line traces the fluences calculated from the Band function with Epeak = 15 and 150 keV, respectively. Both lines assume a canonical values of alpha = -1 and beta = -2.5.
Mask shadow pattern
IMX = -7.816647915960692E-01, IMY = -5.661738871788703E-01
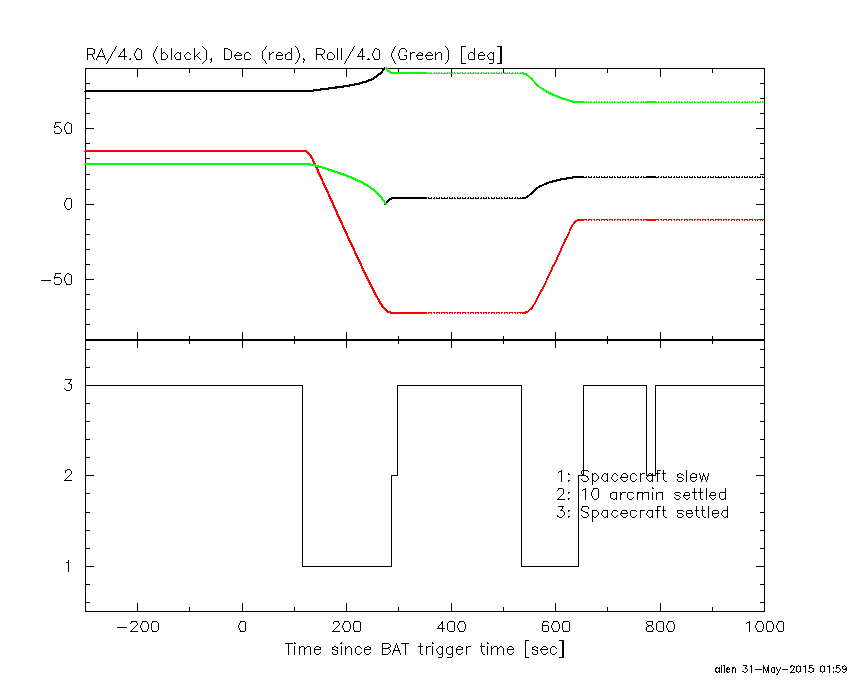
Spacecraft aspect plot
Bright source in the pre-burst/pre-slew/post-slew images
Pre-burst image of 15-350 keV band
Time interval of the image:
-239.048000 -1.208000

# RAcent  DECcent POSerr Theta    Phi  PeakCts   SNR AngSep     Name
#  [deg]    [deg]    ['] [deg]  [deg]                   [']
254.4224  35.2152   12.7  36.6   87.0   0.4803   0.9    7.8	Her X-1
268.4815  -1.4159   11.1  46.8   28.6  -0.5508  -1.0    7.2	SW J1753.5-0127
274.0953 -14.1817   12.7  55.0   14.1  -0.9538  -0.9   10.2	GX 17+2
288.7958  10.9715    0.7  26.1    8.1   3.3169  17.4    1.6	GRS 1915+105
299.5863  35.1997    0.2   0.0   28.7   9.3805  50.0    0.2	Cyg X-1
308.0904  40.9425    1.1   8.8 -149.7   1.8814  10.5    1.1	Cyg X-3
325.9235  38.2820    0.0  21.2 -122.6   0.2614   1.3   11.9	Cyg X-2
254.5614  54.0626    2.4  36.3  119.0   1.8671   4.7 ------	UNKNOWN
Pre-slew background subtracted image of 15-350 keV band
Time interval of the image:
-1.208000 6.760000

# RAcent  DECcent POSerr Theta    Phi  PeakCts   SNR AngSep     Name
#  [deg]    [deg]    ['] [deg]  [deg]                   [']
254.3721  35.2082    8.6  36.6   87.0  -0.1169  -1.3    9.1	Her X-1
268.2570  -1.5295    3.5  47.0   28.8   0.2947   3.3    8.1	SW J1753.5-0127
273.9134 -13.9748 1247.4  54.9   14.4  -0.0013  -0.0    6.5	GX 17+2
288.7446  10.9899    5.0  26.1    8.3  -0.0718  -2.3    4.1	GRS 1915+105
299.5161  35.0841    7.4   0.1   11.2  -0.0422  -1.5    7.9	Cyg X-1
308.2579  40.9898    6.8   8.9 -149.4  -0.0447  -1.7    7.0	Cyg X-3
326.3258  38.4117    6.6  21.6 -123.0  -0.0554  -1.7    9.0	Cyg X-2
251.9544  71.8183    0.8  44.0  144.1   1.2476  14.7 ------	UNKNOWN
Post-slew image of 15-350 keV band
Time interval of the image:
286.652590 534.152610

# RAcent  DECcent POSerr Theta    Phi  PeakCts   SNR AngSep     Name
#  [deg]    [deg]    ['] [deg]  [deg]                   [']
 45.7745 -39.6117    2.4  35.6  -35.5   1.1747   4.7 ------	UNKNOWN
303.3331 -27.4499    3.7  58.7 -159.2   4.3998   3.2 ------	UNKNOWN