Analysis Summary
Notes:
- 1) No attempt has been made to eliminate the non-significant decimal places.
- 2) This batgrbproduct analysis is done using the HEASARC data.
- 3) This batgrbproduct analysis is using the flight position for the mask-weighting calculation.
======================================================================
BAT GRB EVENT DATA PROCESSING REPORT
Process Script Ver: batgrbproduct v2.46
Process Start Time: Fri Jan 17 19:21:12 EST 2014
Host Name: batevent1
Current Working Dir: /local/data/batevent/batevent_reproc/trigger416103
======================================================================
Trigger: 00416103 Segment: 000
BAT Trigger Time: 290419302.592 [s; MET]
Trigger Stop: 290419303.104 [s; MET]
UTC: 2010-03-16T08:01:36.973480 [includes UTCF correction]
Where From?: TDRSS position message
BAT
RA: 163.498053786508 Dec: -45.4800063072237 [deg; J2000]
Catalogged Source?: NO
Point Source?: YES
GRB Indicated?: YES [ by BAT flight software ]
Image S/N Ratio: 9.1
Image Trigger?: NO
Rate S/N Ratio: 15.4272486205415 [ if not an image trigger ]
Image S/N Ratio: 9.1
Analysis Position: [ source = BAT ]
RA: 163.498053786508 Dec: -45.4800063072237 [deg; J2000]
Refined Position: [ source = BAT pre-slew burst ]
RA: 163.500282431312 Dec: -45.4619020752741 [deg; J2000]
{ 10h 54m 00.1s , -45d 27' 42.8" }
+/- 1.37614186376872 [arcmin] (estimated 90% radius based on SNR)
+/- 0.646877845852614 [arcmin] (formal 1-sigma fit error)
SNR: 19.2764956479929
Angular difference between the analysis and refined position is 1.090294 arcmin
Partial Coding Fraction: 0.8359375 [ including projection effects ]
Duration
T90: 3.83599996566772 +/- 0.425807452076879
Measured from: -0.10400003194809
to: 3.73199993371964 [s; relative to TRIGTIME]
T50: 2.27199995517731 +/- 0.342344884065314
Measured from: 0.363999962806702
to: 2.63599991798401 [s; relative to TRIGTIME]
Fluence
Peak Flux (peak 1 second)
Measured from: -0.107999980449677
to: 0.892000019550323 [s; relative to TRIGTIME]
Total Fluence
Measured from: -0.283999979496002
to: 4.11199998855591 [s; relative to TRIGTIME]
Band 1 Band 2 Band 3 Band 4
15-25 25-50 50-100 100-350 keV
Total 0.173690 0.166296 0.067191 0.009419
0.012627 0.012446 0.010372 0.008666 [error]
Peak 0.062221 0.061344 0.030139 0.006894
0.006378 0.006277 0.005182 0.004263 [error]
[ fluence units of on-axis counts / fully illuminated detector ]
======================================================================
====== Table of the duration information =============================
Value tstart tstop
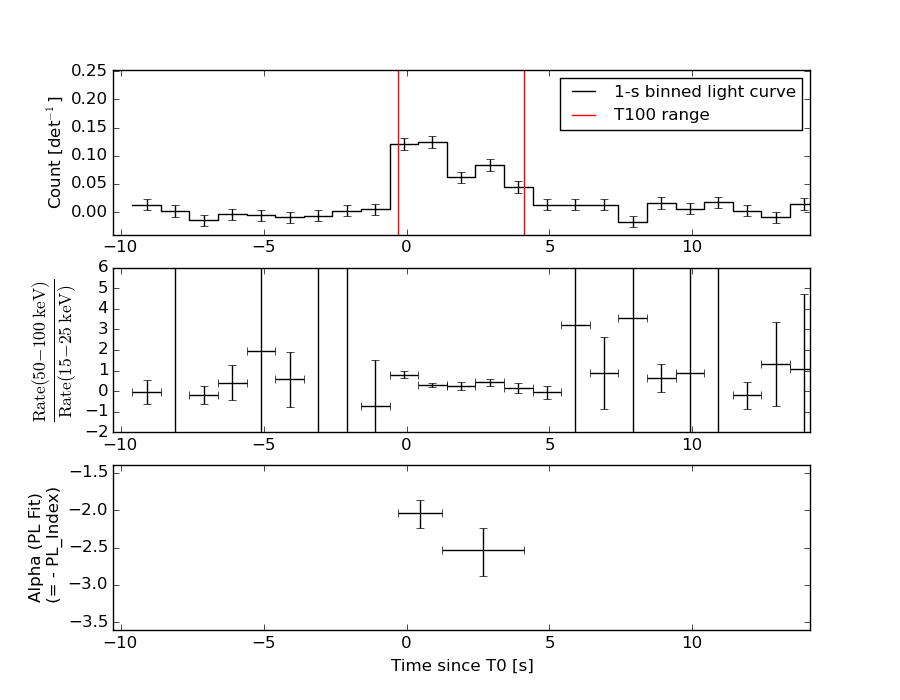
T100 4.396 -0.284 4.112
T90 3.836 -0.104 3.732
T50 2.272 0.364 2.636
Peak 1.000 -0.108 0.892
====== Spectral Analysis Summary =====================================
Model : spectral model: simple power-law (PL) and cutoff power-law (CPL)
Ph_index : photon index: E^{Ph_index}
Ph_90err : 90% error of the photon index
Epeak : Epeak in keV
Epeak_90err: 90% error of Epeak
Norm : normalization at 50 keV in both the PL model and CPL model
Nomr_90err : 90% error of the normalization
chi2 : Chi-Squared
dof : degree of freedo
=== Time-averaged spectral analysis ===
(Best model with acceptable fit: PL)
Model Ph_index Ph_90err_low Ph_90err_hi Epeak Epeak_90err_low Epeak_90err_hi Norm Nomr_90err_low Norm_90err_hi chi2 dof
PL -2.272 -0.190 0.179 - - - 4.75e-03 -6.11e-04 6.01e-04 41.560 57
CPL -1.798 -0.200 0.914 16.307 N/A N/A 9.20e-03 N/A N/A 40.350 56
=== 1-s peak spectral analysis ===
(Best model with acceptable fit: PL)
Model Ph_index Ph_90err_low Ph_90err_hi Epeak Epeak_90err_low Epeak_90err_hi Norm Nomr_90err_low Norm_90err_hi chi2 dof
PL -2.149 -0.229 0.214 - - - 8.29e-03 -1.30e-03 1.27e-03 57.400 57
CPL -1.477 -0.673 1.017 31.445 N/A N/A 2.07e-02 N/A N/A 55.530 56
=== Fluence/Peak Flux Summary ===
Model Band1 Band2 Band3 Band4 Band5 Total
15-25 25-50 50-100 100-350 15-150 15-350 keV
Fluence PL 5.53e-08 6.38e-08 5.28e-08 7.35e-08 1.98e-07 2.45e-07 erg/cm2
90%_error_low -6.59e-09 -5.88e-09 -9.18e-09 -2.22e-08 -2.09e-08 -3.45e-08 erg/cm2
90%_error_hi 6.71e-09 5.84e-09 9.53e-09 2.81e-08 2.15e-08 3.88e-08 erg/cm2
Peak flux PL 6.39e-01 4.39e-01 1.98e-01 1.24e-01 1.34e+00 1.40e+00 ph/cm2/s
90%_error_low -9.83e-02 -5.05e-02 -4.02e-02 -4.19e-02 -1.51e-01 -1.59e-01 ph/cm2/s
90%_error_hi 1.01e-01 5.04e-02 4.14e-02 5.35e-02 1.51e-01 1.60e-01 ph/cm2/s
Fluence CPL N/A N/A N/A N/A N/A N/A erg/cm2
90%_error_low -6.59e-09 -5.88e-09 -9.18e-09 -2.22e-08 -2.09e-08 -3.45e-08 erg/cm2
90%_error_hi 6.71e-09 5.84e-09 9.53e-09 2.81e-08 2.15e-08 3.88e-08 erg/cm2
Peak flux CPL 6.04e-01 4.74e-01 1.93e-01 5.03e-02 1.31e+00 1.32e+00 ph/cm2/s
90%_error_low -1.11e-01 -6.57e-02 -4.70e-02 -5.03e-02 -1.55e-01 -1.62e-01 ph/cm2/s
90%_error_hi 1.11e-01 6.84e-02 4.55e-02 1.09e-01 1.55e-01 1.76e-01 ph/cm2/s
======================================================================
Image
Pre-slew 15.0-350.0 keV image (Event data)
#   RAcent    DECcent   POSerr    Theta     Phi              Peak Cts       SNR   Name
  163.5003   -45.4619   0.0099    14.4243    83.1554         0.4224468     19.276 TRIG_00416103

Foreground time interval of the image:
 -0.284   4.112 (delta_t =   4.396 [sec])
Background time interval of the image:
-239.592  -0.284 (delta_t = 239.308 [sec])
Light Curves
Note: The mask-weighted lightcurves have units of either count/det or counts/sec/det, where a det is 0.4 x 0.4 = 0.16 sq cm.
Full-time range; 1 s binning
Other quick-look light curves:
- 64 ms binning (zoomed)
- 16 ms binning (zoomed)
- 8 ms binning (zoomed)
- 2 ms binning (zoomed)
- SN=5 or 10 s binning (full-time range)
- Raw light curve
Spectra
- 64 ms binning (zoomed)
- 16 ms binning (zoomed)
- 8 ms binning (zoomed)
- 2 ms binning (zoomed)
- SN=5 or 10 s binning (full-time range)
- Raw light curve
Spectra
Notes:
- 1) The fitting includes the systematic errors.
- 2) When the burst includes telescope slew time periods, the fitting uses an average response file made from multiple 5-s response files through out the slew time plus single time preiod for the non-slew times, and weighted by the total counts in the corresponding time period using addrmf. An average response file is needed becuase a spectral fit using the pre-slew DRM will introduce some errors in both a spectral shape and a normalization if the PHA file contains a lot of the slew/post-slew time interval.
- 3) For fits to more complicated models (e.g. a power-law over a cutoff power-law), the BAT team has decided to require a chi-square improvement of more than 6 for each extra dof.
Time averaged spectrum fit using the average DRM
Power-law model
Time interval is from   -0.284 sec. to    4.112 sec.

Spectral model in power-law:
------------------------------------------------------------
Parameters  : value       lower 90%   higher 90%
Photon index: -2.27155     ( -0.18958   0.17886 )
Norm@50keV  : 4.74712E-03    ( -0.000611198   0.000600598 )
------------------------------------------------------------
#Fit statistic : Chi-Squared =          41.56 using 59 PHA bins.
# Reduced chi-squared =         0.7291 for     57 degrees of freedom
# Null hypothesis probability =   9.380525e-01

Photon flux (15-150 keV)    in 4.396 sec: 0.816764 ( -0.071889  0.071908 ) ph/cm2/s
Energy fluence (15-150 keV)             : 1.98453e-07 ( -2.09451e-08  2.14533e-08 ) ergs/cm2
Cutoff power-law model
Time interval is from   -0.284 sec. to    4.112 sec.
Spectral model in the cutoff power-law:
------------------------------------------------------------
Parameters  : value       lower 90%   higher 90%
Photon index: -1.79845     ( -0.201724   0.912424 )
Epeak [keV] : 16.3072      (   )
Norm@50keV  : 9.20053E-03    (     )
------------------------------------------------------------
#Fit statistic : Chi-Squared =          40.35 using 59 PHA bins.
# Reduced chi-squared =         0.7206 for     56 degrees of freedom
# Null hypothesis probability =   9.429018e-01

Photon flux (15-150 keV)    in 4.396 sec: 0.815617 ( -0.071539  0.073982 ) ph/cm2/s
Energy fluence (15-150 keV)             : 0 ( 0  0 ) ergs/cm2
1-s peak spectrum fit
Power-law model
Time interval is from   -0.108 sec. to    0.892 sec.

Spectral model in power-law:
------------------------------------------------------------
Parameters  : value       lower 90%   higher 90%
Photon index: -2.14877     ( -0.229351   0.213611 )
Norm@50keV  : 8.29201E-03    ( -0.00130349   0.00127251 )
------------------------------------------------------------
#Fit statistic : Chi-Squared =          57.40 using 59 PHA bins.
# Reduced chi-squared =          1.007 for     57 degrees of freedom
# Null hypothesis probability =   4.602142e-01

Photon flux (15-150 keV)    in 1 sec: 1.33697 ( -0.15122  0.15124 ) ph/cm2/s
Energy fluence (15-150 keV)             : 7.74622e-08 ( -1.06047e-08  1.08702e-08 ) ergs/cm2
Cutoff power-law model
Time interval is from   -0.108 sec. to    0.892 sec.
Spectral model in the cutoff power-law:
------------------------------------------------------------
Parameters  : value       lower 90%   higher 90%
Photon index: -1.47744     ( -0.673088   1.01696 )
Epeak [keV] : 31.4446      (   )
Norm@50keV  : 2.06554E-02    (     )
------------------------------------------------------------
#Fit statistic : Chi-Squared =          55.53 using 59 PHA bins.
# Reduced chi-squared =         0.9917 for     56 degrees of freedom
# Null hypothesis probability =   4.924833e-01

Photon flux (15-150 keV)    in 1 sec: 1.30788 ( -0.15491  0.15513 ) ph/cm2/s
Energy fluence (15-150 keV)             : 0 ( 0  0 ) ergs/cm2
Time-resolved spectra
Distribution
T90 vs. Hardness ratio plot
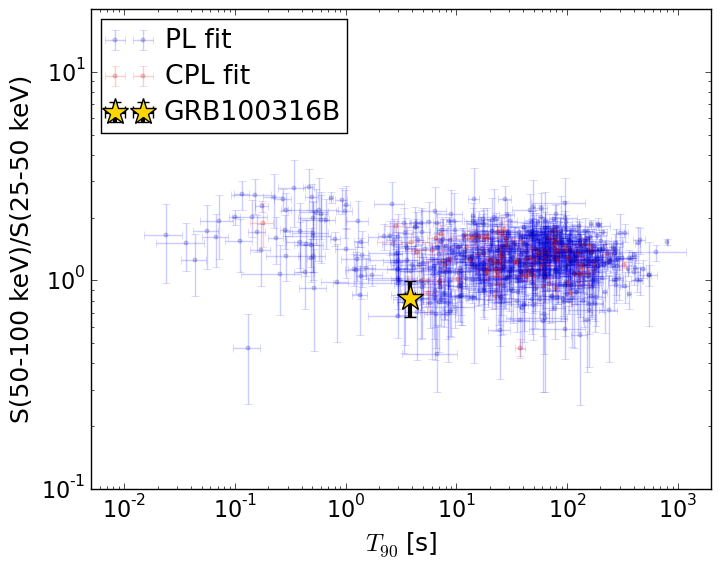
T90                                   = 3.836 sec.
Hardness ratio (energy fluence ratio) = 0.828476664855
S(15-50 keV) vs. S(50-150 keV) plot
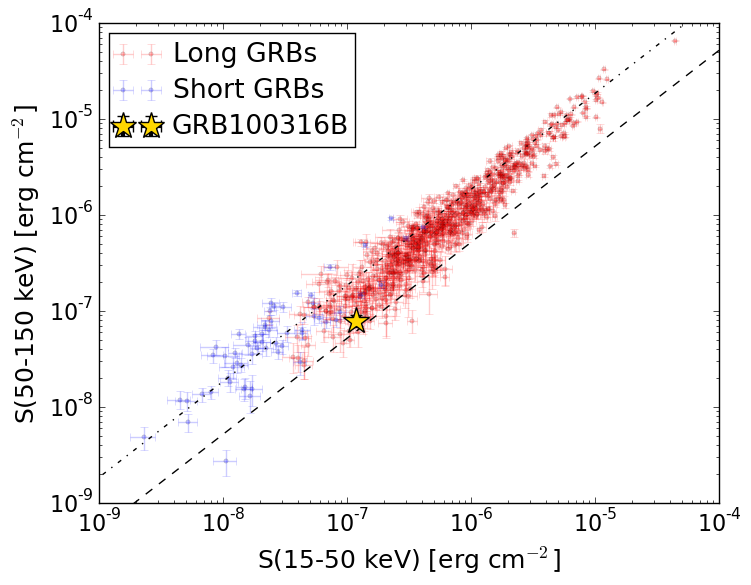
S(15-50 keV)  = 1.1904904e-07
S(50-150 keV) = 7.940562e-08
The dash-dotted line and the dashed line traces the fluences calculated from the Band function with Epeak = 15 and 150 keV, respectively. Both lines assume a canonical values of alpha = -1 and beta = -2.5.
Mask shadow pattern
IMX = 3.065326062637548E-02, IMY = -2.553761083342893E-01
Spacecraft aspect plot
Bright source in the pre-burst/pre-slew/post-slew images
Pre-burst image of 15-350 keV band
Time interval of the image:
-239.592000 -0.284000

# RAcent  DECcent POSerr Theta    Phi  PeakCts   SNR AngSep     Name
#  [deg]    [deg]    ['] [deg]  [deg]                   [']
135.5303 -40.5448    0.4  25.6   27.3   4.9623  25.7    0.6	Vela X-1
169.9938 -60.7647    0.0   3.8 -172.9   0.2377   1.5   12.7	Cen X-3
186.6229 -62.7737    0.5  11.8 -165.1   4.0610  22.3    1.0	GX 301-2
264.7129 -44.3330    5.6  58.1 -155.1   3.0020   2.1    7.1	4U 1735-44
114.7716 -21.3307    2.3  51.0   17.9   2.8542   5.0 ------	UNKNOWN
237.6996 -33.6275    3.1  54.1  177.0   2.2608   3.7 ------	UNKNOWN
255.7179 -48.7995    1.5  50.8 -157.7   3.7419   7.5 ------	UNKNOWN
295.3648 -71.6873    2.6  44.4 -118.8   3.7741   4.5 ------	UNKNOWN
Pre-slew background subtracted image of 15-350 keV band
Time interval of the image:
-0.284000 4.112000

# RAcent  DECcent POSerr Theta    Phi  PeakCts   SNR AngSep     Name
#  [deg]    [deg]    ['] [deg]  [deg]                   [']
135.5107 -40.6540    3.6  25.5   27.2  -0.0789  -3.2    6.0	Vela X-1
169.9938 -60.7647    0.0   3.8 -172.9  -0.0414  -2.1   12.7	Cen X-3
186.9093 -62.5972  125.8  12.0 -166.0   0.0017   0.1   12.5	GX 301-2
264.8621 -44.5968    5.9  57.9 -154.8  -0.2478  -2.0   10.2	4U 1735-44
163.5003 -45.4619    0.6  14.4   83.2   0.4223  19.3 ------	UNKNOWN
Post-slew image of 15-350 keV band
Time interval of the image:
48.308590 962.468000

# RAcent  DECcent POSerr Theta    Phi  PeakCts   SNR AngSep     Name
#  [deg]    [deg]    ['] [deg]  [deg]                   [']
135.5315 -40.5493    0.3  20.9  -12.9  20.0855  39.4    0.4	Vela X-1
170.2958 -60.6269   88.7  15.7 -119.1   0.0683   0.1    0.6	Cen X-3
186.6527 -62.7656    0.3  21.7 -135.7  18.9176  40.8    0.3	GX 301-2
153.8941 -34.0704    2.9  13.6   37.4   1.7937   3.9 ------	UNKNOWN
217.2620 -55.0724    2.7  34.7 -160.8   2.4512   4.3 ------	UNKNOWN
 90.8343 -60.9157    5.4  43.5  -64.2   6.4081   2.1 ------	UNKNOWN
 89.4517 -52.3189    5.1  47.0  -53.1   6.0110   2.3 ------	UNKNOWN
 99.4057 -79.8399    3.3  40.9  -92.6   9.7591   3.5 ------	UNKNOWN