Analysis Summary
Notes:
- 1) No attempt has been made to eliminate the non-significant decimal places.
- 2) This batgrbproduct analysis is done using the HEASARC data.
- 3) This batgrbproduct analysis is using the flight position for the mask-weighting calculation.
======================================================================
BAT GRB EVENT DATA PROCESSING REPORT
Process Script Ver: batgrbproduct v2.46
Process Start Time: Fri Jan 17 19:17:58 EST 2014
Host Name: batevent1
Current Working Dir: /local/data/batevent/batevent_reproc/trigger416115
======================================================================
Trigger: 00416115 Segment: 000
BAT Trigger Time: 290422685.12 [s; MET]
Trigger Stop: 290422689.216 [s; MET]
UTC: 2010-03-16T08:57:59.501360 [includes UTCF correction]
Where From?: TDRSS position message
BAT
RA: 32.2910617778291 Dec: -68.0089406869357 [deg; J2000]
Catalogged Source?: NO
Point Source?: YES
GRB Indicated?: YES [ by BAT flight software ]
Image S/N Ratio: 7.19
Image Trigger?: NO
Rate S/N Ratio: 11.0905365064094 [ if not an image trigger ]
Image S/N Ratio: 7.19
Analysis Position: [ source = BAT ]
RA: 32.2910617778291 Dec: -68.0089406869357 [deg; J2000]
Refined Position: [ source = BAT pre-slew burst ]
RA: 32.3185629591155 Dec: -67.9914067680626 [deg; J2000]
{ 02h 09m 16.5s , -67d 59' 29.1" }
+/- 1.90794256818744 [arcmin] (estimated 90% radius based on SNR)
+/- 0.788423869823904 [arcmin] (formal 1-sigma fit error)
SNR: 12.0867854157895
Angular difference between the analysis and refined position is 1.220186 arcmin
Partial Coding Fraction: 1.015625 [ including projection effects ]
Duration
T90: 9.26799994707108 +/- 1.86981498371424
Measured from: -2.65200001001358
to: 6.6159999370575 [s; relative to TRIGTIME]
T50: 4.0239999294281 +/- 1.38675450094623
Measured from: -0.124000012874603
to: 3.8999999165535 [s; relative to TRIGTIME]
Fluence
Peak Flux (peak 1 second)
Measured from: 2.11599999666214
to: 3.11599999666214 [s; relative to TRIGTIME]
Total Fluence
Measured from: -3.02799999713898
to: 6.90399998426437 [s; relative to TRIGTIME]
Band 1 Band 2 Band 3 Band 4
15-25 25-50 50-100 100-350 keV
Total 0.099771 0.108745 0.092996 0.037993
0.014700 0.015293 0.013558 0.012027 [error]
Peak 0.012639 0.014365 0.019105 0.009937
0.004696 0.005011 0.004272 0.003866 [error]
[ fluence units of on-axis counts / fully illuminated detector ]
======================================================================
====== Table of the duration information =============================
Value tstart tstop
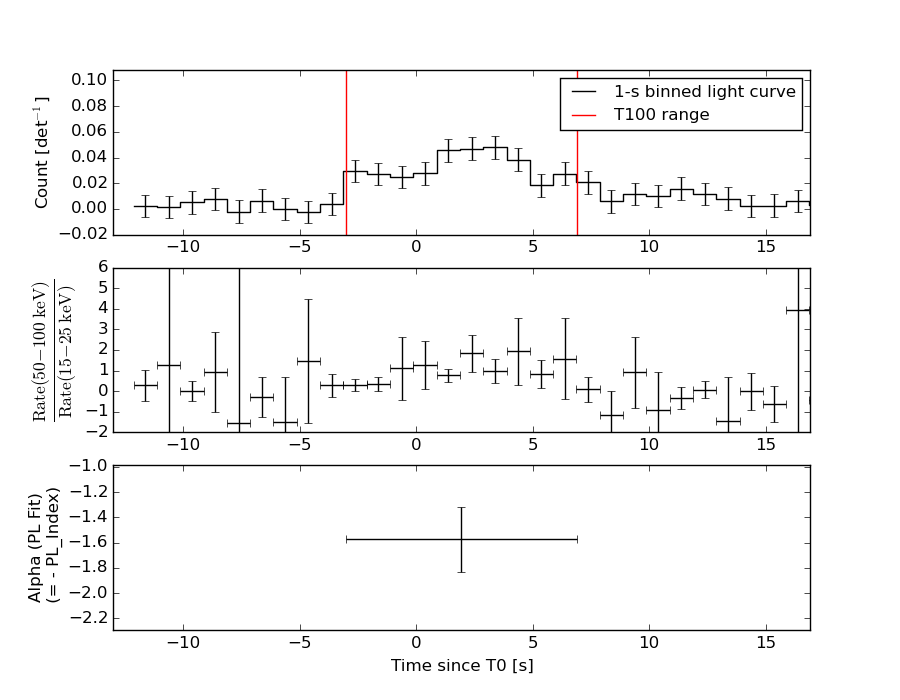
T100 9.932 -3.028 6.904
T90 9.268 -2.652 6.616
T50 4.024 -0.124 3.900
Peak 1.000 2.116 3.116
====== Spectral Analysis Summary =====================================
Model : spectral model: simple power-law (PL) and cutoff power-law (CPL)
Ph_index : photon index: E^{Ph_index}
Ph_90err : 90% error of the photon index
Epeak : Epeak in keV
Epeak_90err: 90% error of Epeak
Norm : normalization at 50 keV in both the PL model and CPL model
Nomr_90err : 90% error of the normalization
chi2 : Chi-Squared
dof : degree of freedo
=== Time-averaged spectral analysis ===
(Best model with acceptable fit: PL)
Model Ph_index Ph_90err_low Ph_90err_hi Epeak Epeak_90err_low Epeak_90err_hi Norm Nomr_90err_low Norm_90err_hi chi2 dof
PL -1.570 -0.263 0.254 - - - 1.95e-03 -3.02e-04 2.95e-04 49.050 57
CPL -1.485 -0.347 0.912 289.876 -289.876 -289.876 2.16e-03 -5.12e-04 4.17e-03 49.090 56
=== 1-s peak spectral analysis ===
(Best model with acceptable fit: PL)
Model Ph_index Ph_90err_low Ph_90err_hi Epeak Epeak_90err_low Epeak_90err_hi Norm Nomr_90err_low Norm_90err_hi chi2 dof
PL -0.979 -0.506 0.563 - - - 3.31e-03 -9.34e-04 9.04e-04 56.820 57
CPL -0.905 0.905 2.224 867.630 N/A N/A 3.57e-03 N/A N/A 56.860 56
=== Fluence/Peak Flux Summary ===
Model Band1 Band2 Band3 Band4 Band5 Total
15-25 25-50 50-100 100-350 15-150 15-350 keV
Fluence PL 2.64e-08 4.65e-08 6.27e-08 1.74e-07 1.82e-07 3.09e-07 erg/cm2
90%_error_low -5.80e-09 -6.54e-09 -1.31e-08 -6.55e-08 -3.05e-08 -7.87e-08 erg/cm2
90%_error_hi 6.07e-09 6.52e-09 1.31e-08 8.83e-08 3.12e-08 9.77e-08 erg/cm2
Peak flux PL 8.29e-02 1.14e-01 1.16e-01 2.13e-01 3.81e-01 5.26e-01 ph/cm2/s
90%_error_low -4.48e-02 -4.25e-02 -3.38e-02 -1.13e-01 -1.07e-01 -1.49e-01 ph/cm2/s
90%_error_hi 5.61e-02 4.03e-02 3.27e-02 1.83e-01 1.08e-01 1.66e-01 ph/cm2/s
Fluence CPL 2.65e-08 4.64e-08 6.27e-08 1.78e-07 1.82e-07 3.07e-07 erg/cm2
90%_error_low -3.84e-09 -6.29e-09 -1.20e-08 -1.39e-07 -3.44e-08 -1.38e-07 erg/cm2
90%_error_hi 4.77e-09 7.12e-09 1.36e-08 4.41e-08 2.45e-08 5.17e-08 erg/cm2
Peak flux CPL 8.70e-02 1.14e-01 1.15e-01 2.30e-01 3.84e-01 5.40e-01 ph/cm2/s
90%_error_low N/A N/A -3.33e-02 N/A N/A -5.40e-01 ph/cm2/s
90%_error_hi N/A N/A 4.26e-02 N/A N/A 1.54e-01 ph/cm2/s
======================================================================
Image
Pre-slew 15.0-350.0 keV image (Event data)
#   RAcent    DECcent   POSerr    Theta     Phi              Peak Cts       SNR   Name
   32.3186   -67.9914   0.0159     6.8226    -4.3614         0.3437399     12.087 TRIG_00416115

Foreground time interval of the image:
 -3.028   6.904 (delta_t =   9.932 [sec])
Background time interval of the image:
-239.120  -3.028 (delta_t = 236.092 [sec])
Light Curves
Note: The mask-weighted lightcurves have units of either count/det or counts/sec/det, where a det is 0.4 x 0.4 = 0.16 sq cm.
Full-time range; 1 s binning
Other quick-look light curves:
- 64 ms binning (zoomed)
- 16 ms binning (zoomed)
- 8 ms binning (zoomed)
- 2 ms binning (zoomed)
- SN=5 or 10 s binning (full-time range)
- Raw light curve
Spectra
- 64 ms binning (zoomed)
- 16 ms binning (zoomed)
- 8 ms binning (zoomed)
- 2 ms binning (zoomed)
- SN=5 or 10 s binning (full-time range)
- Raw light curve
Spectra
Notes:
- 1) The fitting includes the systematic errors.
- 2) When the burst includes telescope slew time periods, the fitting uses an average response file made from multiple 5-s response files through out the slew time plus single time preiod for the non-slew times, and weighted by the total counts in the corresponding time period using addrmf. An average response file is needed becuase a spectral fit using the pre-slew DRM will introduce some errors in both a spectral shape and a normalization if the PHA file contains a lot of the slew/post-slew time interval.
- 3) For fits to more complicated models (e.g. a power-law over a cutoff power-law), the BAT team has decided to require a chi-square improvement of more than 6 for each extra dof.
Time averaged spectrum fit using the average DRM
Power-law model

Time interval is from   -3.028 sec. to    6.904 sec.

Spectral model in power-law:
------------------------------------------------------------
Parameters  : value       lower 90%   higher 90%
Photon index: -1.56987     ( -0.263145   0.254157 )
Norm@50keV  : 1.95225E-03    ( -0.000301761   0.000294819 )
------------------------------------------------------------
#Fit statistic : Chi-Squared =          49.05 using 59 PHA bins.
# Reduced chi-squared =         0.8606 for     57 degrees of freedom
# Null hypothesis probability =   7.638575e-01

Photon flux (15-150 keV)    in 9.932 sec: 0.248596 ( -0.034628  0.034644 ) ph/cm2/s
Energy fluence (15-150 keV)             : 1.82061e-07 ( -3.04963e-08  3.11884e-08 ) ergs/cm2
Cutoff power-law model
Time interval is from   -3.028 sec. to    6.904 sec.
Spectral model in the cutoff power-law:
------------------------------------------------------------
Parameters  : value       lower 90%   higher 90%
Photon index: -1.56781     ( -0.338328   0.920202 )
Epeak [keV] : 9996.90      ( -9997.44 -9997.44 )
Norm@50keV  : 1.95729E-03    ( -0.000304204   0.00438218 )
------------------------------------------------------------
#Fit statistic : Chi-Squared =          49.05 using 59 PHA bins.
# Reduced chi-squared =         0.8760 for     56 degrees of freedom
# Null hypothesis probability =   7.330188e-01

Photon flux (15-150 keV)    in 9.932 sec: 0.248858 ( -0.036077  0.034542 ) ph/cm2/s
Energy fluence (15-150 keV)             : 1.82405e-07 ( -3.44307e-08  2.45359e-08 ) ergs/cm2
1-s peak spectrum fit
Power-law model
Time interval is from    2.116 sec. to    3.116 sec.

Spectral model in power-law:
------------------------------------------------------------
Parameters  : value       lower 90%   higher 90%
Photon index: -0.97947     ( -0.506402   0.563136 )
Norm@50keV  : 3.31094E-03    ( -0.000933966   0.000904442 )
------------------------------------------------------------
#Fit statistic : Chi-Squared =          56.82 using 59 PHA bins.
# Reduced chi-squared =         0.9969 for     57 degrees of freedom
# Null hypothesis probability =   4.817309e-01

Photon flux (15-150 keV)    in 1 sec: 0.380807 ( -0.106718  0.107681 ) ph/cm2/s
Energy fluence (15-150 keV)             : 3.60712e-08 ( -1.03548e-08  1.04756e-08 ) ergs/cm2
Cutoff power-law model
Time interval is from    2.116 sec. to    3.116 sec.
Spectral model in the cutoff power-law:
------------------------------------------------------------
Parameters  : value       lower 90%   higher 90%
Photon index: -2.75465     ( 2.75525   4.0738 )
Epeak [keV] : 221.852      (   )
Norm@50keV  : 3.55587E-04    (     )
------------------------------------------------------------
#Fit statistic : Chi-Squared =          56.19 using 59 PHA bins.
# Reduced chi-squared =          1.003 for     56 degrees of freedom
# Null hypothesis probability =   4.679081e-01

Photon flux (15-150 keV)    in 1 sec: 0.383920 (    ) ph/cm2/s
Energy fluence (15-150 keV)             : 3.62068e-08 ( -1.13297e-08  1.09115e-08 ) ergs/cm2
Time-resolved spectra
Distribution
T90 vs. Hardness ratio plot
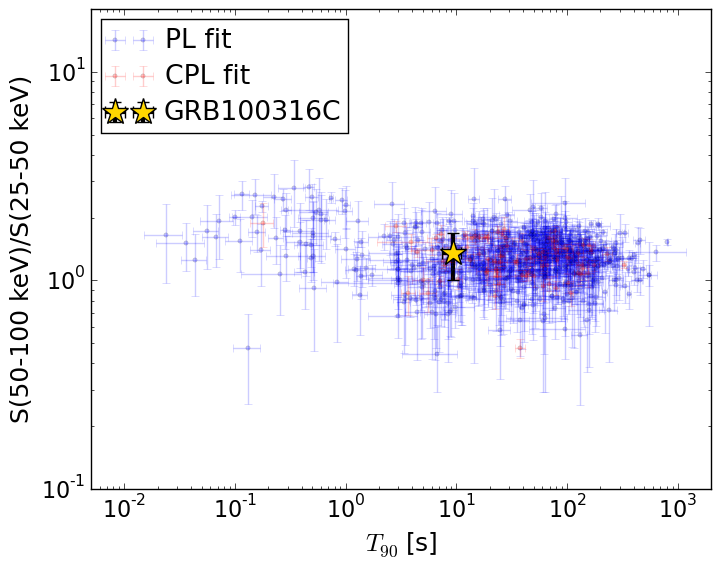
T90                                   = 9.268 sec.
Hardness ratio (energy fluence ratio) = 1.34737961679
S(15-50 keV) vs. S(50-150 keV) plot
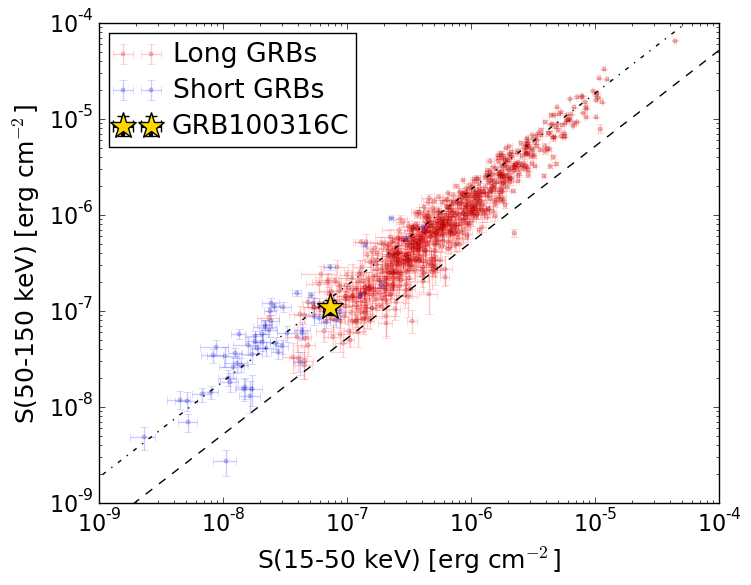
S(15-50 keV)  = 7.298635e-08
S(50-150 keV) = 1.0907297e-07
The dash-dotted line and the dashed line traces the fluences calculated from the Band function with Epeak = 15 and 150 keV, respectively. Both lines assume a canonical values of alpha = -1 and beta = -2.5.
Mask shadow pattern
IMX = 1.192961137551998E-01, IMY = 9.098437706870487E-03
Spacecraft aspect plot
Bright source in the pre-burst/pre-slew/post-slew images
Pre-burst image of 15-350 keV band
Time interval of the image:
-239.120000 -3.028000

# RAcent  DECcent POSerr Theta    Phi  PeakCts   SNR AngSep     Name
#  [deg]    [deg]    ['] [deg]  [deg]                   [']
264.8028 -44.4388    7.1  54.1  168.9  -1.2444  -1.6    2.7	4U 1735-44
255.6870 -48.8281    1.9  52.2  159.7   4.4574   5.9 ------	UNKNOWN
310.3118 -30.1882    2.4  54.0 -143.3   5.6476   4.8 ------	UNKNOWN
Pre-slew background subtracted image of 15-350 keV band
Time interval of the image:
-3.028000 6.904000

# RAcent  DECcent POSerr Theta    Phi  PeakCts   SNR AngSep     Name
#  [deg]    [deg]    ['] [deg]  [deg]                   [']
264.6211 -44.5714    4.3  54.1  168.7  -0.3890  -2.7    9.0	4U 1735-44
111.9779 -49.4695    2.3  45.4   48.5   0.6589   5.1 ------	UNKNOWN
164.4811 -70.7454    2.1  35.8   96.5   0.4040   5.5 ------	UNKNOWN
 32.3186 -67.9914    1.0   6.8   -4.4   0.3437  12.1 ------	UNKNOWN
 59.2283 -36.4748    2.5  41.7  -10.5   0.1977   4.6 ------	UNKNOWN
 47.5823 -42.3193    2.6  33.4  -21.7   0.1500   4.4 ------	UNKNOWN
Post-slew image of 15-350 keV band
Time interval of the image:
62.380610 902.901200

# RAcent  DECcent POSerr Theta    Phi  PeakCts   SNR AngSep     Name
#  [deg]    [deg]    ['] [deg]  [deg]                   [']
165.0684 -68.2340    2.6  39.9  103.9   6.9342   4.4 ------	UNKNOWN
115.7255 -59.7060    3.2  34.7   67.3   3.4829   3.7 ------	UNKNOWN
 63.3972 -38.7037    2.5  33.9   -4.7   2.7878   4.7 ------	UNKNOWN
 28.5788 -53.8672    2.8  14.2  -60.0   1.8325   4.1 ------	UNKNOWN
337.7058 -45.7524    3.3  35.4 -130.4   2.6511   3.5 ------	UNKNOWN
357.3838 -42.6524    2.9  31.3 -105.1   2.8968   4.0 ------	UNKNOWN