Analysis Summary
Notes:
- 1) No attempt has been made to eliminate the non-significant decimal places.
- 2) This batgrbproduct analysis is done using the HEASARC data.
- 3) This batgrbproduct analysis is using the flight position for the mask-weighting calculation.
======================================================================
                  BAT GRB EVENT DATA PROCESSING REPORT
    Process Script Ver: batgrbproduct v2.46
    Process Start Time: Fri Jan 17 19:13:38 EST 2014
             Host Name: batevent1
   Current Working Dir: /local/data/batevent/batevent_reproc/trigger416135
======================================================================

  Trigger: 00416135      Segment: 000

  BAT Trigger Time: 290436296   [s; MET]
      Trigger Stop: 290436360   [s; MET]
               UTC: 2010-03-16T12:44:50.380880    [includes UTCF correction]
       Where From?: TDRSS position message

  BAT
    RA: 107.615363831075   Dec: -56.2780007185453  [deg; J2000]

     Catalogged Source?: NO
     Point Source?:      YES
     GRB Indicated?:     YES    [ by BAT flight software ]
     Image S/N Ratio:    7.83
     Image Trigger?:     YES
     Rate S/N Ratio:     0  [ if not an image trigger ]
     Image S/N Ratio:    7.83

  Analysis Position:   [ source = BAT ]
    RA: 107.615363831075   Dec: -56.2780007185453  [deg; J2000]

  Refined Position:   [ source = BAT pre-slew burst ]
    RA: 107.621567418663   Dec: -56.2775237906047  [deg; J2000]
        { 07h 10m 29.2s , -56d 16' 39.1" }
         +/- 2.8120274659049 [arcmin] (estimated 90% radius based on SNR)
         +/- 1.27787622777082 [arcmin] (formal 1-sigma fit error)
    SNR: 6.94483398072056

  Angular difference between the analysis and refined position is 0.208614 arcmin

  Partial Coding Fraction: 0.8515625    [ including projection effects ]

  Duration
     T90: 521.879999935627 +/- 439.62352011198
        Measured from: 269.847999989986
                   to: 791.727999925613     [s; relative to TRIGTIME]
     T50: 89.7919999957085 +/- 643.790846848122
        Measured from: 454.371999979019
                   to: 544.163999974728     [s; relative to TRIGTIME]


  Fluence
     Peak Flux  (peak 1 second)
        Measured from: -104.040000021458
                   to: -103.040000021458     [s; relative to TRIGTIME]
     Total Fluence
        Measured from: -158.967999994755
                   to: 794.772000014782     [s; relative to TRIGTIME]

             Band 1     Band 2     Band 3     Band 4
              15-25      25-50     50-100    100-350     keV
 Total     3.215291   2.664564   1.030558   0.027885
           0.167718   0.170220   0.146831   0.128306 [error]
 Peak      0.009423   0.023479   0.017168   0.008848
           0.008573   0.009335   0.008249   0.006878 [error]

     [ fluence units of on-axis counts / fully illuminated detector ]

======================================================================


====== Table of the duration information =============================

        Value   tstart    tstop
T100  953.740 -158.968  794.772
T90   521.880  269.848  791.728
T50    89.792  454.372  544.164
Peak    1.000 -104.040 -103.040


====== Spectral Analysis Summary =====================================

Model      : spectral model: simple power-law (PL) and cutoff power-law (CPL)
Ph_index   : photon index: E^{Ph_index}
Ph_90err   : 90% error of the photon index
Epeak      : Epeak in keV
Epeak_90err: 90% error of Epeak
Norm       : normalization at 50 keV in both the PL model and CPL model
Nomr_90err : 90% error of the normalization
chi2       : Chi-Squared
dof        : degree of freedo

=== Time-averaged spectral analysis ===
(Best model with acceptable fit: PL)

Model Ph_index Ph_90err_low Ph_90err_hi  Epeak  Epeak_90err_low  Epeak_90err_hi  Norm       Nomr_90err_low    Norm_90err_hi    chi2    dof
PL      -2.359    -0.166      0.157       -           -               -         3.56e-04     -4.01e-05          3.96e-05      63.590   57
CPL     -1.878    -0.126      0.741        9.615      -8.669        18.696      6.98e-04     -1.93e-04          1.29e-03      61.860   56


=== 1-s peak spectral analysis ===
(Best model with acceptable fit: N/A)

Model Ph_index Ph_90err_low Ph_90err_hi  Epeak  Epeak_90err_low  Epeak_90err_hi  Norm       Nomr_90err_low    Norm_90err_hi    chi2    dof
PL      -1.466     -1.034     1.058       -           -               -         3.45e-03     -3.45e-03          1.77e-03      52.130   57
CPL     -1.464      1.464     4.833     9985.960      N/A           N/A         3.47e-03        N/A               N/A         52.130   56


=== Fluence/Peak Flux Summary ===

              Model    Band1     Band2     Band3     Band4     Band5     Total
                       15-25     25-50    50-100    100-350    15-150    15-350    keV
Fluence         PL   9.77e-07  1.07e-06  8.34e-07  1.07e-06  3.28e-06  3.95e-06   erg/cm2
      90%_error_low -9.85e-08 -8.40e-08 -1.28e-07 -2.87e-07 -2.90e-07 -4.59e-07   erg/cm2
      90%_error_hi   1.00e-07  8.36e-08  1.33e-07  3.54e-07  2.97e-07  5.07e-07   erg/cm2
Peak flux       PL   1.37e-01  1.41e-01  1.02e-01  1.18e-01  4.27e-01  4.99e-01   ph/cm2/s
      90%_error_low -1.06e-01 -1.41e-01 -1.02e-01 -1.18e-01 -2.23e-01 -2.53e-01   ph/cm2/s
      90%_error_hi   1.35e-01  7.70e-02  6.30e-02  2.48e-01  2.24e-01  2.59e-01   ph/cm2/s

Fluence        CPL   9.77e-07  1.09e-06  8.24e-07  1.06e-06  3.21e-06  3.95e-06   erg/cm2
      90%_error_low -9.89e-08    N/A       N/A       N/A       N/A    -4.35e-07   erg/cm2
      90%_error_hi   1.00e-07    N/A       N/A       N/A       N/A     6.80e-07   erg/cm2
Peak flux      CPL   1.43e-01  1.41e-01  1.01e-01  1.28e-01  4.29e-01  5.02e-01   ph/cm2/s
      90%_error_low -1.43e-01 -8.42e-02 -6.44e-02     N/A   -4.29e-01 -5.02e-01   ph/cm2/s
      90%_error_hi   1.31e-01  1.37e-01  7.20e-02     N/A    2.29e-01  2.50e-01   ph/cm2/s

======================================================================
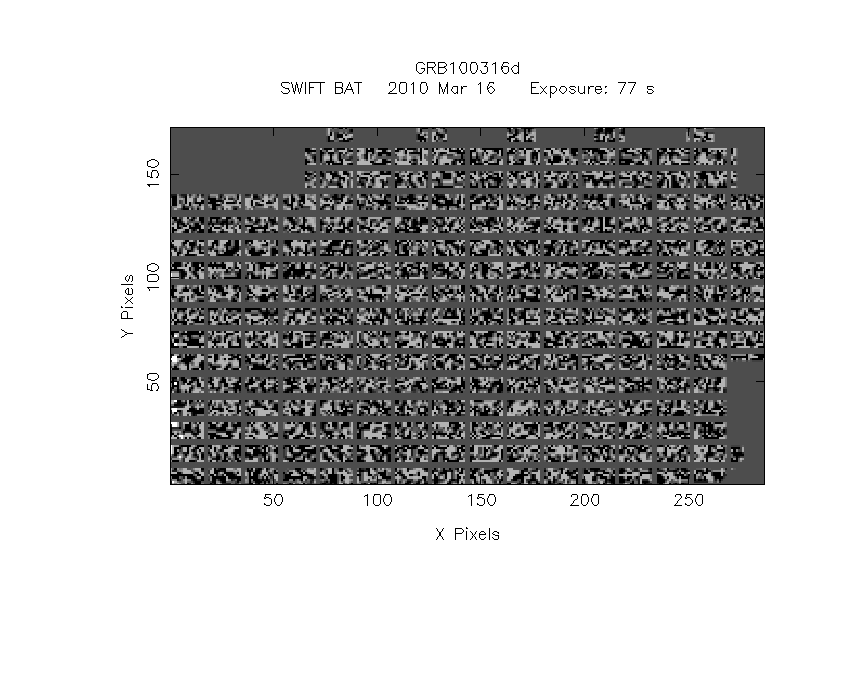
Image
Pre-slew 15.0-350.0 keV image (Event data)
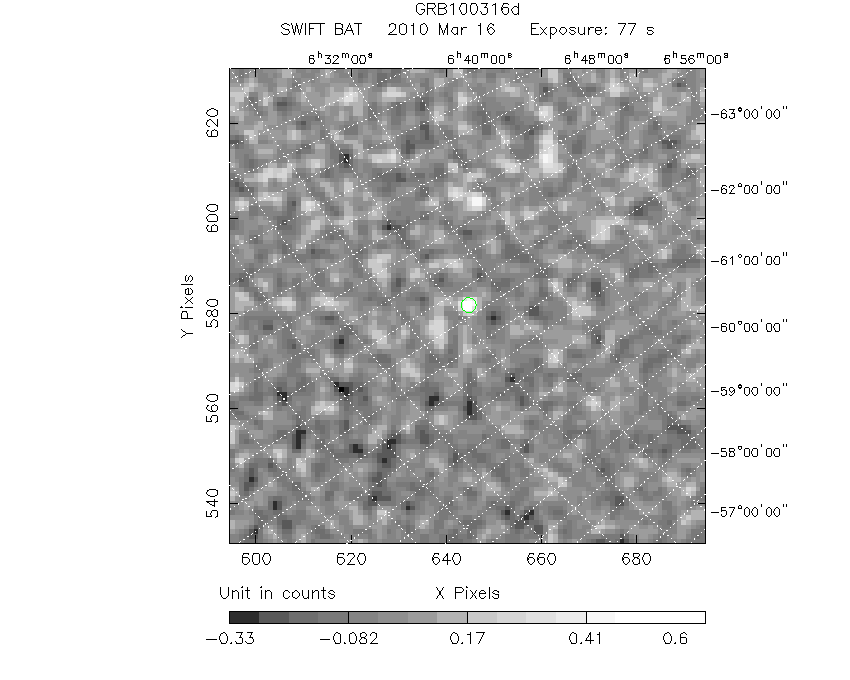
#   RAcent    DECcent   POSerr    Theta     Phi              Peak Cts       SNR   Name
  107.6216   -56.2775   0.0277    28.3985   -24.0963         0.7030134      6.945 TRIG_00416135

Foreground time interval of the image:
 -3.499  73.701 (delta_t =  77.200 [sec])
Background time interval of the image:
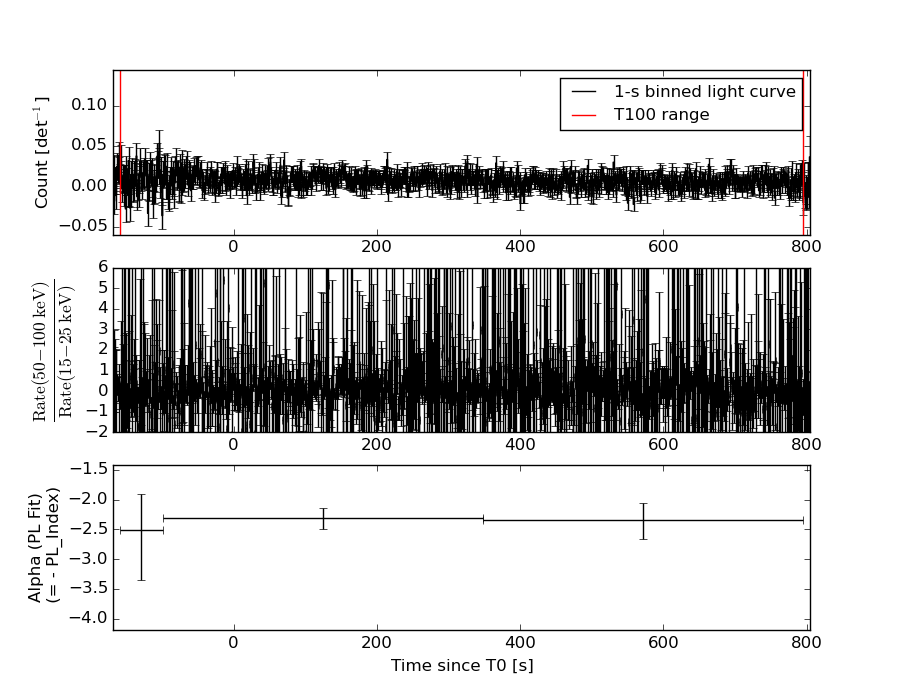
Light Curves
Note: The mask-weighted lightcurves have units of either count/det or counts/sec/det, where a det is 0.4 x 0.4 = 0.16 sq cm.
Full-time range; 1 s binning
Other quick-look light curves:
- 64 ms binning (zoomed)
- 16 ms binning (zoomed)
- 8 ms binning (zoomed)
- 2 ms binning (zoomed)
- SN=5 or 10 s binning (full-time range)
- Raw light curve
Spectra
- 64 ms binning (zoomed)
- 16 ms binning (zoomed)
- 8 ms binning (zoomed)
- 2 ms binning (zoomed)
- SN=5 or 10 s binning (full-time range)
- Raw light curve
Spectra
Notes:
- 1) The fitting includes the systematic errors.
- 2) When the burst includes telescope slew time periods, the fitting uses an average response file made from multiple 5-s response files through out the slew time plus single time preiod for the non-slew times, and weighted by the total counts in the corresponding time period using addrmf. An average response file is needed becuase a spectral fit using the pre-slew DRM will introduce some errors in both a spectral shape and a normalization if the PHA file contains a lot of the slew/post-slew time interval.
- 3) For fits to more complicated models (e.g. a power-law over a cutoff power-law), the BAT team has decided to require a chi-square improvement of more than 6 for each extra dof.
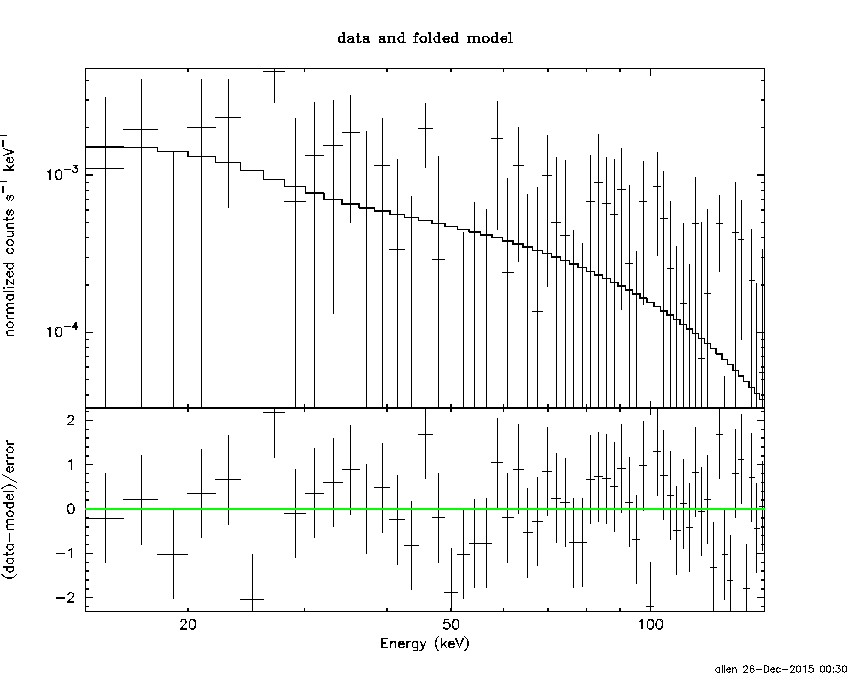
Time averaged spectrum fit using the average DRM
Power-law model
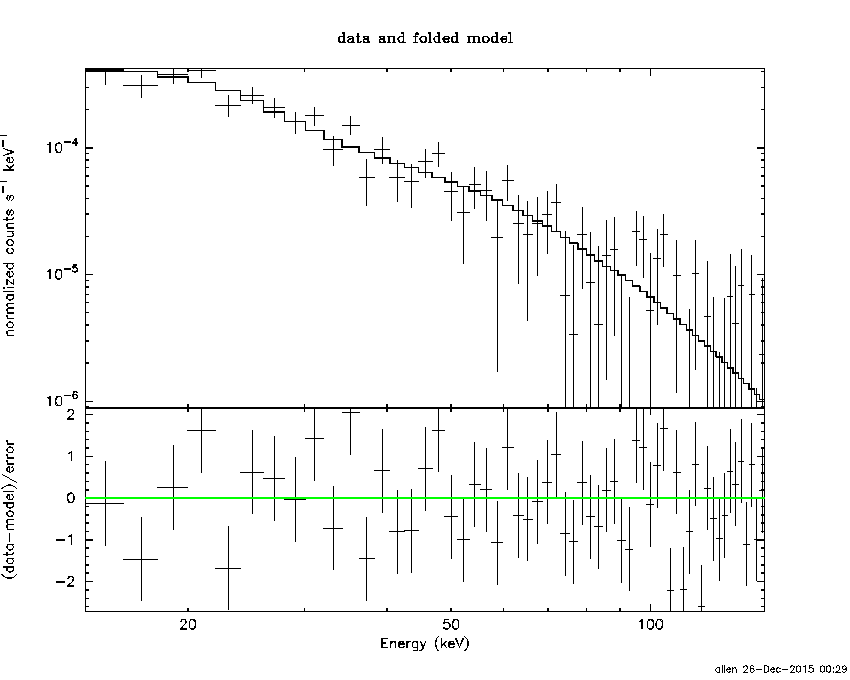
Time interval is from -158.968 sec. to  794.772 sec.

Spectral model in power-law:
------------------------------------------------------------
Parameters  : value       lower 90%   higher 90%
Photon index: -2.35918     ( -0.165905   0.157442 )
Norm@50keV  : 3.55563E-04    ( -4.01001e-05   3.95932e-05 )
------------------------------------------------------------
#Fit statistic : Chi-Squared =          63.59 using 59 PHA bins.
# Reduced chi-squared =          1.116 for     57 degrees of freedom
# Null hypothesis probability =   2.557299e-01

Photon flux (15-150 keV)    in 953.7 sec: 6.42579E-02 ( -0.0047837  0.0047857 ) ph/cm2/s
Energy fluence (15-150 keV)             : 3.27915e-06 ( -2.90183e-07  2.96551e-07 ) ergs/cm2
Cutoff power-law model
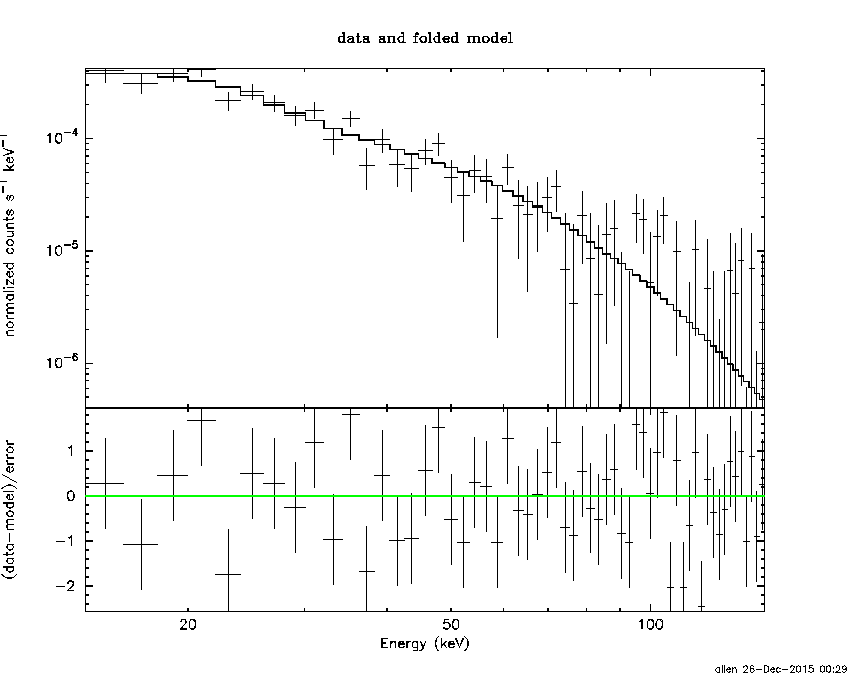
Time interval is from -158.968 sec. to  794.772 sec.
Spectral model in the cutoff power-law:
------------------------------------------------------------
Parameters  : value       lower 90%   higher 90%
Photon index: -1.87766     ( -0.126177   0.740613 )
Epeak [keV] : 9.61547      ( -8.66887 18.6964 )
Norm@50keV  : 6.98454E-04    ( -0.00019333   0.00128999 )
------------------------------------------------------------
#Fit statistic : Chi-Squared =          61.86 using 59 PHA bins.
# Reduced chi-squared =          1.105 for     56 degrees of freedom
# Null hypothesis probability =   2.748735e-01

Photon flux (15-150 keV)    in 953.7 sec: 6.41508E-02 ( -0.004757  0.004988 ) ph/cm2/s
Energy fluence (15-150 keV)             : 3.20997e-06 ( 0  0 ) ergs/cm2
1-s peak spectrum fit
Power-law model
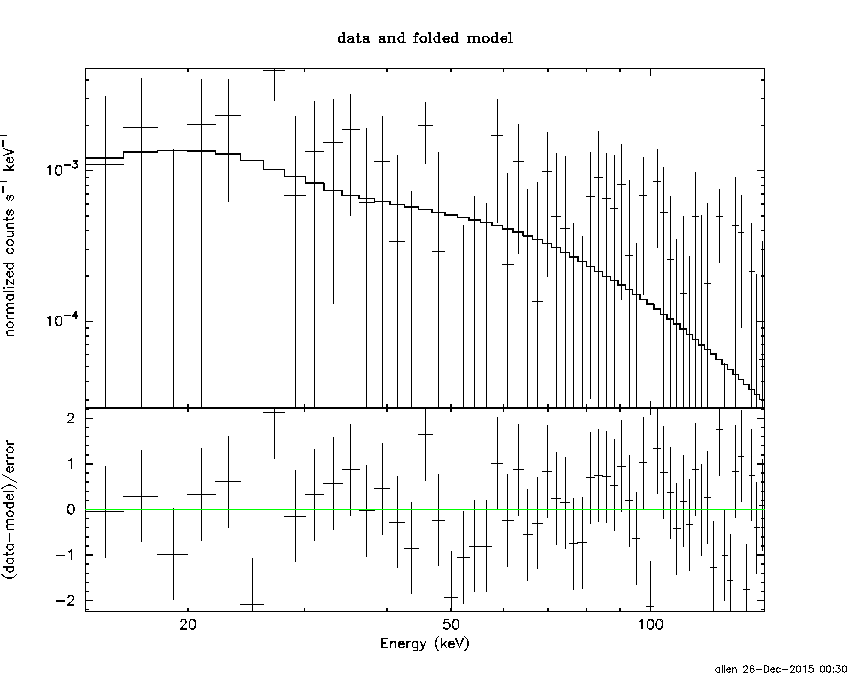
Time interval is from -104.040 sec. to -103.040 sec.

Spectral model in power-law:
------------------------------------------------------------
Parameters  : value       lower 90%   higher 90%
Photon index: -1.46639     ( -1.03377   1.0578 )
Norm@50keV  : 3.45002E-03    ( -0.00345002   0.0017674 )
------------------------------------------------------------
#Fit statistic : Chi-Squared =          52.13 using 59 PHA bins.
# Reduced chi-squared =         0.9146 for     57 degrees of freedom
# Null hypothesis probability =   6.579152e-01

Photon flux (15-150 keV)    in 1 sec: 0.426933 ( -0.222587  0.224219 ) ph/cm2/s
Energy fluence (15-150 keV)             : 3.29208e-08 ( -1.81175e-08  1.8766e-08 ) ergs/cm2
Cutoff power-law model
Time interval is from -104.040 sec. to -103.040 sec.
Spectral model in the cutoff power-law:
------------------------------------------------------------
Parameters  : value       lower 90%   higher 90%
Photon index: -2.51601     ( 2.51541   5.88403 )
Epeak [keV] : 171.096      (   )
Norm@50keV  : 8.98530E-04    (     )
------------------------------------------------------------
#Fit statistic : Chi-Squared =          52.06 using 59 PHA bins.
# Reduced chi-squared =         0.9297 for     56 degrees of freedom
# Null hypothesis probability =   6.245826e-01

Photon flux (15-150 keV)    in 1 sec: 0.429468 ( -0.429468  0.229265 ) ph/cm2/s
Energy fluence (15-150 keV)             : 3.32797e-08 ( -2.08205e-08  1.61525e-08 ) ergs/cm2
Time-resolved spectra
Distribution
T90 vs. Hardness ratio plot
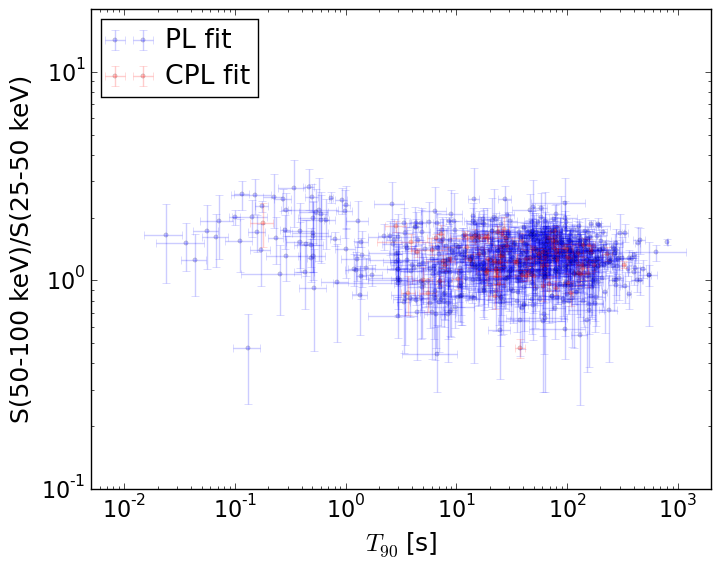
T90                                   = N/A sec.
Hardness ratio (energy fluence ratio) = N/A
S(15-50 keV) vs. S(50-150 keV) plot
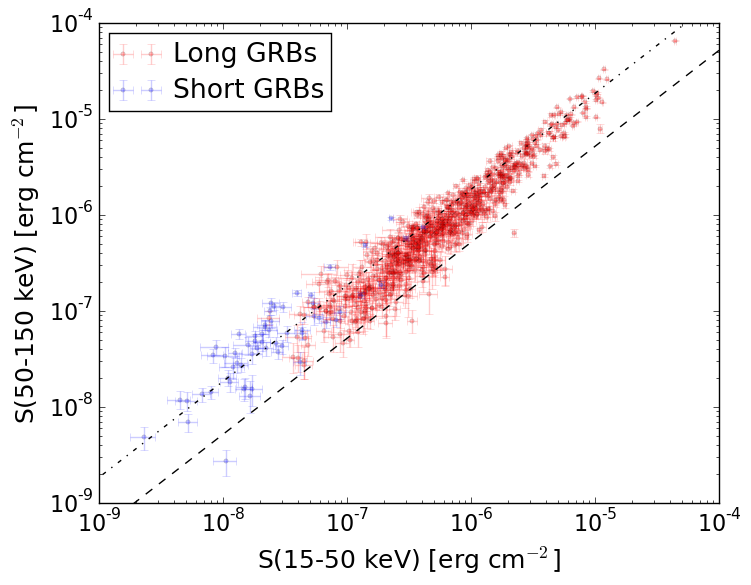
S(15-50 keV)  = N/A
S(50-150 keV) = N/A
The dash-dotted line and the dashed line traces the fluences calculated from the Band function with Epeak = 15 and 150 keV, respectively. Both lines assume a canonical values of alpha = -1 and beta = -2.5.
Mask shadow pattern
IMX = 4.935501115879957E-01, IMY = 2.207369702498418E-01
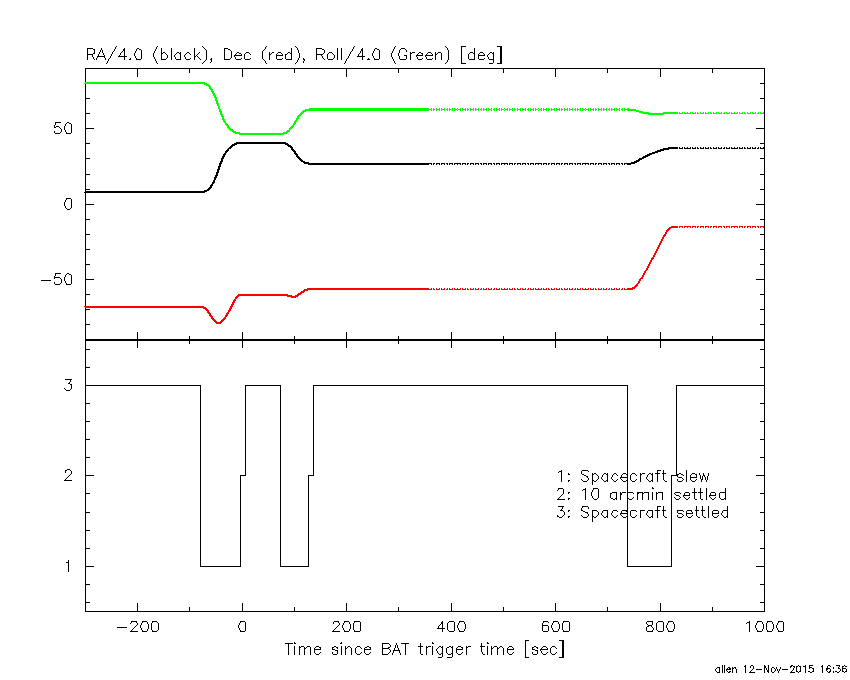
Spacecraft aspect plot
Bright source in the pre-burst/pre-slew/post-slew images
Pre-burst image of 15-350 keV band
Time interval of the image:
Pre-slew background subtracted image of 15-350 keV band
Time interval of the image:
-3.499400 73.700590

# RAcent  DECcent POSerr Theta    Phi  PeakCts   SNR AngSep     Name
#  [deg]    [deg]    ['] [deg]  [deg]                   [']
135.5193 -40.5534    0.5  25.6   30.1   2.1817  22.6    0.4	Vela X-1
170.0118 -60.4729    0.0   3.8 -174.5   0.0649   0.7   12.7	Cen X-3
186.6294 -62.7559    0.7  11.9 -162.4   1.3952  16.3    1.1	GX 301-2
264.7295 -44.3060    5.6  58.1 -152.3  -1.3507  -2.2    8.7	4U 1735-44
123.3855 -17.8292    2.8  50.5   32.1   1.8567   4.2 ------	UNKNOWN
107.6215 -56.2776    1.6  28.4  -24.1   0.7031   7.0 ------	UNKNOWN
104.4637 -57.7335    2.2  29.2  -28.5   0.5389   5.3 ------	UNKNOWN
333.9008 -78.8780    2.9  41.2  -99.3   1.9600   4.0 ------	UNKNOWN
Post-slew image of 15-350 keV band
Time interval of the image:
126.300600 738.300590

# RAcent  DECcent POSerr Theta    Phi  PeakCts   SNR AngSep     Name
#  [deg]    [deg]    ['] [deg]  [deg]                   [']
135.5287 -40.5473    0.4  24.0   80.2  11.8794  26.9    0.4	Vela X-1
170.3913 -60.4918  492.7  31.9  143.2  -0.0123  -0.0    8.2	Cen X-3
186.6444 -62.7475    1.1  38.0  152.3   8.0238  10.6    1.4	GX 301-2
150.0860 -32.5052    3.5  37.6   88.2   3.4494   3.3 ------	UNKNOWN
128.7558 -34.7099    2.4  25.9   61.9   2.0429   4.8 ------	UNKNOWN
107.6993 -56.2623    1.0   0.0  111.2   4.0086  11.7 ------	UNKNOWN
356.3804 -65.1750    2.7  47.9 -129.0   7.8780   4.2 ------	UNKNOWN