Analysis Summary
Notes:
- 1) No attempt has been made to eliminate the non-significant decimal places.
- 2) This batgrbproduct analysis is done using the HEASARC data.
- 3) This batgrbproduct analysis is using the flight position for the mask-weighting calculation.
======================================================================
                  BAT GRB EVENT DATA PROCESSING REPORT
    Process Script Ver: batgrbproduct v2.46
    Process Start Time: Fri Jan 17 19:10:09 EST 2014
             Host Name: batevent1
   Current Working Dir: /local/data/batevent/batevent_reproc/trigger419404
======================================================================

  Trigger: 00419404      Segment: 000

  BAT Trigger Time: 292872814.08   [s; MET]
      Trigger Stop: 292872830.464   [s; MET]
               UTC: 2010-04-13T17:33:28.376380    [includes UTCF correction]
       Where From?: TDRSS position message

  BAT
    RA: 266.217404254234   Dec: 15.8373523553948  [deg; J2000]

     Catalogged Source?: NO
     Point Source?:      YES
     GRB Indicated?:     YES    [ by BAT flight software ]
     Image S/N Ratio:    10.59
     Image Trigger?:     NO
     Rate S/N Ratio:     10.9544511501033  [ if not an image trigger ]
     Image S/N Ratio:    10.59

  Analysis Position:   [ source = BAT ]
    RA: 266.217404254234   Dec: 15.8373523553948  [deg; J2000]

  Refined Position:   [ source = BAT pre-slew burst ]
    RA: 266.219946729964   Dec: 15.8356017757855  [deg; J2000]
        { 17h 44m 52.8s , +15d 50' 08.2" }
         +/- 1.49140926157679 [arcmin] (estimated 90% radius based on SNR)
         +/- 0.57964780762635 [arcmin] (formal 1-sigma fit error)
    SNR: 17.1839460449435

  Angular difference between the analysis and refined position is 0.180473 arcmin

  Partial Coding Fraction: 0.4882812    [ including projection effects ]

  Duration
     T90: 192.63999992609 +/- 12.0942903797611
        Measured from: 6.48400002717972
                   to: 199.12399995327     [s; relative to TRIGTIME]
     T50: 99.323999941349 +/- 6.44662828120599
        Measured from: 50.6480000019073
                   to: 149.971999943256     [s; relative to TRIGTIME]


  Fluence
     Peak Flux  (peak 1 second)
        Measured from: 116.780000030994
                   to: 117.780000030994     [s; relative to TRIGTIME]
     Total Fluence
        Measured from: -3.40799999237061
                   to: 223.068000018597     [s; relative to TRIGTIME]

             Band 1     Band 2     Band 3     Band 4
              15-25      25-50     50-100    100-350     keV
 Total     1.946568   2.825665   3.104903   1.065553
           0.113113   0.104492   0.090560   0.076540 [error]
 Peak      0.015291   0.023675   0.036008   0.027097
           0.005752   0.005700   0.005262   0.004405 [error]

     [ fluence units of on-axis counts / fully illuminated detector ]

======================================================================


====== Table of the duration information =============================

        Value   tstart    tstop
T100  226.476   -3.408  223.068
T90   192.640    6.484  199.124
T50    99.324   50.648  149.972
Peak    1.000  116.780  117.780


====== Spectral Analysis Summary =====================================

Model      : spectral model: simple power-law (PL) and cutoff power-law (CPL)
Ph_index   : photon index: E^{Ph_index}
Ph_90err   : 90% error of the photon index
Epeak      : Epeak in keV
Epeak_90err: 90% error of Epeak
Norm       : normalization at 50 keV in both the PL model and CPL model
Nomr_90err : 90% error of the normalization
chi2       : Chi-Squared
dof        : degree of freedo

=== Time-averaged spectral analysis ===
(Best model with acceptable fit: PL)

Model Ph_index Ph_90err_low Ph_90err_hi  Epeak  Epeak_90err_low  Epeak_90err_hi  Norm       Nomr_90err_low    Norm_90err_hi    chi2    dof
PL      -1.097    -0.069      0.070       -           -               -         2.61e-03     -9.60e-05          9.56e-05      54.970   57
CPL     -1.094    -0.068      0.072     9999.360    -9999.360      -9999.360      2.62e-03     -4.91e-05          4.21e-04      55.030   56


=== 1-s peak spectral analysis ===
(Best model with acceptable fit: PL)

Model Ph_index Ph_90err_low Ph_90err_hi  Epeak  Epeak_90err_low  Epeak_90err_hi  Norm       Nomr_90err_low    Norm_90err_hi    chi2    dof
PL      -0.672     -0.354     0.401       -           -               -         5.54e-03     -1.21e-03          1.14e-03      54.830   57
CPL     -0.587     -0.443     1.049      997.308    -997.308      -997.308      6.02e-03     -1.65e-03          -6.02e-03      55.000   56


=== Fluence/Peak Flux Summary ===

              Model    Band1     Band2     Band3     Band4     Band5     Total
                       15-25     25-50    50-100    100-350    15-150    15-350    keV
Fluence         PL   5.18e-07  1.22e-06  2.28e-06  1.03e-05  6.18e-06  1.43e-05   erg/cm2
      90%_error_low -4.23e-08 -5.84e-08 -8.75e-08 -9.44e-07 -2.27e-07 -9.72e-07   erg/cm2
      90%_error_hi   4.38e-08  5.81e-08  8.72e-08  1.01e-06  2.27e-07  1.03e-06   erg/cm2
Peak flux       PL   1.04e-01  1.72e-01  2.16e-01  5.38e-01  6.42e-01  1.03e+00   ph/cm2/s
      90%_error_low -4.54e-02 -5.07e-02 -3.91e-02 -1.99e-01 -1.24e-01 -2.13e-01   ph/cm2/s
      90%_error_hi   5.56e-02  4.96e-02  3.90e-02  2.82e-01  1.25e-01  2.49e-01   ph/cm2/s

Fluence        CPL   5.17e-07  1.22e-06  2.28e-06  1.06e-05  6.22e-06  1.42e-05   erg/cm2
      90%_error_low    N/A       N/A       N/A    -2.56e-06 -2.65e-07 -1.87e-06   erg/cm2
      90%_error_hi     N/A       N/A       N/A     1.89e-07  1.90e-07  5.03e-07   erg/cm2
Peak flux      CPL   1.04e-01  1.72e-01  2.16e-01  5.34e-01  6.42e-01  1.12e+00   ph/cm2/s
      90%_error_low     N/A       N/A       N/A       N/A   -1.24e-01 -4.43e-01   ph/cm2/s
      90%_error_hi      N/A       N/A       N/A       N/A    1.25e-01  1.35e-01   ph/cm2/s

======================================================================
Image
Pre-slew 15.0-350.0 keV image (Event data)
#   RAcent    DECcent   POSerr    Theta     Phi              Peak Cts       SNR   Name
  266.2199    15.8356   0.0111    38.2124   166.0697         2.7812294     17.184 TRIG_00419404

Foreground time interval of the image:
 -3.408  64.021 (delta_t =  67.429 [sec])
Background time interval of the image:
-239.080  -3.408 (delta_t = 235.672 [sec])
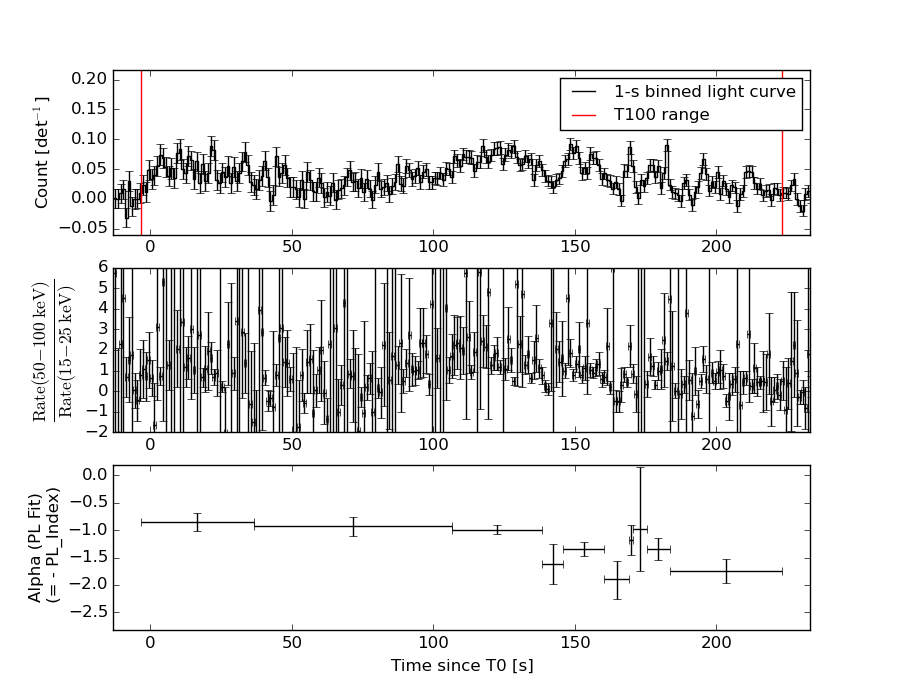
Light Curves
Note: The mask-weighted lightcurves have units of either count/det or counts/sec/det, where a det is 0.4 x 0.4 = 0.16 sq cm.
Full-time range; 1 s binning
Other quick-look light curves:
- 64 ms binning (zoomed)
- 16 ms binning (zoomed)
- 8 ms binning (zoomed)
- 2 ms binning (zoomed)
- SN=5 or 10 s binning (full-time range)
- Raw light curve
Spectra
- 64 ms binning (zoomed)
- 16 ms binning (zoomed)
- 8 ms binning (zoomed)
- 2 ms binning (zoomed)
- SN=5 or 10 s binning (full-time range)
- Raw light curve
Spectra
Notes:
- 1) The fitting includes the systematic errors.
- 2) When the burst includes telescope slew time periods, the fitting uses an average response file made from multiple 5-s response files through out the slew time plus single time preiod for the non-slew times, and weighted by the total counts in the corresponding time period using addrmf. An average response file is needed becuase a spectral fit using the pre-slew DRM will introduce some errors in both a spectral shape and a normalization if the PHA file contains a lot of the slew/post-slew time interval.
- 3) For fits to more complicated models (e.g. a power-law over a cutoff power-law), the BAT team has decided to require a chi-square improvement of more than 6 for each extra dof.
Time averaged spectrum fit using the average DRM
Power-law model

Time interval is from   -3.408 sec. to  223.068 sec.

Spectral model in power-law:
------------------------------------------------------------
Parameters  : value       lower 90%   higher 90%
Photon index: -1.09722     ( -0.0690107   0.0697919 )
Norm@50keV  : 2.60687E-03    ( -9.59708e-05   9.56086e-05 )
------------------------------------------------------------
#Fit statistic : Chi-Squared =          54.97 using 59 PHA bins.
# Reduced chi-squared =         0.9644 for     57 degrees of freedom
# Null hypothesis probability =   5.516766e-01

Photon flux (15-150 keV)    in 226.5 sec: 0.302297 ( -0.01184  0.011885 ) ph/cm2/s
Energy fluence (15-150 keV)             : 6.17958e-06 ( -2.27229e-07  2.27474e-07 ) ergs/cm2
Cutoff power-law model
Time interval is from   -3.408 sec. to  223.068 sec.
Spectral model in the cutoff power-law:
------------------------------------------------------------
Parameters  : value       lower 90%   higher 90%
Photon index: -1.09371     ( -0.0677126   0.0722991 )
Epeak [keV] : 9999.36      ( -9999.36 -9999.36 )
Norm@50keV  : 2.62150E-03    ( -4.8928e-05   0.000421013 )
------------------------------------------------------------
#Fit statistic : Chi-Squared =          55.03 using 59 PHA bins.
# Reduced chi-squared =         0.9827 for     56 degrees of freedom
# Null hypothesis probability =   5.115706e-01

Photon flux (15-150 keV)    in 226.5 sec: 0.302184 (    ) ph/cm2/s
Energy fluence (15-150 keV)             : 6.21539e-06 ( -2.64822e-07  1.896e-07 ) ergs/cm2
1-s peak spectrum fit
Power-law model
Time interval is from  116.780 sec. to  117.780 sec.

Spectral model in power-law:
------------------------------------------------------------
Parameters  : value       lower 90%   higher 90%
Photon index: -0.672348     ( -0.353862   0.400736 )
Norm@50keV  : 5.53998E-03    ( -0.00120543   0.00113633 )
------------------------------------------------------------
#Fit statistic : Chi-Squared =          54.83 using 59 PHA bins.
# Reduced chi-squared =         0.9620 for     57 degrees of freedom
# Null hypothesis probability =   5.568173e-01

Photon flux (15-150 keV)    in 1 sec: 0.641865 ( -0.124077  0.125298 ) ph/cm2/s
Energy fluence (15-150 keV)             : 6.84857e-08 ( -1.29528e-08  1.30091e-08 ) ergs/cm2
Cutoff power-law model
Time interval is from  116.780 sec. to  117.780 sec.
Spectral model in the cutoff power-law:
------------------------------------------------------------
Parameters  : value       lower 90%   higher 90%
Photon index: -0.664205     ( -0.442888   1.04929 )
Epeak [keV] : 1.00000E+04      ( -10000 -10000 )
Norm@50keV  : 5.58288E-03    ( -0.00120733   -0.00558338 )
------------------------------------------------------------
#Fit statistic : Chi-Squared =          54.85 using 59 PHA bins.
# Reduced chi-squared =         0.9794 for     56 degrees of freedom
# Null hypothesis probability =   5.185142e-01

Photon flux (15-150 keV)    in 1 sec: 0.641750 ( -0.124105  0.125188 ) ph/cm2/s
Energy fluence (15-150 keV)             : 6.87053e-08 ( -1.50861e-08  9.65029e-09 ) ergs/cm2
Time-resolved spectra
Distribution
T90 vs. Hardness ratio plot
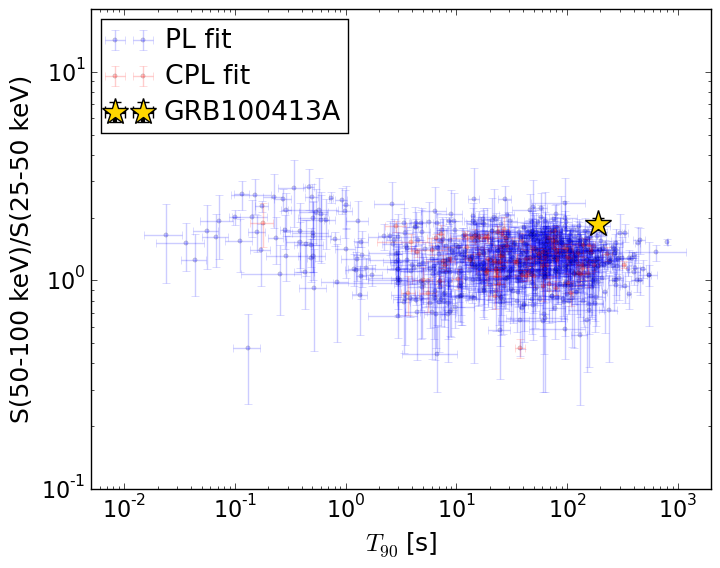
T90                                   = 192.64 sec.
Hardness ratio (energy fluence ratio) = 1.86969117039
S(15-50 keV) vs. S(50-150 keV) plot
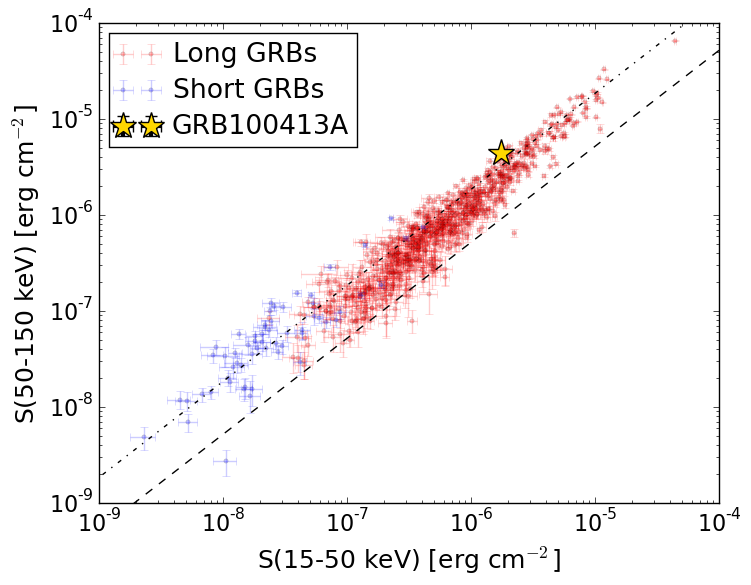
S(15-50 keV)  = 1.7362122e-06
S(50-150 keV) = 4.443288e-06
The dash-dotted line and the dashed line traces the fluences calculated from the Band function with Epeak = 15 and 150 keV, respectively. Both lines assume a canonical values of alpha = -1 and beta = -2.5.
Mask shadow pattern
IMX = -7.641177845530357E-01, IMY = -1.895293253531387E-01
Spacecraft aspect plot
Bright source in the pre-burst/pre-slew/post-slew images
Pre-burst image of 15-350 keV band
Time interval of the image:
-239.080000 -3.408000

# RAcent  DECcent POSerr Theta    Phi  PeakCts   SNR AngSep     Name
#  [deg]    [deg]    ['] [deg]  [deg]                   [']
244.9843 -15.6378    0.3  22.8   92.0  12.8548  43.4    0.3	Sco X-1
256.0664 -37.7453    3.0  18.5   20.1   0.8745   3.9    7.0	4U 1700-377
256.3747 -36.4705    3.8  17.4   22.0   0.6832   3.1    4.1	GX 349+2
263.1683 -24.7845   11.8   5.1   49.3   0.1982   1.0    9.0	GX 1+4
264.6151 -44.3079    8.5  22.2   -4.5  -0.3151  -1.4   10.1	4U 1735-44
268.3279  -1.4303   10.9  20.9  169.7   0.2423   1.1    2.8	SW J1753.5-0127
270.2620 -25.0644    1.9   3.4  -47.0   1.4424   6.1    1.5	GX 5-1
270.3016 -25.6859    5.5   3.9  -42.0   0.5316   2.3    3.4	GRS 1758-258
273.9199 -14.0709    2.9  10.0 -156.1   0.9580   3.9    5.4	GX 17+2
275.7293 -30.4955    0.0  10.7  -49.5   0.4229   1.8   12.7	H1820-303
284.9803 -24.8146   18.7  15.7  -88.6   0.1424   0.6    7.0	HT1900.1-2455
288.8278  10.9117    2.0  39.0 -157.5   2.2155   5.7    2.7	GRS 1915+105
262.9330 -33.7513   29.3  12.3    9.4  -0.0936  -0.4    5.7	GX 354-0
231.5467 -63.2112    2.3  47.6   10.2   2.3781   5.0 ------	UNKNOWN
255.6974 -48.7611    1.0  28.2    6.3   2.9702  11.2 ------	UNKNOWN
312.0093 -32.4634    3.0  40.0  -76.7   3.6974   4.0 ------	UNKNOWN
Pre-slew background subtracted image of 15-350 keV band
Time interval of the image:
-3.408000 64.020610

# RAcent  DECcent POSerr Theta    Phi  PeakCts   SNR AngSep     Name
#  [deg]    [deg]    ['] [deg]  [deg]                   [']
245.0681 -15.5815   14.6  22.7   92.2  -0.1129  -0.8    6.2	Sco X-1
255.8344 -37.7454    3.5  18.7   20.5   0.3328   3.3    9.3	4U 1700-377
256.4863 -36.5436   11.6  17.4   21.6  -0.1016  -1.0    7.6	GX 349+2
262.8632 -24.7528    4.1   5.3   51.0   0.2716   2.8    8.0	GX 1+4
264.7779 -44.4243    9.0  22.3   -4.9   0.1312   1.3    2.1	4U 1735-44
268.2665  -1.5863   38.2  20.7  169.5  -0.0297  -0.3   10.1	SW J1753.5-0127
270.3805 -25.2428    5.9   3.6  -46.7   0.2813   2.9   11.1	GX 5-1
270.2058 -25.5802    5.5   3.8  -41.7   0.3398   3.5   11.1	GRS 1758-258
274.0102 -13.8854    5.3  10.2 -156.3   0.2040   2.2    9.1	GX 17+2
275.9259 -30.3391   45.7  10.7  -50.7   0.0254   0.3    1.7	H1820-303
284.8831 -24.7655    0.0  15.6  -88.8  -0.1843  -1.7   12.5	HT1900.1-2455
288.8372  11.0492   13.6  39.1 -157.6  -0.1159  -0.9    6.6	GRS 1915+105
263.1055 -34.0124    8.6  12.5    8.3  -0.1262  -1.3   12.1	GX 354-0
234.0814 -46.5065    2.4  36.5   29.2   0.7977   4.8 ------	UNKNOWN
266.2199  15.8356    0.7  38.2  166.1   2.7808  17.2 ------	UNKNOWN
278.9668  23.5301    2.5  47.1 -177.4   0.9642   4.6 ------	UNKNOWN
295.3630  -9.5797    2.1  29.1 -122.7   0.6990   5.4 ------	UNKNOWN
Post-slew image of 15-350 keV band
Time interval of the image:
128.820600 963.007800

# RAcent  DECcent POSerr Theta    Phi  PeakCts   SNR AngSep     Name
#  [deg]    [deg]    ['] [deg]  [deg]                   [']
244.9916 -15.6474    0.4  37.8   51.8  30.6731  28.7    0.8	Sco X-1
254.6561  35.3116    5.6  22.1  171.3   1.1151   2.1    9.9	Her X-1
263.0144 -24.7138    4.9  40.7   21.6   2.0007   2.4    1.9	GX 1+4
268.2858  -1.5061    3.8  17.4   10.3   1.5486   3.0    5.9	SW J1753.5-0127
270.2843 -25.0790    2.6  41.1   11.5   3.7834   4.5    0.0	GX 5-1
270.3032 -25.7406   76.0  41.8   11.6   0.1324   0.2    0.2	GRS 1758-258
274.0243 -14.0540    1.6  30.9    2.3   4.1933   7.3    1.5	GX 17+2
275.9245 -30.4335   14.5  47.2    5.7  -0.8092  -0.8    4.0	H1820-303
285.1920 -25.0263    0.0  44.8   -7.5  -1.2510  -1.4   10.6	HT1900.1-2455
288.8019  10.9463    0.5  22.5  -63.1  12.7760  22.4    0.2	GRS 1915+105
299.5856  35.2104    0.4  35.5 -112.2  31.0656  31.5    0.6	Cyg X-1
308.1567  40.8736    2.4  44.0 -116.2  10.5864   4.8    5.2	Cyg X-3
262.9071 -33.8328   10.3  49.8   20.8   1.7397   1.1    4.1	GX 354-0
220.4891  48.2250    3.0  49.4  158.2   7.1779   3.8 ------	UNKNOWN
240.5718  21.1704    2.5  24.9  123.5   2.8901   4.6 ------	UNKNOWN
245.9394  13.7884    2.7  19.7  103.9   2.4877   4.3 ------	UNKNOWN
266.2195  15.8682    1.8   0.0 -172.8   3.8639   6.3 ------	UNKNOWN
237.7679  70.2878    3.8  57.2 -173.9  10.0554   3.1 ------	UNKNOWN
287.2001 -13.9407    3.5  36.3  -18.8   1.9586   3.3 ------	UNKNOWN
310.0166 -10.4425    3.8  50.7  -44.5   8.9572   3.0 ------	UNKNOWN
307.9718  44.7094    2.3  45.4 -121.2   9.8880   4.9 ------	UNKNOWN