Analysis Summary
Notes:
- 1) No attempt has been made to eliminate the non-significant decimal places.
- 2) This batgrbproduct analysis is done using the HEASARC data.
- 3) This batgrbproduct analysis is using the flight position for the mask-weighting calculation.
==========================================================================
BAT GROUND-DETECTED GRB DATA PROCESSING REPORT
Process Script: hand-made scripts that follow steps in batgrbproduct
but without using TDRSS info
Process Start Time: Mon Sep 29 23:59:05 EDT 2014
Host Name: bat1
Current Working Dir: /local/data/bat1/alien/Swift_3rdBATcatalog/event/ground_detect_bursts/scripts
==========================================================================
BAT Trigger Time: 292840969.6
UTC: 2010-04-13T08:42:43.897 [includes UTCF correction]
Where From?: Ground analysis (best_duration.txt)
NOTE: BAT trigger time for ground-detected burst is the T100 start time.
Refined Position: [ source = BAT pre-slew image ]
RA: 356.834658171 Dec: 51.2840753744 [deg; J2000]
{ 23h 47m 20.3s , +51d 17' 02.7" }
+/- 1.27347538816 [arcmin] (estimated 90% radius based on SNR)
SNR: 21.5371726297
Angular difference between the analysis and refined position is Usage: arcmin
Partial Coding Fraction: 9.843750e-01 [ including projection effects ]
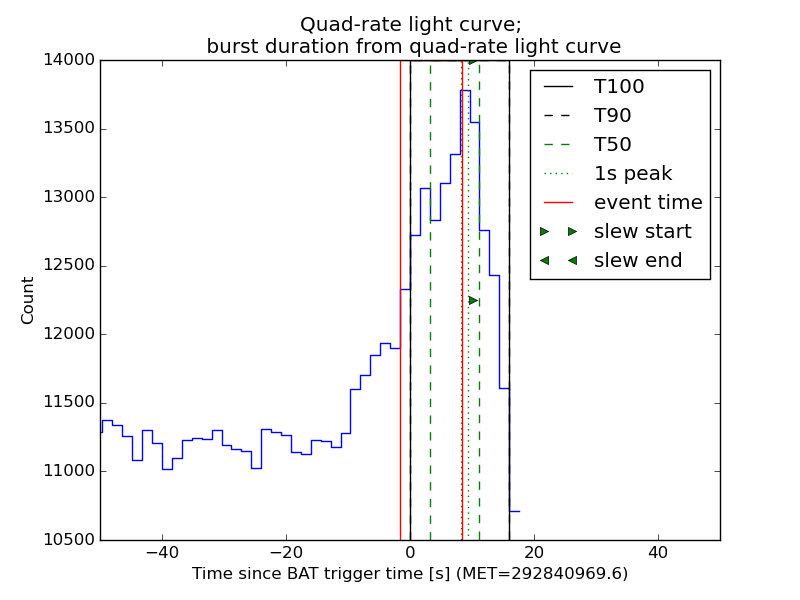
Duration
T90: 16. +/- 1.6
Measured from: 0
to: 16 [s; relative to TRIGTIME]
T50: 8. +/- 1.60000002384186
Measured from: 3.2
to: 11.2 [s; relative to TRIGTIME]
====== Table of the duration information =============================
Value tstart tstop
T100 16.000 0.000 16.000
T90 16.000 0.000 16.000
T50 8.000 3.200 11.200
Peak 1.000 8.300 9.300
====== Spectral Analysis Summary =====================================
Model : spectral model: simple power-law (PL) and cutoff power-law (CPL)
Ph_index : photon index: E^{Ph_index}
Ph_90err : 90% error of the photon index
Epeak : Epeak in keV
Epeak_90err: 90% error of Epeak
Norm : normalization at 50 keV in both the PL model and CPL model
Nomr_90err : 90% error of the normalization
chi2 : Chi-Squared
dof : degree of freedo
=== Time-averaged spectral analysis ===
(Best model with acceptable fit: N/A)
Model Ph_index Ph_90err_low Ph_90err_hi Epeak Epeak_90err_low Epeak_90err_hi Norm Nomr_90err_low Norm_90err_hi chi2 dof
PL -1.271 -0.114 0.115 - - - 5.12e-03 -3.71e-04 3.71e-04 105.230 57
CPL 0.517 -0.619 0.723 69.749 -8.207 13.011 4.05e-02 -2.04e-02 5.14e-02 73.810 56
=== 1-s peak spectral analysis ===
(Best model with acceptable fit: N/A)
Model Ph_index Ph_90err_low Ph_90err_hi Epeak Epeak_90err_low Epeak_90err_hi Norm Nomr_90err_low Norm_90err_hi chi2 dof
PL N/A N/A N/A - - - N/A N/A N/A N/A N/A
CPL N/A N/A N/A N/A N/A N/A N/A N/A N/A N/A N/A
=== Fluence/Peak Flux Summary ===
Model Band1 Band2 Band3 Band4 Band5 Total
15-25 25-50 50-100 100-350 15-150 15-350 keV
Fluence PL 4.46e-08 9.44e-08 1.56e-07 5.89e-07 4.31e-07 8.84e-07 erg/cm2
90%_error_low -5.27e-09 -7.19e-09 -1.40e-08 -1.03e-07 -3.51e-08 -1.15e-07 erg/cm2
90%_error_hi 5.43e-09 7.17e-09 1.39e-08 1.17e-07 3.54e-08 1.27e-07 erg/cm2
Peak flux PL N/A N/A N/A N/A N/A N/A ph/cm2/s
Image
15.0-350.0 keV image (Event data)
#RAcent DECcent POSerr Theta  Phi  Peak_Cts  SNR Name
356.835 51.284 0.009 10.357 -103.733 0.743 21.537 TRIG_00419380

Image time interval: -1.600 to 8.449 [sec]
Light Curves
Note: The mask-weighted lightcurves have units of either count/det or counts/sec/det, where a det is 0.4 x 0.4 = 0.16 sq cm.
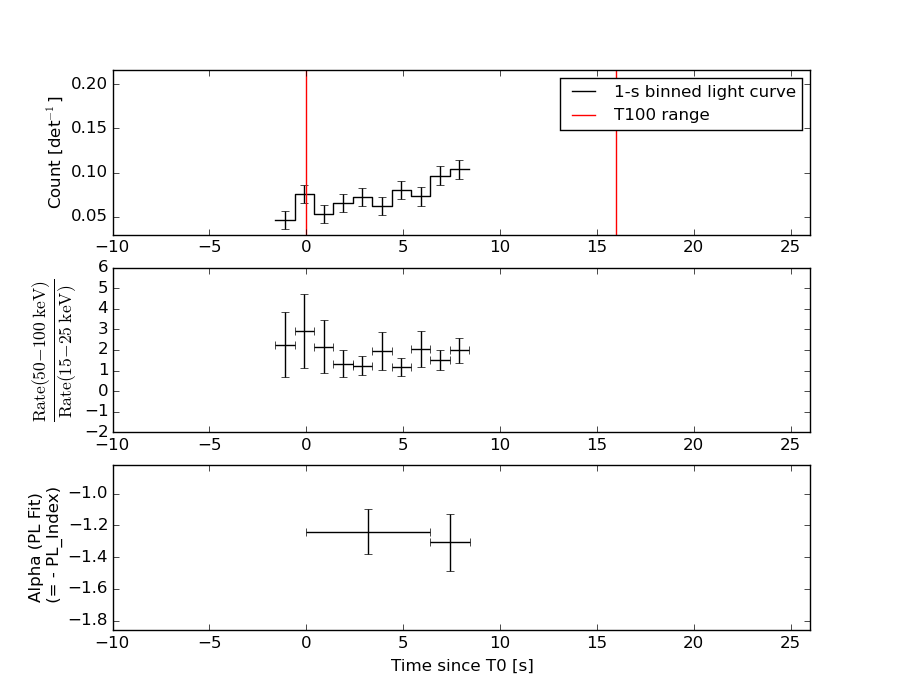
Best duration plot
Full-time range; 1 s binning
Other quick-look light curves:
- 64 ms binning (zoomed)
- 16 ms binning (zoomed)
- 8 ms binning (zoomed)
- 2 ms binning (zoomed)
- SN=5 or 10 s binning (full-time range)
- Raw light curve
Spectra
- 64 ms binning (zoomed)
- 16 ms binning (zoomed)
- 8 ms binning (zoomed)
- 2 ms binning (zoomed)
- SN=5 or 10 s binning (full-time range)
- Raw light curve
Spectra
Notes:
- 1) The fitting includes the systematic errors.
- 2) When the burst includes telescope slew time periods, the fitting uses an average response file made from multiple 5-s response files through out the slew time plus single time preiod for the non-slew times, and weighted by the total counts in the corresponding time period using addrmf. An average response file is needed becuase a spectral fit using the pre-slew DRM will introduce some errors in both a spectral shape and a normalization if the PHA file contains a lot of the slew/post-slew time interval.
- 3) For fits to more complicated models (e.g. a power-law over a cutoff power-law), the BAT team has decided to require a chi-square improvement of more than 6 for each extra dof.
Time averaged spectrum fit using the average DRM
Power-law model
Time interval is from    0.000 sec. to    8.449 sec.

Spectral model in power-law:
------------------------------------------------------------
Parameters  : value       lower 90%   higher 90%
Photon index: -1.27058     ( -0.114513   0.114478 )
Norm@50keV  : 5.12455E-03    ( -0.000371129   0.000370738 )
------------------------------------------------------------
#Fit statistic : Chi-Squared =         105.23 using 59 PHA bins.
# Reduced chi-squared =         1.8461 for     57 degrees of freedom
# Null hypothesis probability =   1.063820e-04

Photon flux (15-150 keV)    in 8.449 sec: 0.608184 ( -0.043921  0.043945 ) ph/cm2/s
Energy fluence (15-150 keV)             : 4.31067e-07 ( -3.50579e-08  3.54046e-08 ) ergs/cm2
Cutoff power-law model
Time interval is from    0.000 sec. to    8.449 sec.
Spectral model in the cutoff power-law:
------------------------------------------------------------
Parameters  : value       lower 90%   higher 90%
Photon index: 0.517053     ( -0.619068   0.722544 )
Epeak [keV] : 69.7494      ( -8.20733 13.0108 )
Norm@50keV  : 4.05456E-02    ( -0.0204283   0.0514489 )
------------------------------------------------------------
#Fit statistic : Chi-Squared =          73.81 using 59 PHA bins.
# Reduced chi-squared =          1.318 for     56 degrees of freedom
# Null hypothesis probability =   5.553517e-02

Photon flux (15-150 keV)    in 8.449 sec: 0.567935 ( -0.045462  0.045602 ) ph/cm2/s
Energy fluence (15-150 keV)             : 3.76483e-07 ( -3.74711e-08  3.87148e-08 ) ergs/cm2
1-s peak spectrum fit
1-s peak spectrum unavailable, likely because there are no event data in the 1-s peak range.
Time-resolved spectra
Distribution
T90 vs. Hardness ratio plot
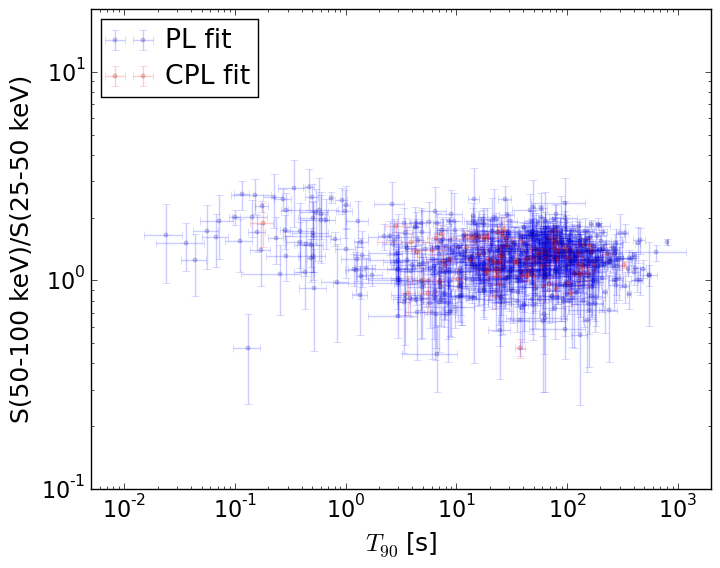
T90                                   = N/A sec.
Hardness ratio (energy fluence ratio) = N/A
S(15-50 keV) vs. S(50-150 keV) plot
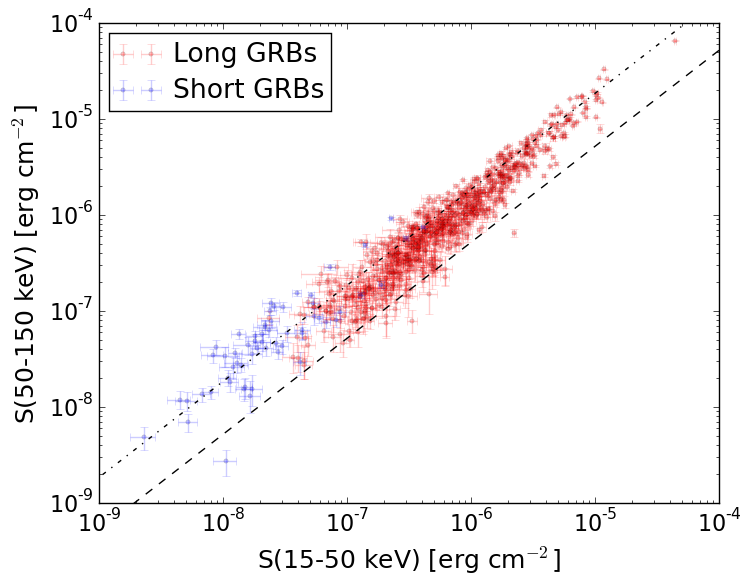
S(15-50 keV)  = N/A
S(50-150 keV) = N/A
The dash-dotted line and the dashed line traces the fluences calculated from the Band function with Epeak = 15 and 150 keV, respectively. Both lines assume a canonical values of alpha = -1 and beta = -2.5.
Mask shadow pattern
IMX = -0.0433855845635, IMY = 0.177535923811
Spacecraft aspect plot
Bright source in the event data image
Event data image of 15-350 keV band
Time interval of the image:
-1.600000 8.449500

# RAcent  DECcent POSerr Theta    Phi  PeakCts   SNR AngSep     Name
#  [deg]    [deg]    ['] [deg]  [deg]                   [']
299.6859  35.0437    6.2  37.6   15.6  -0.0939  -1.9   10.6	Cyg X-1
308.1945  40.9706   10.0  28.8   12.6   0.0474   1.1    4.0	Cyg X-3
326.1227  38.4435    5.3  23.5  -17.2   0.0773   2.2    7.7	Cyg X-2
312.7718  32.5838    2.5  33.7   -2.4   0.2004   4.7 ------	UNKNOWN
356.8347  51.2840    0.5  10.4 -103.7   0.7464  21.6 ------	UNKNOWN
312.9010  12.3270    2.5  52.1  -14.9   0.3841   4.6 ------	UNKNOWN
Webpage updated on:
Sun Jun 21 01:11:24 EDT 2015