Analysis Summary
Notes:
- 1) No attempt has been made to eliminate the non-significant decimal places.
- 2) This batgrbproduct analysis is done using the HEASARC data.
- 3) This batgrbproduct analysis is using the flight position for the mask-weighting calculation.
======================================================================
BAT GRB EVENT DATA PROCESSING REPORT
Process Script Ver: batgrbproduct v2.46
Process Start Time: Fri Jan 17 19:06:59 EST 2014
Host Name: batevent1
Current Working Dir: /local/data/batevent/batevent_reproc/trigger419797
======================================================================
Trigger: 00419797 Segment: 000
BAT Trigger Time: 293317813.76 [s; MET]
Trigger Stop: 293317814.784 [s; MET]
UTC: 2010-04-18T21:10:08.040780 [includes UTCF correction]
Where From?: TDRSS position message
BAT
RA: 256.376042032129 Dec: 11.4640150980648 [deg; J2000]
Catalogged Source?: NO
Point Source?: YES
GRB Indicated?: YES [ by BAT flight software ]
Image S/N Ratio: 7.06
Image Trigger?: NO
Rate S/N Ratio: 8.66025403784439 [ if not an image trigger ]
Image S/N Ratio: 7.06
Analysis Position: [ source = BAT ]
RA: 256.376042032129 Dec: 11.4640150980648 [deg; J2000]
Refined Position: [ source = BAT pre-slew burst ]
RA: 256.358592624736 Dec: 11.4570291293882 [deg; J2000]
{ 17h 05m 26.1s , +11d 27' 25.3" }
+/- 1.95940550751062 [arcmin] (estimated 90% radius based on SNR)
+/- 0.767567668347795 [arcmin] (formal 1-sigma fit error)
SNR: 11.635844707804
Angular difference between the analysis and refined position is 1.108402 arcmin
Partial Coding Fraction: 0.4921875 [ including projection effects ]
Duration
T90: 7.92799997329712 +/- 1.07807980939455
Measured from: -0.375999987125397
to: 7.55199998617172 [s; relative to TRIGTIME]
T50: 4.15199995040894 +/- 1.27208803953934
Measured from: 1.08399999141693
to: 5.23599994182587 [s; relative to TRIGTIME]
Fluence
Peak Flux (peak 1 second)
Measured from: 0.472000002861023
to: 1.47200000286102 [s; relative to TRIGTIME]
Total Fluence
Measured from: -1.11199998855591
to: 8.30400002002716 [s; relative to TRIGTIME]
Band 1 Band 2 Band 3 Band 4
15-25 25-50 50-100 100-350 keV
Total 0.307201 0.228703 0.137078 0.011237
0.029058 0.026546 0.022683 0.019809 [error]
Peak 0.056544 0.038189 0.023681 0.002547
0.009870 0.008797 0.007709 0.006375 [error]
[ fluence units of on-axis counts / fully illuminated detector ]
======================================================================
====== Table of the duration information =============================
Value tstart tstop
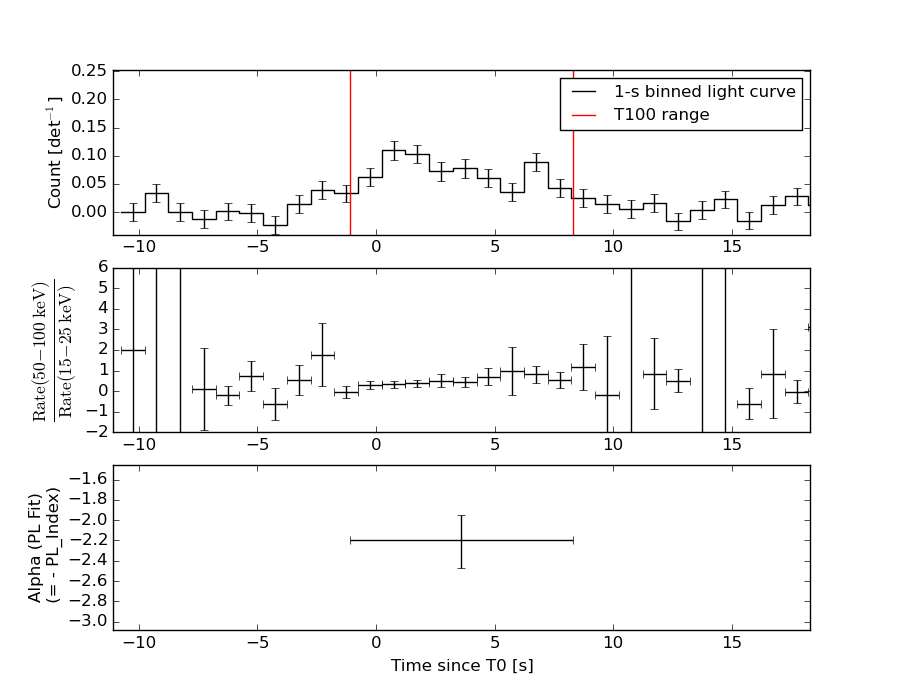
T100 9.416 -1.112 8.304
T90 7.928 -0.376 7.552
T50 4.152 1.084 5.236
Peak 1.000 0.472 1.472
====== Spectral Analysis Summary =====================================
Model : spectral model: simple power-law (PL) and cutoff power-law (CPL)
Ph_index : photon index: E^{Ph_index}
Ph_90err : 90% error of the photon index
Epeak : Epeak in keV
Epeak_90err: 90% error of Epeak
Norm : normalization at 50 keV in both the PL model and CPL model
Nomr_90err : 90% error of the normalization
chi2 : Chi-Squared
dof : degree of freedo
=== Time-averaged spectral analysis ===
(Best model with acceptable fit: PL)
Model Ph_index Ph_90err_low Ph_90err_hi Epeak Epeak_90err_low Epeak_90err_hi Norm Nomr_90err_low Norm_90err_hi chi2 dof
PL -2.195 -0.271 0.251 - - - 3.91e-03 -6.70e-04 6.45e-04 65.280 57
CPL -2.506 -0.429 0.647 187.320 -85.542 -187.320 2.71e-03 -1.56e-03 3.26e-03 64.250 56
=== 1-s peak spectral analysis ===
(Best model with acceptable fit: N/A)
Model Ph_index Ph_90err_low Ph_90err_hi Epeak Epeak_90err_low Epeak_90err_hi Norm Nomr_90err_low Norm_90err_hi chi2 dof
PL -2.661 -0.711 0.547 - - - 4.79e-03 -2.19e-03 2.16e-03 58.060 57
CPL -1.983 -0.016 1.396 1.014 -0.643 23.022 1.20e-02 N/A N/A 59.040 56
=== Fluence/Peak Flux Summary ===
Model Band1 Band2 Band3 Band4 Band5 Total
15-25 25-50 50-100 100-350 15-150 15-350 keV
Fluence PL 9.08e-08 1.10e-07 9.57e-08 1.43e-07 3.46e-07 4.39e-07 erg/cm2
90%_error_low -1.55e-08 -1.33e-08 -2.23e-08 -5.71e-08 -4.93e-08 -8.49e-08 erg/cm2
90%_error_hi 1.59e-08 1.32e-08 2.32e-08 7.91e-08 5.07e-08 1.01e-07 erg/cm2
Peak flux PL 6.10e-01 3.12e-01 9.86e-02 3.99e-02 1.04e+00 1.06e+00 ph/cm2/s
90%_error_low -1.77e-01 -9.09e-02 -5.40e-02 -3.99e-02 -2.35e-01 -2.40e-01 ph/cm2/s
90%_error_hi 1.81e-01 8.24e-02 6.45e-02 6.22e-02 2.35e-01 2.41e-01 ph/cm2/s
Fluence CPL N/A N/A N/A N/A N/A N/A erg/cm2
90%_error_low -1.55e-08 -1.33e-08 -2.23e-08 -5.71e-08 -4.93e-08 -8.49e-08 erg/cm2
90%_error_hi 1.59e-08 1.32e-08 2.32e-08 7.91e-08 5.07e-08 1.01e-07 erg/cm2
Peak flux CPL N/A N/A N/A N/A N/A N/A ph/cm2/s
90%_error_low -1.77e-01 -9.09e-02 -5.40e-02 -3.99e-02 -2.35e-01 -2.40e-01 ph/cm2/s
90%_error_hi 1.81e-01 8.24e-02 6.45e-02 6.22e-02 2.35e-01 2.41e-01 ph/cm2/s
======================================================================
Image
Pre-slew 15.0-350.0 keV image (Event data)
#   RAcent    DECcent   POSerr    Theta     Phi              Peak Cts       SNR   Name
  256.3586    11.4570   0.0165    29.7056   133.9319         0.7266462     11.636 TRIG_00419797

Foreground time interval of the image:
 -1.112   8.304 (delta_t =   9.416 [sec])
Background time interval of the image:
-17.459  -1.112 (delta_t =  16.347 [sec])
Light Curves
Note: The mask-weighted lightcurves have units of either count/det or counts/sec/det, where a det is 0.4 x 0.4 = 0.16 sq cm.
Full-time range; 1 s binning
Other quick-look light curves:
- 64 ms binning (zoomed)
- 16 ms binning (zoomed)
- 8 ms binning (zoomed)
- 2 ms binning (zoomed)
- SN=5 or 10 s binning (full-time range)
- Raw light curve
Spectra
- 64 ms binning (zoomed)
- 16 ms binning (zoomed)
- 8 ms binning (zoomed)
- 2 ms binning (zoomed)
- SN=5 or 10 s binning (full-time range)
- Raw light curve
Spectra
Notes:
- 1) The fitting includes the systematic errors.
- 2) When the burst includes telescope slew time periods, the fitting uses an average response file made from multiple 5-s response files through out the slew time plus single time preiod for the non-slew times, and weighted by the total counts in the corresponding time period using addrmf. An average response file is needed becuase a spectral fit using the pre-slew DRM will introduce some errors in both a spectral shape and a normalization if the PHA file contains a lot of the slew/post-slew time interval.
- 3) For fits to more complicated models (e.g. a power-law over a cutoff power-law), the BAT team has decided to require a chi-square improvement of more than 6 for each extra dof.
Time averaged spectrum fit using the average DRM
Power-law model
Time interval is from   -1.112 sec. to    8.304 sec.

Spectral model in power-law:
------------------------------------------------------------
Parameters  : value       lower 90%   higher 90%
Photon index: -2.19543     ( -0.271075   0.25147 )
Norm@50keV  : 3.91453E-03    ( -0.000670416   0.000644936 )
------------------------------------------------------------
#Fit statistic : Chi-Squared =          65.28 using 59 PHA bins.
# Reduced chi-squared =          1.145 for     57 degrees of freedom
# Null hypothesis probability =   2.110903e-01

Photon flux (15-150 keV)    in 9.416 sec: 0.646572 ( -0.076813  0.076917 ) ph/cm2/s
Energy fluence (15-150 keV)             : 3.46399e-07 ( -4.93439e-08  5.07257e-08 ) ergs/cm2
Cutoff power-law model
Time interval is from   -1.112 sec. to    8.304 sec.
Spectral model in the cutoff power-law:
------------------------------------------------------------
Parameters  : value       lower 90%   higher 90%
Photon index: -2.63018     ( -0.307548   0.76834 )
Epeak [keV] : 220.821      ( -117.787 -219.565 )
Norm@50keV  : 2.40284E-03    ( -0.00126634   0.00355428 )
------------------------------------------------------------
#Fit statistic : Chi-Squared =          64.18 using 59 PHA bins.
# Reduced chi-squared =          1.146 for     56 degrees of freedom
# Null hypothesis probability =   2.118177e-01

Photon flux (15-150 keV)    in 9.416 sec: 0.562666 ( -0.132766  0.150187 ) ph/cm2/s
Energy fluence (15-150 keV)             : 0 ( 0  0 ) ergs/cm2
1-s peak spectrum fit
Power-law model
Time interval is from    0.472 sec. to    1.472 sec.

Spectral model in power-law:
------------------------------------------------------------
Parameters  : value       lower 90%   higher 90%
Photon index: -2.66135     ( -0.711114   0.546742 )
Norm@50keV  : 4.78988E-03    ( -0.00218985   0.00215965 )
------------------------------------------------------------
#Fit statistic : Chi-Squared =          58.06 using 59 PHA bins.
# Reduced chi-squared =          1.019 for     57 degrees of freedom
# Null hypothesis probability =   4.361510e-01

Photon flux (15-150 keV)    in 1 sec: 1.04235 ( -0.234943  0.23498 ) ph/cm2/s
Energy fluence (15-150 keV)             : 5.03002e-08 ( -1.45079e-08  1.57646e-08 ) ergs/cm2
Cutoff power-law model
Time interval is from    0.472 sec. to    1.472 sec.
Spectral model in the cutoff power-law:
------------------------------------------------------------
Parameters  : value       lower 90%   higher 90%
Photon index: -1.98286     ( -0.0162167   1.39642 )
Epeak [keV] : 1.01368      ( -0.641846 23.023 )
Norm@50keV  : 1.20123E-02    (     )
------------------------------------------------------------
#Fit statistic : Chi-Squared =          59.04 using 59 PHA bins.
# Reduced chi-squared =          1.054 for     56 degrees of freedom
# Null hypothesis probability =   3.649654e-01

Photon flux (15-150 keV)    in 1 sec:  (    ) ph/cm2/s
Energy fluence (15-150 keV)             : 0 ( 0  0 ) ergs/cm2
Time-resolved spectra
Distribution
T90 vs. Hardness ratio plot
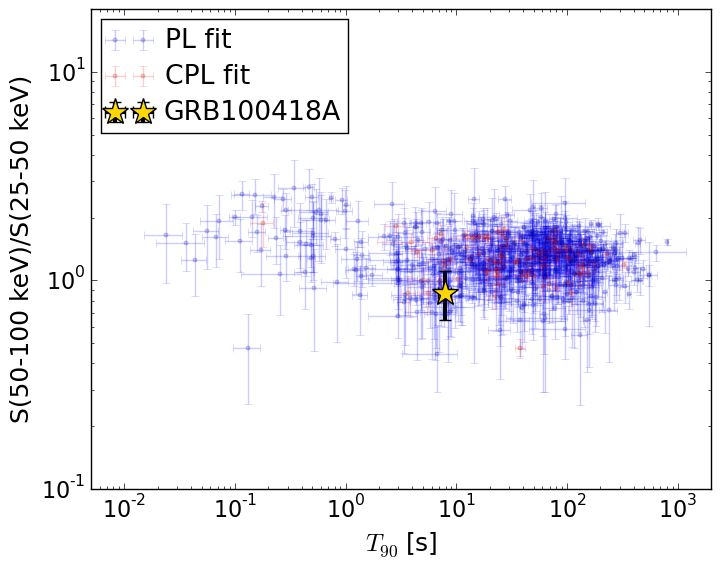
T90                                   = 7.928 sec.
Hardness ratio (energy fluence ratio) = 0.873352555797
S(15-50 keV) vs. S(50-150 keV) plot
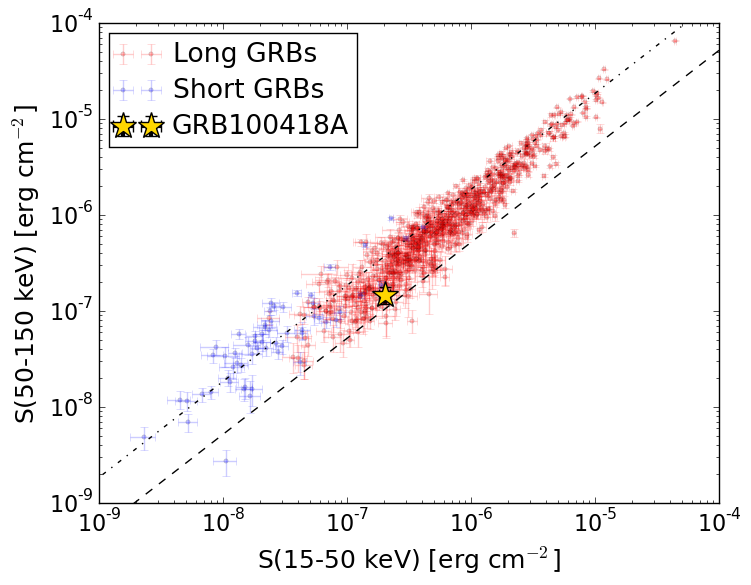
S(15-50 keV)  = 2.0042131e-07
S(50-150 keV) = 1.4597582e-07
The dash-dotted line and the dashed line traces the fluences calculated from the Band function with Epeak = 15 and 150 keV, respectively. Both lines assume a canonical values of alpha = -1 and beta = -2.5.
Mask shadow pattern
IMX = -3.958289840619809E-01, IMY = -4.108687631825915E-01
Spacecraft aspect plot
Bright source in the pre-burst/pre-slew/post-slew images
Pre-burst image of 15-350 keV band
Time interval of the image:
-17.459400 -1.112000

# RAcent  DECcent POSerr Theta    Phi  PeakCts   SNR AngSep     Name
#  [deg]    [deg]    ['] [deg]  [deg]                   [']
244.9849 -15.6577    0.9  33.5   76.5   1.2104  13.1    1.1	Sco X-1
254.3200  35.2362   16.1  49.3  155.9   0.1080   0.7    9.3	Her X-1
255.8166 -37.9569    9.3  35.8   33.3   0.0953   1.2   10.5	4U 1700-377
256.5999 -36.4397   64.8  34.3   34.2   0.0130   0.2    8.0	GX 349+2
262.9295 -24.7011    4.9  21.9   42.7   0.1177   2.3    5.1	GX 1+4
264.5722 -44.4924   19.1  37.9   18.2   0.0413   0.6    7.7	4U 1735-44
268.5154  -1.3001    0.0  12.3  127.6   0.0443   1.1   12.7	SW J1753.5-0127
270.4428 -25.0653    9.0  18.2   25.9  -0.0599  -1.3    8.7	GX 5-1
270.3965 -25.8940   12.9  19.0   24.8   0.0418   0.9   10.4	GRS 1758-258
274.1569 -13.9176    2.2   6.8   39.7   0.2190   5.2   11.3	GX 17+2
275.9880 -30.4728    5.0  22.1    7.7   0.1053   2.3    7.1	H1820-303
285.1457 -25.0621    4.4  17.7  -18.3   0.1083   2.6   10.4	HT1900.1-2455
288.8671  11.0037    2.1  22.1 -149.9   0.2430   5.7    5.3	GRS 1915+105
299.5940  35.2004    1.8  48.1 -154.7   0.5782   6.3    0.2	Cyg X-1
308.1453  40.9164    5.6  56.5 -151.3   0.4495   2.1    2.7	Cyg X-3
263.1047 -33.9931    7.1  29.1   28.8   0.0892   1.6   11.1	GX 354-0
263.7635  20.9928    2.5  32.9  156.1   0.2597   4.6 ------	UNKNOWN
278.3337  16.9159    2.3  25.4 -178.3   0.2371   5.1 ------	UNKNOWN
315.7735  23.1387    2.2  48.3 -129.7   1.0115   5.2 ------	UNKNOWN
Pre-slew background subtracted image of 15-350 keV band
Time interval of the image:
-1.112000 8.304000

# RAcent  DECcent POSerr Theta    Phi  PeakCts   SNR AngSep     Name
#  [deg]    [deg]    ['] [deg]  [deg]                   [']
245.0418 -15.5712   13.7  33.4   76.6  -0.0723  -0.8    5.5	Sco X-1
254.4096  35.2770   41.9  49.3  156.0  -0.0403  -0.3    4.6	Her X-1
256.1096 -37.9324   10.0  35.7   33.0   0.0797   1.2    7.9	4U 1700-377
256.4148 -36.4091  265.6  34.3   34.4   0.0030   0.0    1.3	GX 349+2
262.9823 -24.6457    6.7  21.9   42.7  -0.0785  -1.7    6.2	GX 1+4
264.7741 -44.6019   40.2  38.0   17.9   0.0188   0.3    9.2	4U 1735-44
268.3873  -1.4360  307.8  12.3  126.7  -0.0016  -0.0    1.5	SW J1753.5-0127
270.4446 -25.1742   13.6  18.3   25.7   0.0371   0.8   10.4	GX 5-1
270.4637 -25.8655   15.8  18.9   24.7  -0.0317  -0.7   11.4	GRS 1758-258
274.1566 -13.9064    3.0   6.8   39.7  -0.1537  -3.8   11.7	GX 17+2
275.7618 -30.3182   18.3  21.9    8.3  -0.0273  -0.6    8.9	H1820-303
285.1993 -24.9974    5.0  17.7  -18.5  -0.0945  -2.3   10.0	HT1900.1-2455
288.6921  10.8675   14.6  21.9 -150.1   0.0325   0.8    7.8	GRS 1915+105
299.4683  35.0977    4.4  47.9 -154.7   0.2231   2.7    8.6	Cyg X-1
308.0950  40.8934    5.8  56.4 -151.3   0.4158   2.0    3.6	Cyg X-3
263.0219 -33.7538   11.8  29.0   29.2   0.0508   1.0    5.1	GX 354-0
256.3586  11.4570    1.0  29.7  133.9   0.7267  11.6 ------	UNKNOWN
295.9000  -1.4113    2.0  18.8 -109.3   0.2589   5.8 ------	UNKNOWN
305.1138 -39.3903    2.5  39.0  -31.4   0.2858   4.6 ------	UNKNOWN
320.9137 -39.4412    2.5  48.9  -41.8   0.5852   4.7 ------	UNKNOWN
Post-slew image of 15-350 keV band
Time interval of the image:
67.740590 962.295100

# RAcent  DECcent POSerr Theta    Phi  PeakCts   SNR AngSep     Name
#  [deg]    [deg]    ['] [deg]  [deg]                   [']
244.9822 -15.6365    0.2  29.4   45.8  53.1814  54.1    0.3	Sco X-1
254.3975  35.2314    9.1  23.8 -161.2   0.9401   1.3    7.3	Her X-1
256.0028 -37.8244    7.9  49.3   23.4   3.3957   1.5    1.4	4U 1700-377
256.5794 -36.4016    5.4  47.9   22.8  -3.9905  -2.1    7.1	GX 349+2
262.8243 -24.6837   56.2  36.7   13.2   0.1965   0.2   10.7	GX 1+4
268.3195  -1.4074    2.3  17.5  -20.4   3.2424   4.9    4.0	SW J1753.5-0127
270.3145 -25.0801    3.9  39.0    2.7   3.1599   2.9    1.6	GX 5-1
270.3199 -25.6716   10.7  39.5    3.0   1.1327   1.1    4.4	GRS 1758-258
274.0051 -14.0201    1.4  30.9  -11.9   5.9976   8.2    1.0	GX 17+2
275.8336 -30.4062    6.0  45.8   -0.6   2.5059   1.9    5.3	H1820-303
285.1197 -24.9843    4.8  45.9  -14.3   2.9808   2.4    5.9	HT1900.1-2455
288.8358  10.9077    1.7  31.8  -69.3   7.2092   6.6    3.2	GRS 1915+105
262.8090 -33.7479    5.9  45.6   15.5  -2.7855  -1.9   10.4	GX 354-0
257.9064 -23.6681    2.0  35.2   20.6   5.3260   5.7 ------	UNKNOWN
239.7866  28.2441    3.8  22.9  162.5   2.1425   3.0 ------	UNKNOWN
271.1211 -30.4869    2.5  44.3    4.7   4.9844   4.7 ------	UNKNOWN
216.7781  56.1585    6.7  54.2  176.9   5.2393   1.7 ------	UNKNOWN
285.8643  52.1060    3.8  47.1 -132.7   7.1055   3.0 ------	UNKNOWN
302.8758  -9.5251    3.7  50.7  -44.5  13.1273   3.1 ------	UNKNOWN
288.7057  53.8517    2.9  49.5 -132.6  15.6564   4.0 ------	UNKNOWN