Analysis Summary
Notes:
- 1) No attempt has been made to eliminate the non-significant decimal places.
- 2) This batgrbproduct analysis is done using the HEASARC data.
- 3) This batgrbproduct analysis is using the flight position for the mask-weighting calculation.
======================================================================
BAT GRB EVENT DATA PROCESSING REPORT
Process Script Ver: batgrbproduct v2.46
Process Start Time: Fri Jan 17 19:03:22 EST 2014
Host Name: batevent1
Current Working Dir: /local/data/batevent/batevent_reproc/trigger419932
======================================================================
Trigger: 00419932 Segment: 000
BAT Trigger Time: 293433768 [s; MET]
Trigger Stop: 293433832 [s; MET]
UTC: 2010-04-20T05:22:42.276700 [includes UTCF correction]
Where From?: TDRSS position message
BAT
RA: 296.127555899969 Dec: 55.7926334166084 [deg; J2000]
Catalogged Source?: NO
Point Source?: YES
GRB Indicated?: YES [ by BAT flight software ]
Image S/N Ratio: 7.37
Image Trigger?: YES
Rate S/N Ratio: 0 [ if not an image trigger ]
Image S/N Ratio: 7.37
Analysis Position: [ source = BAT ]
RA: 296.127555899969 Dec: 55.7926334166084 [deg; J2000]
Refined Position: [ source = BAT pre-slew burst ]
RA: 296.128 Dec: 55.7926 [deg; J2000]
{ 19h 44m 30.7s , +55d 47' 33.4" }
+/- 3.14154316885 [arcmin] (estimated 90% radius based on SNR)
SNR: 5.92885551004
Angular difference between the analysis and refined position is 0.015114 arcmin
Partial Coding Fraction: 0.921875 [ including projection effects ]
Duration
T90: 62.9799999594688 +/- 17.5188230435795
Measured from: 1.19599997997284
to: 64.1759999394417 [s; relative to TRIGTIME]
T50: 21.1039999723434 +/- 22.4090186393284
Measured from: 18.4359999895096
to: 39.539999961853 [s; relative to TRIGTIME]
Fluence
Peak Flux (peak 1 second)
Measured from: 28.7039999961853
to: 29.7039999961853 [s; relative to TRIGTIME]
Total Fluence
Measured from: -0.73199999332428
to: 68.6200000047684 [s; relative to TRIGTIME]
Band 1 Band 2 Band 3 Band 4
15-25 25-50 50-100 100-350 keV
Total 0.182974 0.315075 0.216286 0.062287
0.046787 0.048817 0.044393 0.042727 [error]
Peak 0.011170 0.015803 0.006688 0.010382
0.005703 0.005806 0.005266 0.005164 [error]
[ fluence units of on-axis counts / fully illuminated detector ]
======================================================================
====== Table of the duration information =============================
Value tstart tstop
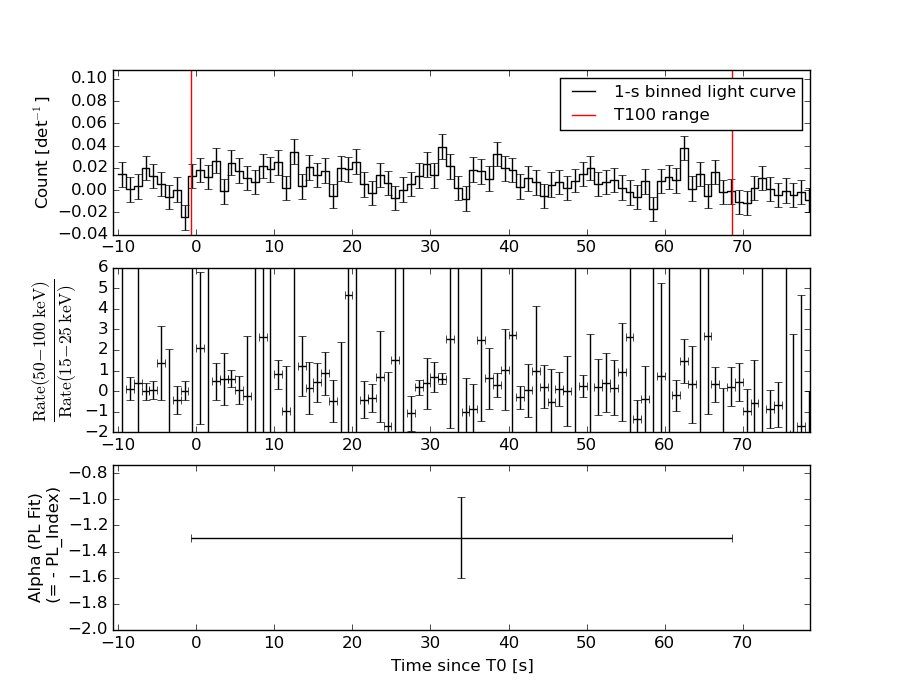
T100 69.352 -0.732 68.620
T90 62.980 1.196 64.176
T50 21.104 18.436 39.540
Peak 1.000 28.704 29.704
====== Spectral Analysis Summary =====================================
Model : spectral model: simple power-law (PL) and cutoff power-law (CPL)
Ph_index : photon index: E^{Ph_index}
Ph_90err : 90% error of the photon index
Epeak : Epeak in keV
Epeak_90err: 90% error of Epeak
Norm : normalization at 50 keV in both the PL model and CPL model
Nomr_90err : 90% error of the normalization
chi2 : Chi-Squared
dof : degree of freedo
=== Time-averaged spectral analysis ===
(Best model with acceptable fit: PL)
Model Ph_index Ph_90err_low Ph_90err_hi Epeak Epeak_90err_low Epeak_90err_hi Norm Nomr_90err_low Norm_90err_hi chi2 dof
PL -1.294 -0.308 0.310 - - - 7.23e-04 -1.34e-04 1.34e-04 54.460 57
CPL -0.243 -1.181 1.988 79.420 -24.776 -79.420 2.57e-03 -2.57e-03 2.63e-02 52.680 56
=== 1-s peak spectral analysis ===
(Best model with acceptable fit: N/A)
Model Ph_index Ph_90err_low Ph_90err_hi Epeak Epeak_90err_low Epeak_90err_hi Norm Nomr_90err_low Norm_90err_hi chi2 dof
PL -1.286 -1.108 1.286 - - - 2.33e-03 -1.22e-03 1.09e-03 55.300 57
CPL -1.376 1.376 1.390 9999.350 N/A N/A 2.25e-03 N/A N/A 55.330 56
=== Fluence/Peak Flux Summary ===
Model Band1 Band2 Band3 Band4 Band5 Total
15-25 25-50 50-100 100-350 15-150 15-350 keV
Fluence PL 5.28e-08 1.10e-07 1.80e-07 6.59e-07 4.96e-07 1.00e-06 erg/cm2
90%_error_low -1.57e-08 -2.14e-08 -4.19e-08 -2.75e-07 -1.03e-07 -3.16e-07 erg/cm2
90%_error_hi 1.69e-08 2.11e-08 4.19e-08 3.92e-07 1.06e-07 4.16e-07 erg/cm2
Peak flux PL 7.79e-02 8.91e-02 7.32e-02 1.01e-01 2.77e-01 3.41e-01 ph/cm2/s
90%_error_low -7.79e-02 -8.91e-02 -7.32e-02 -1.01e-01 -2.77e-01 -1.66e-01 ph/cm2/s
90%_error_hi 8.20e-02 4.60e-02 4.46e-02 4.97e-01 1.31e-01 1.06e+00 ph/cm2/s
Fluence CPL 4.55e-08 1.23e-07 1.85e-07 1.56e-07 4.45e-07 5.09e-07 erg/cm2
90%_error_low -1.84e-08 -2.75e-08 -5.19e-08 -1.32e-07 -1.18e-07 -1.78e-07 erg/cm2
90%_error_hi 1.94e-08 3.03e-08 4.84e-08 1.12e-06 1.24e-07 6.36e-07 erg/cm2
Peak flux CPL 8.57e-02 8.95e-02 7.22e-02 9.66e-02 2.82e-01 3.44e-01 ph/cm2/s
90%_error_low N/A -8.95e-02 N/A N/A -2.82e-01 -1.75e-01 ph/cm2/s
90%_error_hi N/A 4.72e-02 N/A N/A 1.27e-01 3.52e-01 ph/cm2/s
======================================================================
Image
Pre-slew 15.0-50.0 keV image (Event data)
#RAcent DECcent POSerr Theta  Phi  Peak_Cts  SNR Name
296.128 55.793 0.000 15.787 140.560 0.412 5.929 TRIG_00419932

Image time interval: 0.000 to 64.000 [sec]
Light Curves
Note: The mask-weighted lightcurves have units of either count/det or counts/sec/det, where a det is 0.4 x 0.4 = 0.16 sq cm.
Full-time range; 1 s binning
Other quick-look light curves:
- 64 ms binning (zoomed)
- 16 ms binning (zoomed)
- 8 ms binning (zoomed)
- 2 ms binning (zoomed)
- SN=5 or 10 s binning (full-time range)
- Raw light curve
Spectra
- 64 ms binning (zoomed)
- 16 ms binning (zoomed)
- 8 ms binning (zoomed)
- 2 ms binning (zoomed)
- SN=5 or 10 s binning (full-time range)
- Raw light curve
Spectra
Notes:
- 1) The fitting includes the systematic errors.
- 2) When the burst includes telescope slew time periods, the fitting uses an average response file made from multiple 5-s response files through out the slew time plus single time preiod for the non-slew times, and weighted by the total counts in the corresponding time period using addrmf. An average response file is needed becuase a spectral fit using the pre-slew DRM will introduce some errors in both a spectral shape and a normalization if the PHA file contains a lot of the slew/post-slew time interval.
- 3) For fits to more complicated models (e.g. a power-law over a cutoff power-law), the BAT team has decided to require a chi-square improvement of more than 6 for each extra dof.
Time averaged spectrum fit using the average DRM
Power-law model
Time interval is from   -0.732 sec. to   68.620 sec.

Spectral model in power-law:
------------------------------------------------------------
Parameters  : value       lower 90%   higher 90%
Photon index: -1.29427     ( -0.307848   0.310503 )
Norm@50keV  : 7.22951E-04    ( -0.000134164   0.000133511 )
------------------------------------------------------------
#Fit statistic : Chi-Squared =          54.46 using 59 PHA bins.
# Reduced chi-squared =         0.9555 for     57 degrees of freedom
# Null hypothesis probability =   5.708099e-01

Photon flux (15-150 keV)    in 69.35 sec: 8.61608E-02 ( -0.0158025  0.0158202 ) ph/cm2/s
Energy fluence (15-150 keV)             : 4.96188e-07 ( -1.03465e-07  1.06075e-07 ) ergs/cm2
Cutoff power-law model
Time interval is from   -0.732 sec. to   68.620 sec.
Spectral model in the cutoff power-law:
------------------------------------------------------------
Parameters  : value       lower 90%   higher 90%
Photon index: -0.242954     ( -1.18139   1.98773 )
Epeak [keV] : 79.4204      ( -24.7748 -79.4197 )
Norm@50keV  : 2.56994E-03    ( -0.00257   0.0262701 )
------------------------------------------------------------
#Fit statistic : Chi-Squared =          52.68 using 59 PHA bins.
# Reduced chi-squared =         0.9407 for     56 degrees of freedom
# Null hypothesis probability =   6.013054e-01

Photon flux (15-150 keV)    in 69.35 sec: 8.23135E-02 ( -0.016668  0.0166114 ) ph/cm2/s
Energy fluence (15-150 keV)             : 4.45416e-07 ( -1.18146e-07  1.24402e-07 ) ergs/cm2
1-s peak spectrum fit
Power-law model
Time interval is from   28.704 sec. to   29.704 sec.

Spectral model in power-law:
------------------------------------------------------------
Parameters  : value       lower 90%   higher 90%
Photon index: -1.28629     ( -1.10884   1.28514 )
Norm@50keV  : 2.32584E-03    ( -0.00121587   0.00109259 )
------------------------------------------------------------
#Fit statistic : Chi-Squared =          55.30 using 59 PHA bins.
# Reduced chi-squared =         0.9702 for     57 degrees of freedom
# Null hypothesis probability =   5.391155e-01

Photon flux (15-150 keV)    in 1 sec: 0.276749 ( -0.276749  0.130883 ) ph/cm2/s
Energy fluence (15-150 keV)             : 2.30786e-08 ( -1.27255e-08  1.40561e-08 ) ergs/cm2
Cutoff power-law model
Time interval is from   28.704 sec. to   29.704 sec.
Spectral model in the cutoff power-law:
------------------------------------------------------------
Parameters  : value       lower 90%   higher 90%
Photon index: -2.42708     ( 2.42732   2.44213 )
Epeak [keV] : 141.217      (   )
Norm@50keV  : 5.54743E-04    (     )
------------------------------------------------------------
#Fit statistic : Chi-Squared =          54.42 using 59 PHA bins.
# Reduced chi-squared =         0.9718 for     56 degrees of freedom
# Null hypothesis probability =   5.347755e-01

Photon flux (15-150 keV)    in 1 sec: 0.282165 ( -0.282165  0.127032 ) ph/cm2/s
Energy fluence (15-150 keV)             : 2.22065e-08 ( 0  0 ) ergs/cm2
Time-resolved spectra
Distribution
T90 vs. Hardness ratio plot
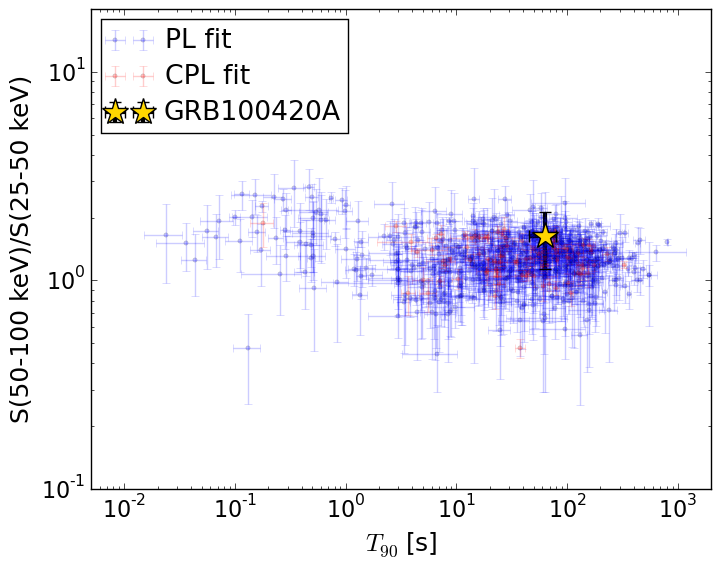
T90                                   = 62.98 sec.
Hardness ratio (energy fluence ratio) = 1.63094767688
S(15-50 keV) vs. S(50-150 keV) plot
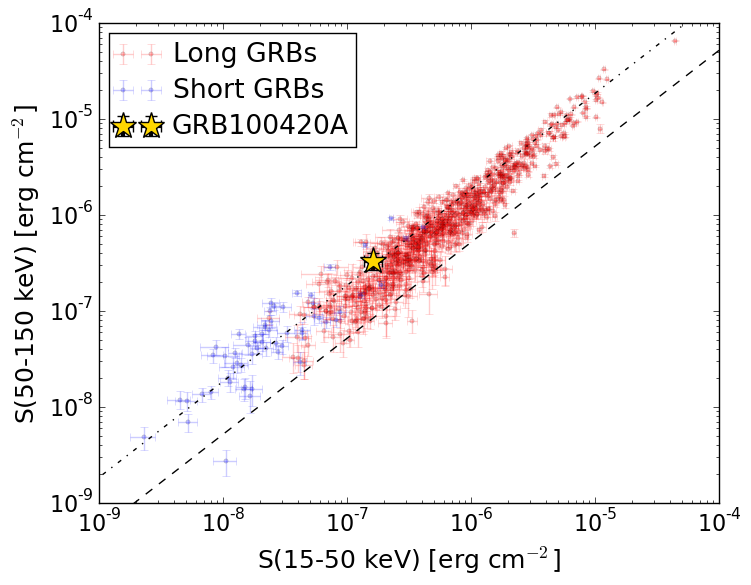
S(15-50 keV)  = 1.62902e-07
S(50-150 keV) = 3.332932e-07
The dash-dotted line and the dashed line traces the fluences calculated from the Band function with Epeak = 15 and 150 keV, respectively. Both lines assume a canonical values of alpha = -1 and beta = -2.5.
Mask shadow pattern
IMX = -0.218346559425, IMY = -0.179608973732
Spacecraft aspect plot
Bright source in the pre-burst/pre-slew/post-slew images
Pre-burst image of 15-350 keV band
Time interval of the image:
-6.299410 -0.732000

# RAcent  DECcent POSerr Theta    Phi  PeakCts   SNR AngSep     Name
#  [deg]    [deg]    ['] [deg]  [deg]                   [']
288.9984  10.8441    0.0  41.6   45.5   0.0681   0.9   13.3	GRS 1915+105
299.5766  35.1854    1.3  16.1   58.5   0.2391   8.6    1.2	Cyg X-1
308.0779  40.8899   12.2   7.3   54.9  -0.0237  -0.9    4.0	Cyg X-3
326.1783  38.3156   29.6  10.8  -46.2  -0.0099  -0.4    0.5	Cyg X-2
322.1166   0.5180    2.2  45.6   -5.1   0.2512   5.2 ------	UNKNOWN
 34.0450  62.3201    2.3  45.6 -136.3   0.3236   5.0 ------	UNKNOWN
 23.6457  50.6970    2.4  44.0 -118.1   0.5072   4.9 ------	UNKNOWN
Pre-slew background subtracted image of 15-350 keV band
Time interval of the image:
-0.732000 68.620000

# RAcent  DECcent POSerr Theta    Phi  PeakCts   SNR AngSep     Name
#  [deg]    [deg]    ['] [deg]  [deg]                   [']
288.6752  10.8901    3.3  41.7   46.0   3.3438   3.5    8.0	GRS 1915+105
299.7831  35.1235    6.1  16.0   58.0  -0.6648  -1.9   10.6	Cyg X-1
308.0630  40.9399    6.5   7.3   55.4   0.5809   1.8    2.3	Cyg X-3
326.1860  38.2520    7.7  10.9  -45.9   0.4867   1.5    4.2	Cyg X-2
329.7998 -10.4438    2.3  57.6  -12.5   9.0438   5.0 ------	UNKNOWN
  7.4629  46.3679    2.2  35.3 -106.1   3.2337   5.1 ------	UNKNOWN
Post-slew image of 15-350 keV band
Time interval of the image:
114.100580 963.022800

# RAcent  DECcent POSerr Theta    Phi  PeakCts   SNR AngSep     Name
#  [deg]    [deg]    ['] [deg]  [deg]                   [']
254.5871  35.2667    5.5  34.8   79.8  -2.8185  -2.1    7.8	Her X-1
288.7841  10.9534    1.8  45.2   18.4   7.5305   6.6    1.0	GRS 1915+105
299.5900  35.2031    0.2  20.7    0.2  33.2225  61.0    0.1	Cyg X-1
308.1213  40.9479    1.2  16.8  -24.7   4.8930   9.2    0.6	Cyg X-3
326.2448  38.3483    5.8  26.6  -53.5   1.3666   2.0    3.8	Cyg X-2
166.8529  63.6758    2.8  54.3  163.2  13.1281   4.1 ------	UNKNOWN
201.9846  68.1374    2.5  41.2  153.9   5.4507   4.5 ------	UNKNOWN
253.6127  68.0588    2.5  22.8  147.5   2.8708   4.7 ------	UNKNOWN
139.0470  65.8395    3.0  57.1  177.3  15.2692   3.8 ------	UNKNOWN
300.9364   0.6554    2.2  55.3    2.3  11.2965   5.2 ------	UNKNOWN
307.3559  -0.2596    3.4  56.8   -5.3   8.5895   3.4 ------	UNKNOWN
329.3153  30.3932    3.0  34.5  -48.3   2.7917   3.8 ------	UNKNOWN
322.9771   5.6850    2.5  54.5  -25.3   8.6641   4.6 ------	UNKNOWN
331.1490  15.4162    2.7  48.4  -39.5   7.4339   4.4 ------	UNKNOWN
339.6713  21.5179    3.1  47.0  -53.1  10.4325   3.7 ------	UNKNOWN
  3.3343  46.9703    4.2  41.1  -98.8   9.1843   2.8 ------	UNKNOWN