Analysis Summary
Notes:
- 1) No attempt has been made to eliminate the non-significant decimal places.
- 2) This batgrbproduct analysis is done using the HEASARC data.
- 3) This batgrbproduct analysis is using the flight position for the mask-weighting calculation.
======================================================================
BAT GRB EVENT DATA PROCESSING REPORT
Process Script Ver: batgrbproduct v2.46
Process Start Time: Thu Sep 11 11:42:49 EDT 2014
Host Name: batevent1
Current Working Dir: /local/data/batevent/batevent_reproc/trigger420247
======================================================================
Trigger: 00420247 Segment: 000
BAT Trigger Time: 293675704.896 [s; MET]
Trigger Stop: 293675705.92 [s; MET]
UTC: 2010-04-23T00:34:59.164220 [includes UTCF correction]
Where From?: TDRSS position message
BAT
RA: 136.477016071933 Dec: 21.4794761790139 [deg; J2000]
Catalogged Source?: NO
Point Source?: YES
GRB Indicated?: YES [ by BAT flight software ]
Image S/N Ratio: 21.49
Image Trigger?: NO
Rate S/N Ratio: 116.228223766863 [ if not an image trigger ]
Image S/N Ratio: 21.49
Analysis Position: [ source = BAT ]
RA: 136.477016071933 Dec: 21.4794761790139 [deg; J2000]
Refined Position: [ source = BAT pre-slew burst ]
RA: 136.472342171038 Dec: 21.4826479030353 [deg; J2000]
{ 09h 05m 53.4s , +21d 28' 57.5" }
+/- 0.61797808747846 [arcmin] (estimated 90% radius based on SNR)
+/- 0.21655965168157 [arcmin] (formal 1-sigma fit error)
SNR: 60.4962244695789
Angular difference between the analysis and refined position is 0.322975 arcmin
Partial Coding Fraction: 0.7421875 [ including projection effects ]
Duration
T90: 78.8679999709129 +/- 4.15788408231418
Measured from: 0.12799996137619
to: 78.9959999322891 [s; relative to TRIGTIME]
T50: 39.2599999904633 +/- 2.26823990358931
Measured from: 4.06399995088577
to: 43.323999941349 [s; relative to TRIGTIME]
Fluence
Peak Flux (peak 1 second)
Measured from: 0.155999958515167
to: 1.15599995851517 [s; relative to TRIGTIME]
Total Fluence
Measured from: -1.80000001192093
to: 94.8159999847412 [s; relative to TRIGTIME]
Band 1 Band 2 Band 3 Band 4
15-25 25-50 50-100 100-350 keV
Total 2.403571 3.915729 4.264324 1.817516
0.069138 0.076871 0.077810 0.082348 [error]
Peak 0.142233 0.280550 0.413995 0.189063
0.009006 0.011431 0.013359 0.012607 [error]
[ fluence units of on-axis counts / fully illuminated detector ]
======================================================================
====== Table of the duration information =============================
Value tstart tstop
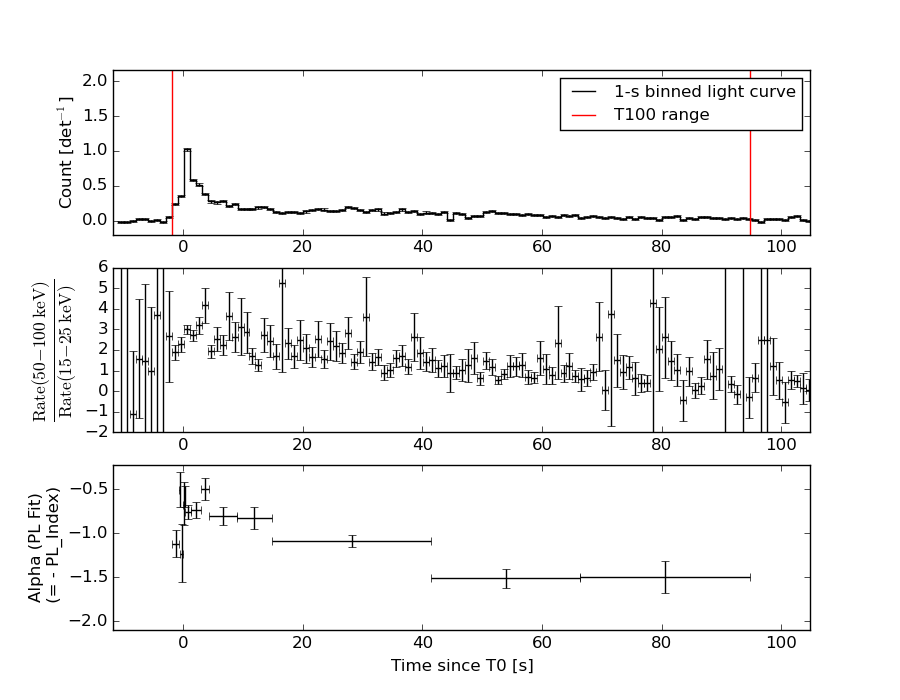
T100 96.616 -1.800 94.816
T90 78.868 0.128 78.996
T50 39.260 4.064 43.324
Peak 1.000 0.156 1.156
====== Spectral Analysis Summary =====================================
Model : spectral model: simple power-law (PL) and cutoff power-law (CPL)
Ph_index : photon index: E^{Ph_index}
Ph_90err : 90% error of the photon index
Epeak : Epeak in keV
Epeak_90err: 90% error of Epeak
Norm : normalization at 50 keV in both the PL model and CPL model
Nomr_90err : 90% error of the normalization
chi2 : Chi-Squared
dof : degree of freedo
=== Time-averaged spectral analysis ===
(Best model with acceptable fit: PL)
Model Ph_index Ph_90err_low Ph_90err_hi Epeak Epeak_90err_low Epeak_90err_hi Norm Nomr_90err_low Norm_90err_hi chi2 dof
PL -1.063 -0.045 0.045 - - - 8.63e-03 -2.00e-04 2.00e-04 48.170 57
CPL -1.003 -0.099 -0.008 999.882 -999.882 -999.882 9.14e-03 -6.61e-04 -1.24e-04 51.110 56
=== 1-s peak spectral analysis ===
(Best model with acceptable fit: N/A)
Model Ph_index Ph_90err_low Ph_90err_hi Epeak Epeak_90err_low Epeak_90err_hi Norm Nomr_90err_low Norm_90err_hi chi2 dof
PL -0.725 -0.071 0.072 - - - 6.69e-02 -2.70e-03 2.69e-03 50.100 57
CPL -0.703 -0.087 0.304 9936.610 -9936.610 -9936.610 6.73e-02 -2.41e-03 2.75e-03 50.190 56
=== Fluence/Peak Flux Summary ===
Model Band1 Band2 Band3 Band4 Band5 Total
15-25 25-50 50-100 100-350 15-150 15-350 keV
Fluence PL 7.08e-07 1.70e-06 3.26e-06 1.53e-05 8.83e-06 2.09e-05 erg/cm2
90%_error_low -3.71e-08 -5.13e-08 -8.13e-08 -9.34e-07 -2.11e-07 -9.60e-07 erg/cm2
90%_error_hi 3.79e-08 5.11e-08 8.10e-08 9.79e-07 2.12e-07 1.00e-06 erg/cm2
Peak flux PL 1.70e-04 2.62e-03 7.00e-02 8.55e+00 1.84e-01 8.19e+00 ph/cm2/s
90%_error_low N/A N/A N/A -2.74e-01 N/A 1.88e-01 ph/cm2/s
90%_error_hi N/A N/A N/A 9.44e-01 N/A 1.43e+00 ph/cm2/s
Fluence CPL 7.07e-07 1.70e-06 3.21e-06 1.60e-05 8.82e-06 2.10e-05 erg/cm2
90%_error_low -3.71e-08 -5.14e-08 N/A N/A -2.11e-07 -1.76e-06 erg/cm2
90%_error_hi 3.79e-08 5.11e-08 N/A N/A 2.11e-07 2.54e-07 erg/cm2
Peak flux CPL 1.10e-02 2.02e-03 1.27e-03 2.41e-05 4.39e-02 4.62e-02 ph/cm2/s
90%_error_low -1.10e-02 -2.02e-03 -1.27e-03 -2.41e-05 -4.39e-02 -4.62e-02 ph/cm2/s
90%_error_hi 1.03e-01 8.74e-02 1.55e-02 1.34e-02 5.11e-02 1.70e-01 ph/cm2/s
======================================================================
Image
Pre-slew 15.0-350.0 keV image (Event data)
#   RAcent    DECcent   POSerr    Theta     Phi              Peak Cts       SNR   Name
  136.4723    21.4826   0.0032    32.2633   179.5052        12.7593574     60.496 TRIG_00420247

Foreground time interval of the image:
 -1.800  94.816 (delta_t =  96.616 [sec])
Background time interval of the image:
-179.896  -1.800 (delta_t = 178.096 [sec])
Light Curves
Note: The mask-weighted lightcurves have units of either count/det or counts/sec/det, where a det is 0.4 x 0.4 = 0.16 sq cm.
Full-time range; 1 s binning
Other quick-look light curves:
- 64 ms binning (zoomed)
- 16 ms binning (zoomed)
- 8 ms binning (zoomed)
- 2 ms binning (zoomed)
- SN=5 or 10 s binning (full-time range)
- Raw light curve
Spectra
- 64 ms binning (zoomed)
- 16 ms binning (zoomed)
- 8 ms binning (zoomed)
- 2 ms binning (zoomed)
- SN=5 or 10 s binning (full-time range)
- Raw light curve
Spectra
Notes:
- 1) The fitting includes the systematic errors.
- 2) When the burst includes telescope slew time periods, the fitting uses an average response file made from multiple 5-s response files through out the slew time plus single time preiod for the non-slew times, and weighted by the total counts in the corresponding time period using addrmf. An average response file is needed becuase a spectral fit using the pre-slew DRM will introduce some errors in both a spectral shape and a normalization if the PHA file contains a lot of the slew/post-slew time interval.
- 3) For fits to more complicated models (e.g. a power-law over a cutoff power-law), the BAT team has decided to require a chi-square improvement of more than 6 for each extra dof.
Time averaged spectrum fit using the average DRM
Power-law model
Time interval is from   -1.800 sec. to   94.816 sec.

Spectral model in power-law:
------------------------------------------------------------
Parameters  : value       lower 90%   higher 90%
Photon index: -1.06259     ( -0.0449007   0.0451534 )
Norm@50keV  : 8.63100E-03    ( -0.000200423   0.000199663 )
------------------------------------------------------------
#Fit statistic : Chi-Squared =          48.17 using 59 PHA bins.
# Reduced chi-squared =         0.8450 for     57 degrees of freedom
# Null hypothesis probability =   7.913286e-01

Photon flux (15-150 keV)    in 96.62 sec: 0.997824 ( -0.024289  0.024396 ) ph/cm2/s
Energy fluence (15-150 keV)             : 8.82687e-06 ( -2.11443e-07  2.11639e-07 ) ergs/cm2
Cutoff power-law model

Time interval is from   -1.800 sec. to   94.816 sec.
Spectral model in the cutoff power-law:
------------------------------------------------------------
Parameters  : value       lower 90%   higher 90%
Photon index: -1.05563     ( -0.046655   0.0443844 )
Epeak [keV] : 9999.36      ( -9999.36 -9999.36 )
Norm@50keV  : 8.66137E-03    ( -0.000196631   0.000340097 )
------------------------------------------------------------
#Fit statistic : Chi-Squared =          48.44 using 59 PHA bins.
# Reduced chi-squared =         0.8649 for     56 degrees of freedom
# Null hypothesis probability =   7.536104e-01

Photon flux (15-150 keV)    in 96.62 sec: 0.997438 ( -0.024312  0.024372 ) ph/cm2/s
Energy fluence (15-150 keV)             : 8.82363e-06 ( -2.1137e-07  2.11349e-07 ) ergs/cm2
1-s peak spectrum fit
Power-law model

Time interval is from    0.156 sec. to    1.156 sec.

Spectral model in power-law:
------------------------------------------------------------
Parameters  : value       lower 90%   higher 90%
Photon index: -0.725094     ( -0.0707733   0.0716729 )
Norm@50keV  : 6.69428E-02    ( -0.00269793   0.00268656 )
------------------------------------------------------------
#Fit statistic : Chi-Squared =          50.10 using 59 PHA bins.
# Reduced chi-squared =         0.8790 for     57 degrees of freedom
# Null hypothesis probability =   7.294144e-01

Photon flux (15-150 keV)    in 1 sec: 0.184189 (    ) ph/cm2/s
Energy fluence (15-150 keV)             : 8.0809e-07 ( -3.43055e-08  3.43908e-08 ) ergs/cm2
Cutoff power-law model
Time interval is from    0.156 sec. to    1.156 sec.
Spectral model in the cutoff power-law:
------------------------------------------------------------
Parameters  : value       lower 90%   higher 90%
Photon index: -0.71714     ( -0.0869115   0.304371 )
Epeak [keV] : 9999.99      ( -9999.99 -9999.99 )
Norm@50keV  : 6.74527E-02    ( -0.00257787   0.0025754 )
------------------------------------------------------------
#Fit statistic : Chi-Squared =          50.08 using 59 PHA bins.
# Reduced chi-squared =         0.8943 for     56 degrees of freedom
# Null hypothesis probability =   6.973737e-01

Photon flux (15-150 keV)    in 1 sec: 4.38706E-02 ( -0.0438706  0.0511393 ) ph/cm2/s
Energy fluence (15-150 keV)             : 8.07365e-07 ( -2.95613e-08  3.38364e-08 ) ergs/cm2
Time-resolved spectra
Distribution
T90 vs. Hardness ratio plot
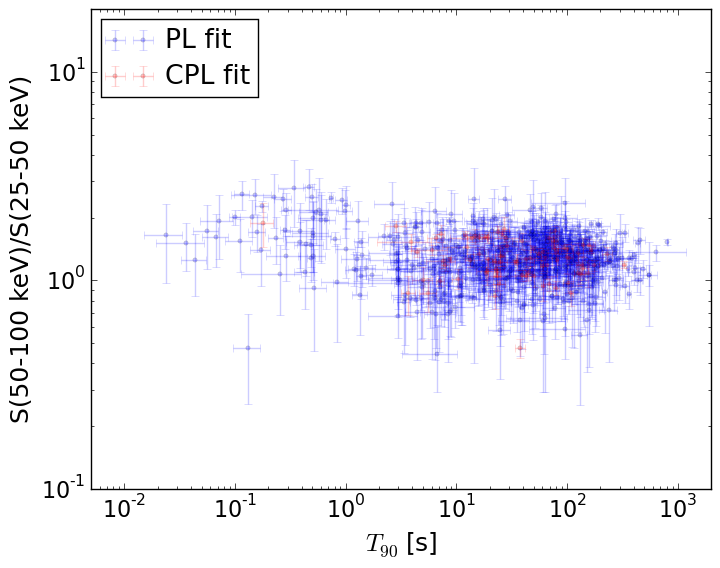
T90                                   = N/A sec.
Hardness ratio (energy fluence ratio) = N/A
S(15-50 keV) vs. S(50-150 keV) plot
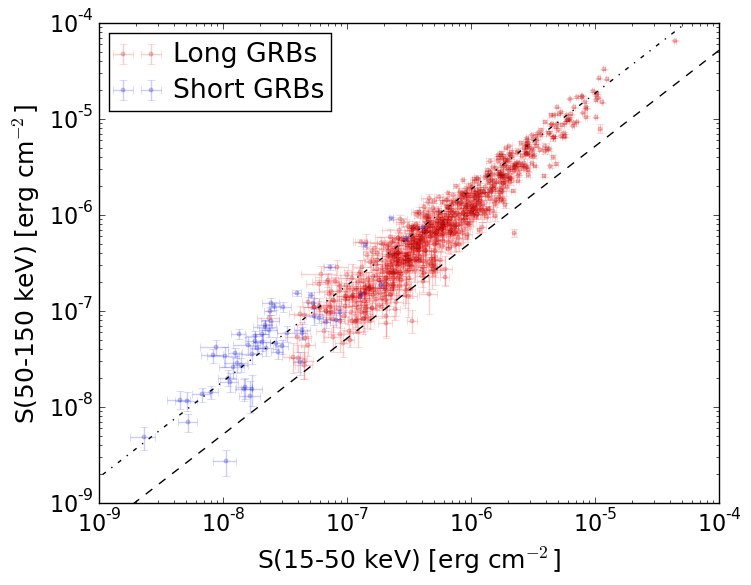
S(15-50 keV)  = N/A
S(50-150 keV) = N/A
The dash-dotted line and the dashed line traces the fluences calculated from the Band function with Epeak = 15 and 150 keV, respectively. Both lines assume a canonical values of alpha = -1 and beta = -2.5.
Mask shadow pattern
IMX = -6.312546461430615E-01, IMY = -5.451091616165411E-03
Spacecraft aspect plot
Bright source in the pre-burst/pre-slew/post-slew images
Pre-burst image of 15-350 keV band
Time interval of the image:
-179.896000 -1.800000

# RAcent  DECcent POSerr Theta    Phi  PeakCts   SNR AngSep     Name
#  [deg]    [deg]    ['] [deg]  [deg]                   [']
144.4444  12.0801    2.3  39.0  162.2   1.7342   5.0 ------	UNKNOWN
129.7968   0.6346    4.6  54.1  177.2   2.2006   2.5 ------	UNKNOWN
271.4235  62.2951    2.9  56.8   -5.2   3.7787   4.0 ------	UNKNOWN
101.8831  16.8880    3.8  54.1 -143.0   3.7528   3.1 ------	UNKNOWN
 93.3142  41.1347    2.5  43.1 -112.2   4.1873   4.6 ------	UNKNOWN
Pre-slew background subtracted image of 15-350 keV band
Time interval of the image:
-1.800000 94.816000

# RAcent  DECcent POSerr Theta    Phi  PeakCts   SNR AngSep     Name
#  [deg]    [deg]    ['] [deg]  [deg]                   [']
135.3003  -2.7463    1.8  55.6  169.6   6.5945   6.3 ------	UNKNOWN
185.3510  51.9254    2.3  18.7   37.5   0.8663   5.0 ------	UNKNOWN
136.4724  21.4826    0.2  32.3  179.5  12.7599  60.5 ------	UNKNOWN
262.4146  76.1546    2.0  45.6  -16.5   1.7878   5.9 ------	UNKNOWN
Post-slew image of 15-350 keV band
Time interval of the image:
247.404580 962.199000

# RAcent  DECcent POSerr Theta    Phi  PeakCts   SNR AngSep     Name
#  [deg]    [deg]    ['] [deg]  [deg]                   [']
244.9781 -15.6416    0.4  29.3   60.5  27.0111  32.8    0.1	Sco X-1
254.2454  35.3921    4.6  24.0 -146.6   1.4165   2.5   10.8	Her X-1
256.4835 -36.5135    3.1  47.9   37.5  -9.1992  -3.7    5.9	GX 349+2
263.1202 -24.6950   29.0  36.7   27.3   0.3326   0.4    6.8	GX 1+4
268.3567  -1.3336    7.8  17.5   -6.2   0.8713   1.5    7.2	SW J1753.5-0127
270.3468 -25.0247    3.7  38.9   17.2   2.4072   3.1    4.7	GX 5-1
270.4002 -25.7011    5.8  39.6   17.6   1.5866   2.0    5.9	GRS 1758-258
273.9063 -13.9922    3.1  30.8    2.8   2.3009   3.8    6.4	GX 17+2
276.0203 -30.3036   72.1  45.8   13.7   0.1835   0.2    6.2	H1820-303
284.8408 -24.8773  878.0  45.7    0.4   0.0131   0.0   10.9	HT1900.1-2455
288.7843  10.9294    1.2  31.8  -54.7   8.5203   9.8    1.3	GRS 1915+105
262.8758 -33.9086   10.3  45.8   30.1   1.8023   1.1    7.2	GX 354-0
273.8078  -7.0146    2.8  25.3   -6.5   2.3979   4.2 ------	UNKNOWN
294.0051 -29.4614    2.4  54.7   -3.1   8.9023   4.9 ------	UNKNOWN
269.6943  57.3559    4.2  47.1 -132.6   5.7675   2.8 ------	UNKNOWN
286.0595  46.4473    3.6  43.1 -112.4   8.7316   3.2 ------	UNKNOWN