Analysis Summary
Notes:
- 1) No attempt has been made to eliminate the non-significant decimal places.
- 2) This batgrbproduct analysis is done using the HEASARC data.
- 3) This batgrbproduct analysis is using the flight position for the mask-weighting calculation.
======================================================================
BAT GRB EVENT DATA PROCESSING REPORT
Process Script Ver: batgrbproduct v2.46
Process Start Time: Fri Jan 17 18:45:39 EST 2014
Host Name: batevent1
Current Working Dir: /local/data/batevent/batevent_reproc/trigger420398
======================================================================
Trigger: 00420398 Segment: 000
BAT Trigger Time: 293856650.816 [s; MET]
Trigger Stop: 293856651.84 [s; MET]
UTC: 2010-04-25T02:50:45.077880 [includes UTCF correction]
Where From?: TDRSS position message
BAT
RA: 299.186579434482 Dec: -26.4412771886309 [deg; J2000]
Catalogged Source?: NO
Point Source?: YES
GRB Indicated?: YES [ by BAT flight software ]
Image S/N Ratio: 9.39
Image Trigger?: NO
Rate S/N Ratio: 14.247806848775 [ if not an image trigger ]
Image S/N Ratio: 9.39
Analysis Position: [ source = BAT ]
RA: 299.186579434482 Dec: -26.4412771886309 [deg; J2000]
Refined Position: [ source = BAT pre-slew burst ]
RA: 299.172444443249 Dec: -26.4689278105844 [deg; J2000]
{ 19h 56m 41.4s , -26d 28' 08.1" }
+/- 2.27646847793376 [arcmin] (estimated 90% radius based on SNR)
+/- 1.27429295247065 [arcmin] (formal 1-sigma fit error)
SNR: 9.39170855598518
Angular difference between the analysis and refined position is 1.824534 arcmin
Partial Coding Fraction: 0.484375 [ including projection effects ]
Duration
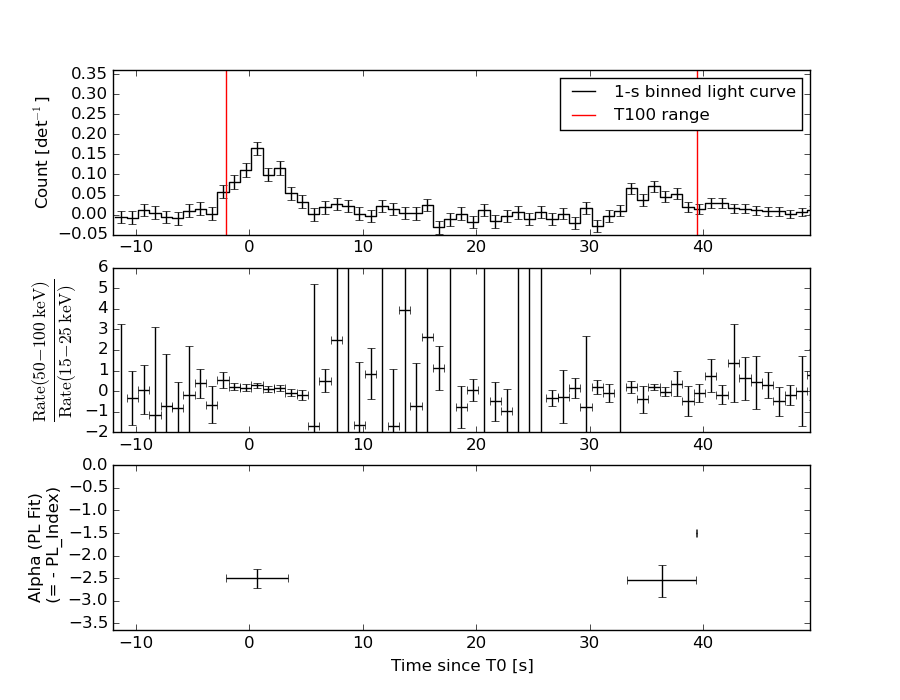
T90: 38.9679999351501 +/- 2.31389718317248
Measured from: -1.37199997901917
to: 37.595999956131 [s; relative to TRIGTIME]
T50: 21.0519999265671 +/- 17.4017645209196
Measured from: 0.364000022411346
to: 21.4159999489784 [s; relative to TRIGTIME]
Fluence
Peak Flux (peak 1 second)
Measured from: 0.23199999332428
to: 1.23199999332428 [s; relative to TRIGTIME]
Total Fluence
Measured from: -2.06400001049042
to: 39.4280000329018 [s; relative to TRIGTIME]
Band 1 Band 2 Band 3 Band 4
15-25 25-50 50-100 100-350 keV
Total 0.387527 0.459657 0.090753 0.068352
0.055455 0.052808 0.045670 0.040966 [error]
Peak 0.063878 0.069415 0.016813 0.019438
0.009984 0.009350 0.007540 0.006345 [error]
[ fluence units of on-axis counts / fully illuminated detector ]
======================================================================
====== Table of the duration information =============================
Value tstart tstop
T100 41.492 -2.064 39.428
T90 38.968 -1.372 37.596
T50 21.052 0.364 21.416
Peak 1.000 0.232 1.232
====== Spectral Analysis Summary =====================================
Model : spectral model: simple power-law (PL) and cutoff power-law (CPL)
Ph_index : photon index: E^{Ph_index}
Ph_90err : 90% error of the photon index
Epeak : Epeak in keV
Epeak_90err: 90% error of Epeak
Norm : normalization at 50 keV in both the PL model and CPL model
Nomr_90err : 90% error of the normalization
chi2 : Chi-Squared
dof : degree of freedo
=== Time-averaged spectral analysis ===
(Best model with acceptable fit: PL)
Model Ph_index Ph_90err_low Ph_90err_hi Epeak Epeak_90err_low Epeak_90err_hi Norm Nomr_90err_low Norm_90err_hi chi2 dof
PL -2.437 -0.346 0.306 - - - 1.14e-03 -2.81e-04 2.78e-04 59.300 57
CPL -0.885 -1.330 2.455 25.353 -24.615 9.316 1.10e-02 -1.10e-02 4.38e-01 56.650 56
=== 1-s peak spectral analysis ===
(Best model with acceptable fit: PL)
Model Ph_index Ph_90err_low Ph_90err_hi Epeak Epeak_90err_low Epeak_90err_hi Norm Nomr_90err_low Norm_90err_hi chi2 dof
PL -2.357 -0.345 0.309 - - - 7.60e-03 -1.91e-03 1.88e-03 50.600 57
CPL 0.029 -1.877 3.006 29.376 N/A N/A 2.57e-01 N/A N/A 45.750 56
=== Fluence/Peak Flux Summary ===
Model Band1 Band2 Band3 Band4 Band5 Total
15-25 25-50 50-100 100-350 15-150 15-350 keV
Fluence PL 1.46e-07 1.53e-07 1.13e-07 1.35e-07 4.64e-07 5.46e-07 erg/cm2
90%_error_low -2.72e-08 -2.63e-08 -3.60e-08 -6.70e-08 -8.63e-08 -1.26e-07 erg/cm2
90%_error_hi 2.77e-08 2.57e-08 3.95e-08 1.03e-07 9.05e-08 1.52e-07 erg/cm2
Peak flux PL 7.17e-01 4.37e-01 1.71e-01 8.94e-02 1.37e+00 1.41e+00 ph/cm2/s
90%_error_low -1.52e-01 -7.87e-02 -5.34e-02 -4.27e-02 -2.33e-01 -2.42e-01 ph/cm2/s
90%_error_hi 1.56e-01 7.78e-02 5.72e-02 6.22e-02 2.33e-01 2.42e-01 ph/cm2/s
Fluence CPL 1.37e-07 1.77e-07 1.08e-07 1.51e-07 4.61e-07 5.53e-07 erg/cm2
90%_error_low -3.12e-08 -3.64e-08 -3.15e-08 -6.79e-08 -8.49e-08 -1.26e-07 erg/cm2
90%_error_hi 3.04e-08 3.78e-08 4.40e-08 1.21e-07 9.42e-08 1.73e-07 erg/cm2
Peak flux CPL N/A N/A N/A N/A N/A N/A ph/cm2/s
90%_error_low -1.52e-01 -7.87e-02 -5.34e-02 -4.27e-02 -2.33e-01 -2.42e-01 ph/cm2/s
90%_error_hi 1.56e-01 7.78e-02 5.72e-02 6.22e-02 2.33e-01 2.42e-01 ph/cm2/s
======================================================================
Image
Pre-slew 15.0-350.0 keV image (Event data)
#   RAcent    DECcent   POSerr    Theta     Phi              Peak Cts       SNR   Name
  299.1724   -26.4689   0.0205    28.5240   -83.3437         0.7028538      9.392 TRIG_00420398

Foreground time interval of the image:
 -2.064  18.285 (delta_t =  20.349 [sec])
Background time interval of the image:
-239.816  -2.064 (delta_t = 237.752 [sec])
Light Curves
Note: The mask-weighted lightcurves have units of either count/det or counts/sec/det, where a det is 0.4 x 0.4 = 0.16 sq cm.
Full-time range; 1 s binning
Other quick-look light curves:
- 64 ms binning (zoomed)
- 16 ms binning (zoomed)
- 8 ms binning (zoomed)
- 2 ms binning (zoomed)
- SN=5 or 10 s binning (full-time range)
- Raw light curve
Spectra
- 64 ms binning (zoomed)
- 16 ms binning (zoomed)
- 8 ms binning (zoomed)
- 2 ms binning (zoomed)
- SN=5 or 10 s binning (full-time range)
- Raw light curve
Spectra
Notes:
- 1) The fitting includes the systematic errors.
- 2) When the burst includes telescope slew time periods, the fitting uses an average response file made from multiple 5-s response files through out the slew time plus single time preiod for the non-slew times, and weighted by the total counts in the corresponding time period using addrmf. An average response file is needed becuase a spectral fit using the pre-slew DRM will introduce some errors in both a spectral shape and a normalization if the PHA file contains a lot of the slew/post-slew time interval.
- 3) For fits to more complicated models (e.g. a power-law over a cutoff power-law), the BAT team has decided to require a chi-square improvement of more than 6 for each extra dof.
Time averaged spectrum fit using the average DRM
Power-law model
Time interval is from   -2.064 sec. to   39.428 sec.

Spectral model in power-law:
------------------------------------------------------------
Parameters  : value       lower 90%   higher 90%
Photon index: -2.43681     ( -0.346267   0.305951 )
Norm@50keV  : 1.13551E-03    ( -0.000280728   0.000277733 )
------------------------------------------------------------
#Fit statistic : Chi-Squared =          59.30 using 59 PHA bins.
# Reduced chi-squared =          1.040 for     57 degrees of freedom
# Null hypothesis probability =   3.916241e-01

Photon flux (15-150 keV)    in 41.49 sec: 0.214741 ( -0.032374  0.032375 ) ph/cm2/s
Energy fluence (15-150 keV)             : 4.63655e-07 ( -8.63316e-08  9.04901e-08 ) ergs/cm2
Cutoff power-law model
Time interval is from   -2.064 sec. to   39.428 sec.
Spectral model in the cutoff power-law:
------------------------------------------------------------
Parameters  : value       lower 90%   higher 90%
Photon index: -0.884688     ( -1.3345   2.45089 )
Epeak [keV] : 25.3526      ( -24.6552 9.27637 )
Norm@50keV  : 1.09981E-02    ( -0.0111245   0.438117 )
------------------------------------------------------------
#Fit statistic : Chi-Squared =          56.65 using 59 PHA bins.
# Reduced chi-squared =          1.012 for     56 degrees of freedom
# Null hypothesis probability =   4.504647e-01

Photon flux (15-150 keV)    in 41.49 sec: 0.206143 ( -0.032952  0.033237 ) ph/cm2/s
Energy fluence (15-150 keV)             : 4.61078e-07 ( -8.49176e-08  9.42035e-08 ) ergs/cm2
1-s peak spectrum fit
Power-law model
Time interval is from    0.232 sec. to    1.232 sec.

Spectral model in power-law:
------------------------------------------------------------
Parameters  : value       lower 90%   higher 90%
Photon index: -2.35659     ( -0.3452   0.309397 )
Norm@50keV  : 7.59650E-03    ( -0.00191019   0.00188311 )
------------------------------------------------------------
#Fit statistic : Chi-Squared =          50.60 using 59 PHA bins.
# Reduced chi-squared =         0.8878 for     57 degrees of freedom
# Null hypothesis probability =   7.123023e-01

Photon flux (15-150 keV)    in 1 sec: 1.37082 ( -0.23345  0.23344 ) ph/cm2/s
Energy fluence (15-150 keV)             : 7.34193e-08 ( -1.48257e-08  1.53862e-08 ) ergs/cm2
Cutoff power-law model
Time interval is from    0.232 sec. to    1.232 sec.
Spectral model in the cutoff power-law:
------------------------------------------------------------
Parameters  : value       lower 90%   higher 90%
Photon index: 0.0289198     ( -1.94219   2.94046 )
Epeak [keV] : 29.3762      (   )
Norm@50keV  : 0.257440    (     )
------------------------------------------------------------
#Fit statistic : Chi-Squared =          45.72 using 59 PHA bins.
# Reduced chi-squared =         0.8164 for     56 degrees of freedom
# Null hypothesis probability =   8.350901e-01

Photon flux (15-150 keV)    in 1 sec:  (    ) ph/cm2/s
Energy fluence (15-150 keV)             : 0 ( 0  0 ) ergs/cm2
Time-resolved spectra
Distribution
T90 vs. Hardness ratio plot
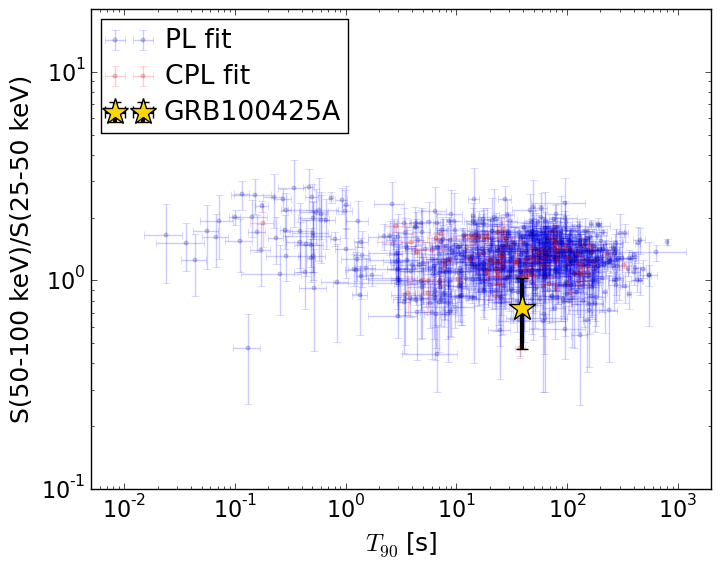
T90                                   = 38.968 sec.
Hardness ratio (energy fluence ratio) = 0.738822388149
S(15-50 keV) vs. S(50-150 keV) plot
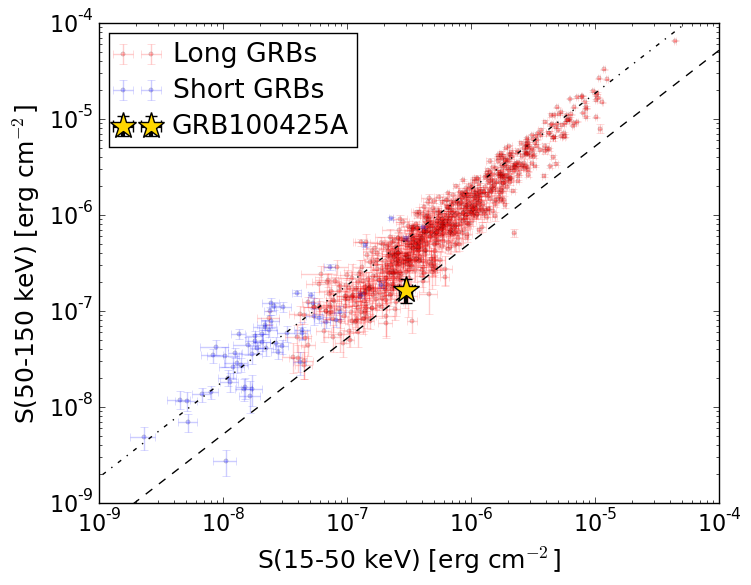
S(15-50 keV)  = 2.989874e-07
S(50-150 keV) = 1.6468007e-07
The dash-dotted line and the dashed line traces the fluences calculated from the Band function with Epeak = 15 and 150 keV, respectively. Both lines assume a canonical values of alpha = -1 and beta = -2.5.
Mask shadow pattern
IMX = 6.299890713493866E-02, IMY = 5.398339803588269E-01
Spacecraft aspect plot
Bright source in the pre-burst/pre-slew/post-slew images
Pre-burst image of 15-350 keV band
Time interval of the image:
-239.816000 -2.064000

# RAcent  DECcent POSerr Theta    Phi  PeakCts   SNR AngSep     Name
#  [deg]    [deg]    ['] [deg]  [deg]                   [']
244.9856 -15.6525    0.4  22.8   95.1   7.7928  29.0    0.8	Sco X-1
255.9056 -37.9809   17.2  18.8   23.2   0.1425   0.7    9.1	4U 1700-377
256.4371 -36.3866    6.7  17.3   25.3   0.3593   1.7    2.2	GX 349+2
262.9337 -24.6543   10.8   5.2   55.4   0.2032   1.1    6.8	GX 1+4
264.7513 -44.4520    4.0  22.2   -1.6   0.6687   2.9    0.4	4U 1735-44
268.4914  -1.5785   10.2  20.8  173.2   0.2445   1.1   10.6	SW J1753.5-0127
270.3153 -25.1001    6.4   3.4  -44.3   0.4010   1.9    2.1	GX 5-1
270.3688 -25.6719    3.3   3.9  -39.7   0.8417   4.0    5.6	GRS 1758-258
273.9540 -13.9633    3.9  10.1 -153.5   0.6414   3.0    5.3	GX 17+2
276.0165 -30.3653    8.4  10.7  -47.9   0.2963   1.4    4.7	H1820-303
284.8744 -24.7735    0.0  15.6  -85.8   0.0354   0.2   12.5	HT1900.1-2455
288.7733  10.9523    1.3  39.0 -154.5   3.0662   8.7    1.5	GRS 1915+105
263.0754 -33.7740    6.1  12.2   12.2   0.4242   1.9    5.6	GX 354-0
225.5993 -22.4098    2.8  39.2   73.6   3.1851   4.1 ------	UNKNOWN
320.9796 -54.7577    2.9  50.7  -44.4   5.0600   3.9 ------	UNKNOWN
313.8062 -29.9935    3.1  41.5  -77.4   3.5311   3.8 ------	UNKNOWN
Pre-slew background subtracted image of 15-350 keV band
Time interval of the image:
-2.064000 18.284600

# RAcent  DECcent POSerr Theta    Phi  PeakCts   SNR AngSep     Name
#  [deg]    [deg]    ['] [deg]  [deg]                   [']
244.7896 -15.7339    0.0  23.0   94.8   0.1933   2.9   12.3	Sco X-1
255.9850 -37.8710  147.2  18.7   23.2   0.0039   0.1    1.6	4U 1700-377
256.4380 -36.4168   40.1  17.3   25.2  -0.0146  -0.3    0.4	GX 349+2
262.9548 -24.6209    6.5   5.2   55.6   0.0878   1.8    8.0	GX 1+4
264.9706 -44.3255    0.0  22.1   -2.0  -0.1452  -2.7   12.3	4U 1735-44
268.2883  -1.5292    9.3  20.9  172.6   0.0655   1.2    6.6	SW J1753.5-0127
270.0993 -25.2095    0.0   3.4  -40.5   0.0821   1.6   12.7	GX 5-1
270.3878 -25.9033   11.0   4.1  -38.2   0.0536   1.1   10.7	GRS 1758-258
273.8465 -14.0917   71.3   9.9 -153.6  -0.0077  -0.2    9.8	GX 17+2
276.0417 -30.3359    4.8  10.7  -48.1   0.1153   2.4    6.3	H1820-303
285.1679 -25.0667   12.7  15.9  -84.8   0.0515   0.9   11.3	HT1900.1-2455
288.6771  10.9874    5.4  39.0 -154.7  -0.1503  -2.1    7.6	GRS 1915+105
262.9937 -33.8225   13.0  12.3   12.4   0.0420   0.9    0.8	GX 354-0
292.6154 -17.9259    2.0  23.4 -104.4   0.3500   5.8 ------	UNKNOWN
299.1721 -26.4660    1.2  28.5  -83.3   0.7049   9.4 ------	UNKNOWN
311.8331 -43.9606    2.4  41.8  -56.2   0.6369   4.8 ------	UNKNOWN
Post-slew image of 15-350 keV band
Time interval of the image:
68.084600 962.250600

# RAcent  DECcent POSerr Theta    Phi  PeakCts   SNR AngSep     Name
#  [deg]    [deg]    ['] [deg]  [deg]                   [']
256.1020 -37.9354    6.0  37.8   72.0  -2.7721  -1.9    7.7	4U 1700-377
256.4871 -36.5098   11.2  37.4   74.3   1.5515   1.0    5.8	GX 349+2
262.9410 -24.7495    4.4  32.6   95.4   2.8299   2.6    3.7	GX 1+4
264.8377 -44.6052  771.5  32.9   58.2   0.0134   0.0   10.2	4U 1735-44
268.4990  -1.5007    6.0  38.6  135.7   2.4301   1.9    8.4	SW J1753.5-0127
270.4549 -24.9848    9.6  25.9   97.4  -0.9476  -1.2   10.9	GX 5-1
270.2589 -25.6068   11.4  25.9   95.9   0.7938   1.0    8.5	GRS 1758-258
274.0393 -14.0776    1.7  26.6  123.4   4.5570   6.7    3.1	GX 17+2
275.8849 -30.3850    3.5  20.8   84.2   1.9414   3.3    2.3	H1820-303
285.0201 -24.9903    6.3  12.8  104.0   0.8751   1.8    4.3	HT1900.1-2455
288.7848  10.9248    0.7  38.7  174.1  11.7734  15.9    1.5	GRS 1915+105
262.8672 -33.9294    5.7  32.1   78.2  -2.0517  -2.0    8.3	GX 354-0
265.5826 -76.9422    2.6  53.0   19.6   9.6527   4.4 ------	UNKNOWN
283.5526  23.0813    2.4  51.8  172.2   7.6044   4.8 ------	UNKNOWN
325.9297  12.7874    4.7  47.1 -132.6   5.2519   2.5 ------	UNKNOWN
358.9421 -42.8038    3.7  50.7  -44.4  12.7373   3.1 ------	UNKNOWN