Analysis Summary
Notes:
- 1) No attempt has been made to eliminate the non-significant decimal places.
- 2) This batgrbproduct analysis is done using the HEASARC data.
- 3) This batgrbproduct analysis is using the flight position for the mask-weighting calculation.
======================================================================
BAT GRB EVENT DATA PROCESSING REPORT
Process Script Ver: batgrbproduct v2.46
Process Start Time: Fri Jan 17 18:42:12 EST 2014
Host Name: batevent1
Current Working Dir: /local/data/batevent/batevent_reproc/trigger421124
======================================================================
Trigger: 00421124 Segment: 000
BAT Trigger Time: 294693665.28 [s; MET]
Trigger Stop: 294693666.304 [s; MET]
UTC: 2010-05-04T19:20:59.512540 [includes UTCF correction]
Where From?: TDRSS position message
BAT
RA: 255.572346509643 Dec: -35.598882010796 [deg; J2000]
Catalogged Source?: NO
Point Source?: YES
GRB Indicated?: YES [ by BAT flight software ]
Image S/N Ratio: 12.86
Image Trigger?: NO
Rate S/N Ratio: 22.494443758404 [ if not an image trigger ]
Image S/N Ratio: 12.86
Analysis Position: [ source = BAT ]
RA: 255.572346509643 Dec: -35.598882010796 [deg; J2000]
Refined Position: [ source = BAT pre-slew burst ]
RA: 255.575114996708 Dec: -35.5897503832536 [deg; J2000]
{ 17h 02m 18.0s , -35d 35' 23.1" }
+/- 0.796118780377314 [arcmin] (estimated 90% radius based on SNR)
+/- 0.210892268506505 [arcmin] (formal 1-sigma fit error)
SNR: 42.1287493912533
Angular difference between the analysis and refined position is 0.564302 arcmin
Partial Coding Fraction: 0.9296875 [ including projection effects ]
Duration
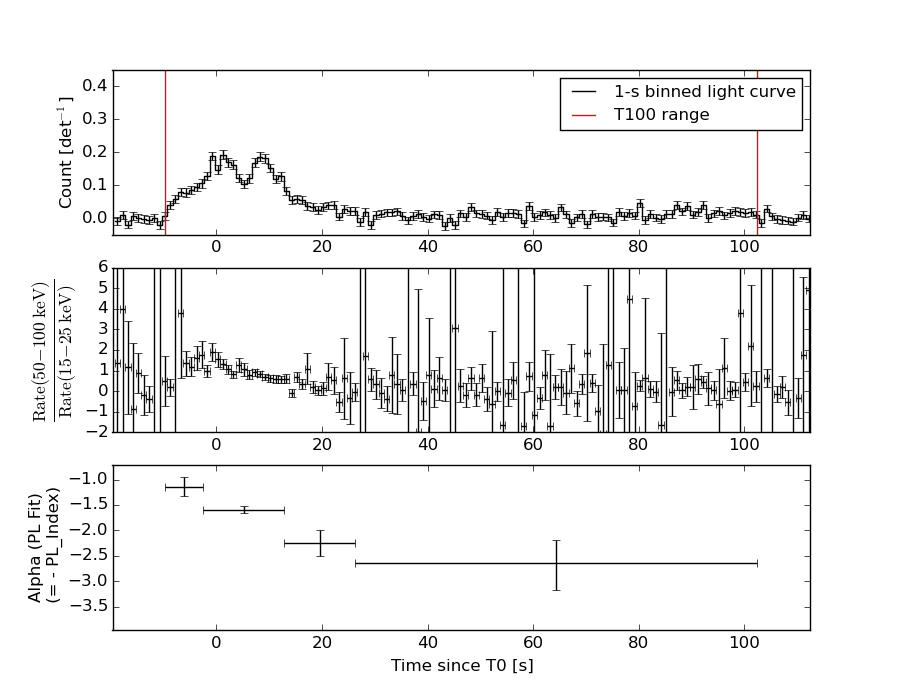
T90: 97.0039999485016 +/- 8.30478054933255
Measured from: -6.07599997520447
to: 90.9279999732971 [s; relative to TRIGTIME]
T50: 15.9639999866486 +/- 3.88017728475779
Measured from: 0.740000009536743
to: 16.7039999961853 [s; relative to TRIGTIME]
Fluence
Peak Flux (peak 1 second)
Measured from: 7.59200000762939
to: 8.59200000762939 [s; relative to TRIGTIME]
Total Fluence
Measured from: -9.69599997997284
to: 102.456000030041 [s; relative to TRIGTIME]
Band 1 Band 2 Band 3 Band 4
15-25 25-50 50-100 100-350 keV
Total 1.448332 1.567601 0.970883 0.146565
0.070698 0.065394 0.058083 0.057480 [error]
Peak 0.061169 0.078382 0.052719 0.009956
0.007460 0.007151 0.006505 0.005693 [error]
[ fluence units of on-axis counts / fully illuminated detector ]
======================================================================
====== Table of the duration information =============================
Value tstart tstop
T100 112.152 -9.696 102.456
T90 97.004 -6.076 90.928
T50 15.964 0.740 16.704
Peak 1.000 7.592 8.592
====== Spectral Analysis Summary =====================================
Model : spectral model: simple power-law (PL) and cutoff power-law (CPL)
Ph_index : photon index: E^{Ph_index}
Ph_90err : 90% error of the photon index
Epeak : Epeak in keV
Epeak_90err: 90% error of Epeak
Norm : normalization at 50 keV in both the PL model and CPL model
Nomr_90err : 90% error of the normalization
chi2 : Chi-Squared
dof : degree of freedo
=== Time-averaged spectral analysis ===
(Best model with acceptable fit: PL)
Model Ph_index Ph_90err_low Ph_90err_hi Epeak Epeak_90err_low Epeak_90err_hi Norm Nomr_90err_low Norm_90err_hi chi2 dof
PL -1.765 -0.101 0.100 - - - 2.27e-03 -1.24e-04 1.23e-04 61.450 57
CPL -1.682 -0.355 0.402 179.775 -114.081 -179.775 2.50e-03 -3.69e-04 1.52e-03 61.310 56
=== 1-s peak spectral analysis ===
(Best model with acceptable fit: PL)
Model Ph_index Ph_90err_low Ph_90err_hi Epeak Epeak_90err_low Epeak_90err_hi Norm Nomr_90err_low Norm_90err_hi chi2 dof
PL -1.628 -0.194 0.189 - - - 1.29e-02 -1.46e-03 1.44e-03 52.340 57
CPL -1.347 -0.733 0.831 110.920 -53.254 -110.920 1.81e-02 -6.53e-03 3.02e-02 51.910 56
=== Fluence/Peak Flux Summary ===
Model Band1 Band2 Band3 Band4 Band5 Total
15-25 25-50 50-100 100-350 15-150 15-350 keV
Fluence PL 4.16e-07 6.51e-07 7.66e-07 1.75e-06 2.34e-06 3.58e-06 erg/cm2
90%_error_low -3.58e-08 -3.30e-08 -5.84e-08 -2.72e-07 -1.32e-07 -3.21e-07 erg/cm2
90%_error_hi 3.68e-08 3.29e-08 5.87e-08 3.07e-07 1.33e-07 3.49e-07 erg/cm2
Peak flux PL 6.02e-01 5.62e-01 3.64e-01 3.63e-01 1.68e+00 1.89e+00 ph/cm2/s
90%_error_low -1.01e-01 -5.94e-02 -5.38e-02 -9.87e-02 -1.73e-01 -1.98e-01 ph/cm2/s
90%_error_hi 1.06e-01 5.91e-02 5.36e-02 1.20e-01 1.74e-01 1.99e-01 ph/cm2/s
Fluence CPL 4.11e-07 6.56e-07 7.67e-07 1.51e-06 2.32e-06 3.34e-06 erg/cm2
90%_error_low -4.31e-08 -3.67e-08 -5.92e-08 -7.10e-07 -1.65e-07 -7.37e-07 erg/cm2
90%_error_hi 3.77e-08 4.00e-08 5.95e-08 2.98e-07 1.51e-07 3.48e-07 erg/cm2
Peak flux CPL 5.76e-01 5.77e-01 3.69e-01 2.54e-01 1.65e+00 1.78e+00 ph/cm2/s
90%_error_low -1.22e-01 -6.97e-02 -5.65e-02 -1.49e-01 -1.85e-01 -2.54e-01 ph/cm2/s
90%_error_hi 1.23e-01 7.30e-02 5.80e-02 1.39e-01 1.84e-01 2.64e-01 ph/cm2/s
======================================================================
Image
Pre-slew 15.0-350.0 keV image (Event data)
#   RAcent    DECcent   POSerr    Theta     Phi              Peak Cts       SNR   Name
  255.5751   -35.5898   0.0046    17.1329    26.9289         2.7723581     42.129 TRIG_00421124

Foreground time interval of the image:
 -9.696  11.621 (delta_t =  21.317 [sec])
Background time interval of the image:
-239.280  -9.696 (delta_t = 229.584 [sec])
Light Curves
Note: The mask-weighted lightcurves have units of either count/det or counts/sec/det, where a det is 0.4 x 0.4 = 0.16 sq cm.
Full-time range; 1 s binning
Other quick-look light curves:
- 64 ms binning (zoomed)
- 16 ms binning (zoomed)
- 8 ms binning (zoomed)
- 2 ms binning (zoomed)
- SN=5 or 10 s binning (full-time range)
- Raw light curve
Spectra
- 64 ms binning (zoomed)
- 16 ms binning (zoomed)
- 8 ms binning (zoomed)
- 2 ms binning (zoomed)
- SN=5 or 10 s binning (full-time range)
- Raw light curve
Spectra
Notes:
- 1) The fitting includes the systematic errors.
- 2) When the burst includes telescope slew time periods, the fitting uses an average response file made from multiple 5-s response files through out the slew time plus single time preiod for the non-slew times, and weighted by the total counts in the corresponding time period using addrmf. An average response file is needed becuase a spectral fit using the pre-slew DRM will introduce some errors in both a spectral shape and a normalization if the PHA file contains a lot of the slew/post-slew time interval.
- 3) For fits to more complicated models (e.g. a power-law over a cutoff power-law), the BAT team has decided to require a chi-square improvement of more than 6 for each extra dof.
Time averaged spectrum fit using the average DRM
Power-law model
Time interval is from   -9.696 sec. to  102.456 sec.

Spectral model in power-law:
------------------------------------------------------------
Parameters  : value       lower 90%   higher 90%
Photon index: -1.76457     ( -0.100956   0.099807 )
Norm@50keV  : 2.26516E-03    ( -0.00012369   0.000122726 )
------------------------------------------------------------
#Fit statistic : Chi-Squared =          61.45 using 59 PHA bins.
# Reduced chi-squared =          1.078 for     57 degrees of freedom
# Null hypothesis probability =   3.196740e-01

Photon flux (15-150 keV)    in 112.2 sec: 0.307966 ( -0.015866  0.015922 ) ph/cm2/s
Energy fluence (15-150 keV)             : 2.34366e-06 ( -1.32177e-07  1.33441e-07 ) ergs/cm2
Cutoff power-law model
Time interval is from   -9.696 sec. to  102.456 sec.
Spectral model in the cutoff power-law:
------------------------------------------------------------
Parameters  : value       lower 90%   higher 90%
Photon index: -1.6819     ( -0.35461   0.402695 )
Epeak [keV] : 179.775      ( -114.996 -180.691 )
Norm@50keV  : 2.50299E-03    ( -0.000367871   0.00152115 )
------------------------------------------------------------
#Fit statistic : Chi-Squared =          61.31 using 59 PHA bins.
# Reduced chi-squared =          1.095 for     56 degrees of freedom
# Null hypothesis probability =   2.912876e-01

Photon flux (15-150 keV)    in 112.2 sec: 0.306161 ( -0.017824  0.0172 ) ph/cm2/s
Energy fluence (15-150 keV)             : 2.32152e-06 ( -1.65349e-07  1.50962e-07 ) ergs/cm2
1-s peak spectrum fit
Power-law model
Time interval is from    7.592 sec. to    8.592 sec.

Spectral model in power-law:
------------------------------------------------------------
Parameters  : value       lower 90%   higher 90%
Photon index: -1.62784     ( -0.194116   0.189009 )
Norm@50keV  : 1.29382E-02    ( -0.00146084   0.0014387 )
------------------------------------------------------------
#Fit statistic : Chi-Squared =          52.34 using 59 PHA bins.
# Reduced chi-squared =         0.9182 for     57 degrees of freedom
# Null hypothesis probability =   6.502567e-01

Photon flux (15-150 keV)    in 1 sec: 1.67733 ( -0.17348  0.1737 ) ph/cm2/s
Energy fluence (15-150 keV)             : 1.20626e-07 ( -1.45737e-08  1.48243e-08 ) ergs/cm2
Cutoff power-law model
Time interval is from    7.592 sec. to    8.592 sec.
Spectral model in the cutoff power-law:
------------------------------------------------------------
Parameters  : value       lower 90%   higher 90%
Photon index: -1.34743     ( -0.73299   0.830967 )
Epeak [keV] : 110.920      ( -53.2627 -110.929 )
Norm@50keV  : 1.81451E-02    ( -0.00652535   0.0302428 )
------------------------------------------------------------
#Fit statistic : Chi-Squared =          51.91 using 59 PHA bins.
# Reduced chi-squared =         0.9269 for     56 degrees of freedom
# Null hypothesis probability =   6.304557e-01

Photon flux (15-150 keV)    in 1 sec: 1.65331 ( -0.18478  0.1838 ) ph/cm2/s
Energy fluence (15-150 keV)             : 1.17455e-07 ( -1.66249e-08  1.67473e-08 ) ergs/cm2
Time-resolved spectra
Distribution
T90 vs. Hardness ratio plot
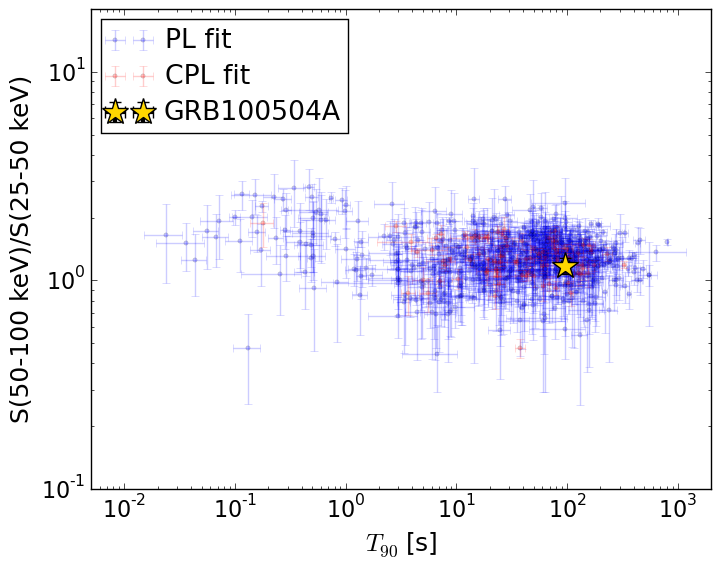
T90                                   = 97.004 sec.
Hardness ratio (energy fluence ratio) = 1.17728062136
S(15-50 keV) vs. S(50-150 keV) plot
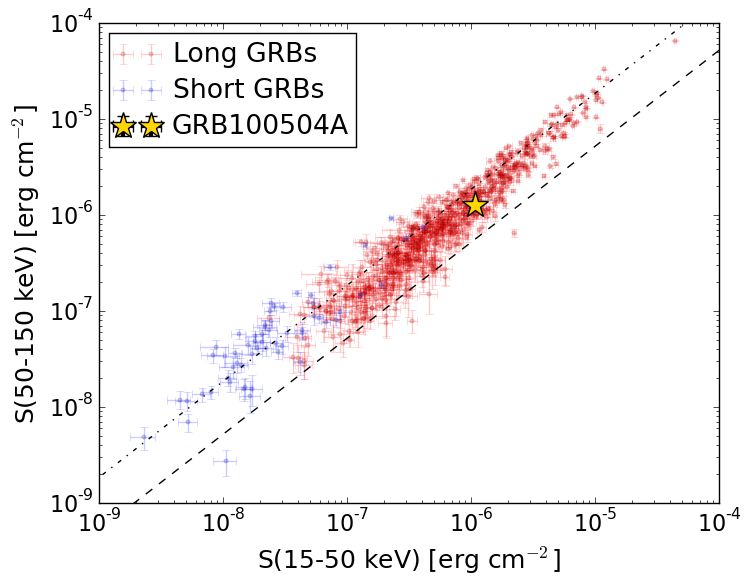
S(15-50 keV)  = 1.0672922e-06
S(50-150 keV) = 1.2763574e-06
The dash-dotted line and the dashed line traces the fluences calculated from the Band function with Epeak = 15 and 150 keV, respectively. Both lines assume a canonical values of alpha = -1 and beta = -2.5.
Mask shadow pattern
IMX = 2.748437865463495E-01, IMY = -1.396105504656576E-01
Spacecraft aspect plot
Bright source in the pre-burst/pre-slew/post-slew images
Pre-burst image of 15-350 keV band
Time interval of the image:
-239.280000 -9.696000

# RAcent  DECcent POSerr Theta    Phi  PeakCts   SNR AngSep     Name
#  [deg]    [deg]    ['] [deg]  [deg]                   [']
244.9933 -15.6436    0.3  22.8   93.2  11.7165  35.4    0.8	Sco X-1
255.7643 -37.9460    0.0  18.8   21.6  -0.3333  -1.4   12.2	4U 1700-377
256.3834 -36.3820    4.5  17.3   23.5   0.5930   2.5    3.5	GX 349+2
263.0460 -24.5998    4.9   5.1   53.5   0.5690   2.3    9.0	GX 1+4
264.8135 -44.5130    5.6  22.3   -3.7   0.5106   2.1    4.8	4U 1735-44
268.2993  -1.3757    4.6  21.0  170.7   0.6578   2.5    6.2	SW J1753.5-0127
270.2926 -25.0709    2.0   3.4  -46.1   1.5143   5.9    0.7	GX 5-1
270.3500 -25.7121    5.0   3.9  -41.0   0.6140   2.5    3.2	GRS 1758-258
273.9277 -14.0219    2.3  10.0 -155.3   1.2691   5.0    4.6	GX 17+2
275.9713 -30.3656    6.6  10.7  -49.6   0.4474   1.7    2.4	H1820-303
285.1943 -24.8207   99.3  15.8  -87.6  -0.0326  -0.1   10.5	HT1900.1-2455
288.7775  10.9326    1.6  39.0 -156.4   2.9930   7.2    1.5	GRS 1915+105
263.1669 -33.8451   11.1  12.3    9.8   0.2728   1.0    8.9	GX 354-0
247.8931   9.0422    2.7  37.1  135.8   2.4116   4.3 ------	UNKNOWN
Pre-slew background subtracted image of 15-350 keV band
Time interval of the image:
-9.696000 11.620600

# RAcent  DECcent POSerr Theta    Phi  PeakCts   SNR AngSep     Name
#  [deg]    [deg]    ['] [deg]  [deg]                   [']
244.8241 -15.6812  337.0  23.0   93.0   0.0030   0.0    9.3	Sco X-1
256.1814 -37.8226  759.5  18.5   21.0  -0.0010  -0.0    9.3	4U 1700-377
256.4363 -36.4225    8.8  17.3   23.3  -0.0879  -1.3    0.1	GX 349+2
263.0439 -24.9052    5.2   5.3   50.5  -0.1396  -2.2    9.8	GX 1+4
264.9770 -44.3307    0.0  22.1   -3.9  -0.1643  -2.5   12.3	4U 1735-44
268.5053  -1.4825    3.1  20.9  171.3  -0.2499  -3.7    8.4	SW J1753.5-0127
270.0946 -25.2038    0.0   3.4  -42.3  -0.0309  -0.5   12.7	GX 5-1
270.1427 -25.6946  189.3   3.8  -38.8  -0.0044  -0.1    9.1	GRS 1758-258
273.9503 -14.1797   28.6   9.9 -154.7   0.0254   0.4    9.2	GX 17+2
276.1170 -30.2347    0.0  10.6  -50.6   0.1837   2.9   12.7	H1820-303
284.8759 -24.8307    6.2  15.6  -87.4   0.1272   1.9   10.2	HT1900.1-2455
288.9034  10.8299    4.9  39.0 -156.1   0.2157   2.3    9.3	GRS 1915+105
263.1241 -34.0129    0.0  12.4    9.7   0.0569   0.9   12.6	GX 354-0
257.8187 -17.8130    2.5  10.7  103.6   0.3064   4.6 ------	UNKNOWN
255.5751 -35.5836    0.3  17.1   26.9   2.6174  39.4 ------	UNKNOWN
279.1321  -0.2602    2.5  24.6 -162.4   0.2855   4.6 ------	UNKNOWN
275.6320 -45.5400    2.4  24.0  -22.9   0.3156   4.9 ------	UNKNOWN
288.7680 -75.1575    2.3  53.9  -16.3   1.0160   5.0 ------	UNKNOWN
297.0118 -45.7265    2.6  33.1  -48.0   0.3930   4.4 ------	UNKNOWN
311.2707 -18.0784    3.2  40.6  -97.8   0.9273   3.7 ------	UNKNOWN
308.9176   2.6116    2.0  47.0 -126.6   1.7078   5.8 ------	UNKNOWN
	UNKNOWN
Post-slew image of 15-350 keV band
Time interval of the image:
51.620600 962.796300

# RAcent  DECcent POSerr Theta    Phi  PeakCts   SNR AngSep     Name
#  [deg]    [deg]    ['] [deg]  [deg]                   [']
186.5759 -62.6769    9.7  49.4   10.5   2.0176   1.2    6.0	GX 301-2
244.9746 -15.6433    0.2  22.1  128.0  48.8597  56.2    0.3	Sco X-1
255.7361 -37.9210    0.0   2.3  -27.2   0.1580   0.2   12.7	4U 1700-377
256.3852 -36.4082    2.5   1.0  -63.1   3.5228   4.6    2.6	GX 349+2
263.2163 -24.6555    0.0  12.8 -170.8   0.9107   1.1   12.5	GX 1+4
264.9883 -44.3961    3.6  11.4  -60.3   2.3033   3.2   11.0	4U 1735-44
268.4398  -1.6094    8.9  36.0  178.3   1.1999   1.3   10.3	SW J1753.5-0127
270.3240 -25.0406    1.4  16.5 -149.6   6.1061   8.2    3.2	GX 5-1
270.4253 -25.6259    4.4  16.2 -147.9   2.1069   2.8    9.7	GRS 1758-258
273.9717 -14.0402    3.4  27.2 -161.8   2.8296   3.4    2.0	GX 17+2
276.0499 -30.2906    3.0  18.0 -125.3   3.3166   3.9    7.9	H1820-303
285.1096 -25.0779    8.9  27.4 -128.3  -1.2856  -1.3   10.3	HT1900.1-2455
288.7733  10.9529    9.5  56.1 -163.6   3.6669   1.2    1.5	GRS 1915+105
262.8514 -33.9522    9.8   6.2 -127.3   0.9118   1.2    9.8	GX 354-0
209.1114 -26.2950    2.5  40.5   66.0  15.1241   4.6 ------	UNKNOWN
155.3460 -82.0129    4.3  56.2  -14.4   8.3983   2.7 ------	UNKNOWN
326.4229 -73.1430    3.7  50.6  -44.7  15.4038   3.2 ------	UNKNOWN
306.7153 -35.3697    4.4  41.2  -98.7  12.7949   2.7 ------	UNKNOWN