Analysis Summary
Notes:
- 1) No attempt has been made to eliminate the non-significant decimal places.
- 2) This batgrbproduct analysis is done using the HEASARC data.
- 3) This batgrbproduct analysis is using the flight position for the mask-weighting calculation.
======================================================================
                  BAT GRB EVENT DATA PROCESSING REPORT
    Process Script Ver: batgrbproduct v2.46
    Process Start Time: Fri Jan 17 18:38:45 EST 2014
             Host Name: batevent1
   Current Working Dir: /local/data/batevent/batevent_reproc/trigger421386
======================================================================

  Trigger: 00421386      Segment: 000

  BAT Trigger Time: 295003248   [s; MET]
      Trigger Stop: 295003312   [s; MET]
               UTC: 2010-05-08T09:20:42.221700    [includes UTCF correction]
       Where From?: TDRSS position message

  BAT
    RA: 76.2500038130658   Dec: -20.7209133097938  [deg; J2000]

     Catalogged Source?: NO
     Point Source?:      YES
     GRB Indicated?:     YES    [ by BAT flight software ]
     Image S/N Ratio:    7.47
     Image Trigger?:     YES
     Rate S/N Ratio:     0  [ if not an image trigger ]
     Image S/N Ratio:    7.47

  Analysis Position:   [ source = BAT ]
    RA: 76.2500038130658   Dec: -20.7209133097938  [deg; J2000]

  Refined Position:   [ source = BAT pre-slew burst ]
    RA: 76.2623306053277   Dec: -20.7385461703544  [deg; J2000]
        { 05h 05m 03.0s , -20d 44' 18.8" }
         +/- 2.05586667055115 [arcmin] (estimated 90% radius based on SNR)
         +/- 1.18039143244673 [arcmin] (formal 1-sigma fit error)
    SNR: 10.8638245466385

  Angular difference between the analysis and refined position is 1.264037 arcmin

  Partial Coding Fraction: 0.703125    [ including projection effects ]

  Duration
     T90: 49.2599999308586 +/- 7.42963064686218
        Measured from: 3.53200000524521
                   to: 52.7919999361038     [s; relative to TRIGTIME]
     T50: 21.7879999876022 +/- 10.8364505686661
        Measured from: 8.43599998950958
                   to: 30.2239999771118     [s; relative to TRIGTIME]


  Fluence
     Peak Flux  (peak 1 second)
        Measured from: 30.6000000238419
                   to: 31.6000000238419     [s; relative to TRIGTIME]
     Total Fluence
        Measured from: -1.53200000524521
                   to: 58.3759999871254     [s; relative to TRIGTIME]

             Band 1     Band 2     Band 3     Band 4
              15-25      25-50     50-100    100-350     keV
 Total     0.155092   0.411623   0.352586   0.162341
           0.049021   0.050998   0.046172   0.042644 [error]
 Peak      0.012240   0.017449   0.024116   0.004880
           0.006168   0.006458   0.005995   0.005533 [error]

     [ fluence units of on-axis counts / fully illuminated detector ]

======================================================================


====== Table of the duration information =============================

        Value   tstart    tstop
T100   59.908   -1.532   58.376
T90    49.260    3.532   52.792
T50    21.788    8.436   30.224
Peak    1.000   30.600   31.600


====== Spectral Analysis Summary =====================================

Model      : spectral model: simple power-law (PL) and cutoff power-law (CPL)
Ph_index   : photon index: E^{Ph_index}
Ph_90err   : 90% error of the photon index
Epeak      : Epeak in keV
Epeak_90err: 90% error of Epeak
Norm       : normalization at 50 keV in both the PL model and CPL model
Nomr_90err : 90% error of the normalization
chi2       : Chi-Squared
dof        : degree of freedo

=== Time-averaged spectral analysis ===
(Best model with acceptable fit: PL)

Model Ph_index Ph_90err_low Ph_90err_hi  Epeak  Epeak_90err_low  Epeak_90err_hi  Norm       Nomr_90err_low    Norm_90err_hi    chi2    dof
PL      -1.218    -0.235      0.241       -           -               -         1.24e-03     -1.68e-04          1.68e-04      35.610   57
CPL     -0.889    -0.535      1.091      179.998    -179.998      -179.998      1.78e-03     -6.91e-04          3.94e-03      35.230   56


=== 1-s peak spectral analysis ===
(Best model with acceptable fit: PL)

Model Ph_index Ph_90err_low Ph_90err_hi  Epeak  Epeak_90err_low  Epeak_90err_hi  Norm       Nomr_90err_low    Norm_90err_hi    chi2    dof
PL      -1.111     -0.562     0.605       -           -               -         4.05e-03     -1.28e-03          1.27e-03      64.030   57
CPL     -0.795      0.795     3.031      224.527    -224.527      -224.527      5.55e-03     -2.70e-03          7.78e-02      63.960   56


=== Fluence/Peak Flux Summary ===

              Model    Band1     Band2     Band3     Band4     Band5     Total
                       15-25     25-50    50-100    100-350    15-150    15-350    keV
Fluence         PL   7.29e-08  1.59e-07  2.74e-07  1.09e-06  7.50e-07  1.59e-06   erg/cm2
      90%_error_low -1.83e-08 -2.53e-08 -4.38e-08 -3.42e-07 -1.10e-07 -3.75e-07   erg/cm2
      90%_error_hi   1.98e-08  2.47e-08  4.33e-08  4.42e-07  1.11e-07  4.59e-07   erg/cm2
Peak flux       PL   1.15e-01  1.46e-01  1.35e-01  2.19e-01  4.70e-01  6.15e-01   ph/cm2/s
      90%_error_low -6.53e-02 -5.87e-02 -4.70e-02 -1.28e-01 -1.53e-01 -1.97e-01   ph/cm2/s
      90%_error_hi   8.26e-02  5.62e-02  4.56e-02  2.12e-01  1.55e-01  2.09e-01   ph/cm2/s

Fluence        CPL   6.82e-08  1.64e-07  2.82e-07  6.80e-07  7.34e-07  1.19e-06   erg/cm2
      90%_error_low -2.21e-08 -2.81e-08 -4.86e-08 -4.69e-07 -1.22e-07 -4.83e-07   erg/cm2
      90%_error_hi   2.04e-08  2.97e-08  5.04e-08  8.67e-07  1.19e-07  4.88e-07   erg/cm2
Peak flux      CPL   1.05e-01  1.48e-01  1.40e-01  1.63e-01  4.63e-01  5.59e-01   ph/cm2/s
      90%_error_low -8.16e-02 -6.24e-02 -5.17e-02 -1.63e-01 -1.60e-01 -2.38e-01   ph/cm2/s
      90%_error_hi   9.05e-02  6.22e-02  5.96e-02  2.56e-01  1.56e-01  2.57e-01   ph/cm2/s

======================================================================
Image
Pre-slew 15.0-350.0 keV image (Event data)
#   RAcent    DECcent   POSerr    Theta     Phi              Peak Cts       SNR   Name
   76.2623   -20.7385   0.0177    34.1411    -4.7471         1.1209384     10.864 TRIG_00421386

Foreground time interval of the image:
 -1.532  58.376 (delta_t =  59.908 [sec])
Background time interval of the image:
-239.000  -1.532 (delta_t = 237.468 [sec])
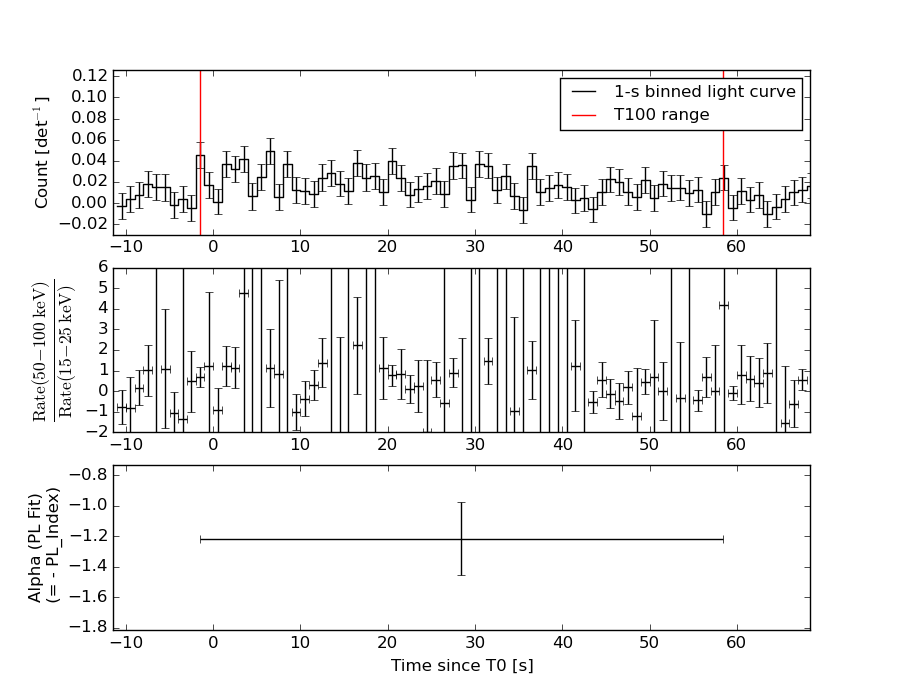
Light Curves
Note: The mask-weighted lightcurves have units of either count/det or counts/sec/det, where a det is 0.4 x 0.4 = 0.16 sq cm.
Full-time range; 1 s binning
Other quick-look light curves:
- 64 ms binning (zoomed)
- 16 ms binning (zoomed)
- 8 ms binning (zoomed)
- 2 ms binning (zoomed)
- SN=5 or 10 s binning (full-time range)
- Raw light curve
Spectra
- 64 ms binning (zoomed)
- 16 ms binning (zoomed)
- 8 ms binning (zoomed)
- 2 ms binning (zoomed)
- SN=5 or 10 s binning (full-time range)
- Raw light curve
Spectra
Notes:
- 1) The fitting includes the systematic errors.
- 2) When the burst includes telescope slew time periods, the fitting uses an average response file made from multiple 5-s response files through out the slew time plus single time preiod for the non-slew times, and weighted by the total counts in the corresponding time period using addrmf. An average response file is needed becuase a spectral fit using the pre-slew DRM will introduce some errors in both a spectral shape and a normalization if the PHA file contains a lot of the slew/post-slew time interval.
- 3) For fits to more complicated models (e.g. a power-law over a cutoff power-law), the BAT team has decided to require a chi-square improvement of more than 6 for each extra dof.
Time averaged spectrum fit using the average DRM
Power-law model
Time interval is from   -1.532 sec. to   58.376 sec.

Spectral model in power-law:
------------------------------------------------------------
Parameters  : value       lower 90%   higher 90%
Photon index: -1.21834     ( -0.234745   0.241159 )
Norm@50keV  : 1.23973E-03    ( -0.000167895   0.000167811 )
------------------------------------------------------------
#Fit statistic : Chi-Squared =          35.61 using 59 PHA bins.
# Reduced chi-squared =         0.6247 for     57 degrees of freedom
# Null hypothesis probability =   9.882331e-01

Photon flux (15-150 keV)    in 59.91 sec: 0.145907 ( -0.020546  0.020622 ) ph/cm2/s
Energy fluence (15-150 keV)             : 7.49756e-07 ( -1.10361e-07  1.11316e-07 ) ergs/cm2
Cutoff power-law model
Time interval is from   -1.532 sec. to   58.376 sec.
Spectral model in the cutoff power-law:
------------------------------------------------------------
Parameters  : value       lower 90%   higher 90%
Photon index: -0.888843     ( -0.534714   1.09111 )
Epeak [keV] : 179.998      ( -180.008 -180.008 )
Norm@50keV  : 1.78330E-03    ( -0.000690971   0.00393894 )
------------------------------------------------------------
#Fit statistic : Chi-Squared =          35.23 using 59 PHA bins.
# Reduced chi-squared =         0.6291 for     56 degrees of freedom
# Null hypothesis probability =   9.864954e-01

Photon flux (15-150 keV)    in 59.91 sec: 0.143876 ( -0.021358  0.021345 ) ph/cm2/s
Energy fluence (15-150 keV)             : 7.33586e-07 ( -1.22068e-07  1.19414e-07 ) ergs/cm2
1-s peak spectrum fit
Power-law model
Time interval is from   30.600 sec. to   31.600 sec.

Spectral model in power-law:
------------------------------------------------------------
Parameters  : value       lower 90%   higher 90%
Photon index: -1.11132     ( -0.561638   0.604743 )
Norm@50keV  : 4.05151E-03    ( -0.00128365   0.00126821 )
------------------------------------------------------------
#Fit statistic : Chi-Squared =          64.03 using 59 PHA bins.
# Reduced chi-squared =          1.123 for     57 degrees of freedom
# Null hypothesis probability =   2.435193e-01

Photon flux (15-150 keV)    in 1 sec: 0.470476 ( -0.152803  0.154573 ) ph/cm2/s
Energy fluence (15-150 keV)             : 4.22124e-08 ( -1.40188e-08  1.42267e-08 ) ergs/cm2
Cutoff power-law model
Time interval is from   30.600 sec. to   31.600 sec.
Spectral model in the cutoff power-law:
------------------------------------------------------------
Parameters  : value       lower 90%   higher 90%
Photon index: -0.794811     ( 0.794797   3.03108 )
Epeak [keV] : 224.527      ( -224.519 -224.519 )
Norm@50keV  : 5.55475E-03    ( -0.00269529   0.0778375 )
------------------------------------------------------------
#Fit statistic : Chi-Squared =          63.96 using 59 PHA bins.
# Reduced chi-squared =          1.142 for     56 degrees of freedom
# Null hypothesis probability =   2.172477e-01

Photon flux (15-150 keV)    in 1 sec: 0.463216 ( -0.160221  0.155548 ) ph/cm2/s
Energy fluence (15-150 keV)             : 4.1686e-08 ( -1.46638e-08  1.43904e-08 ) ergs/cm2
Time-resolved spectra
Distribution
T90 vs. Hardness ratio plot
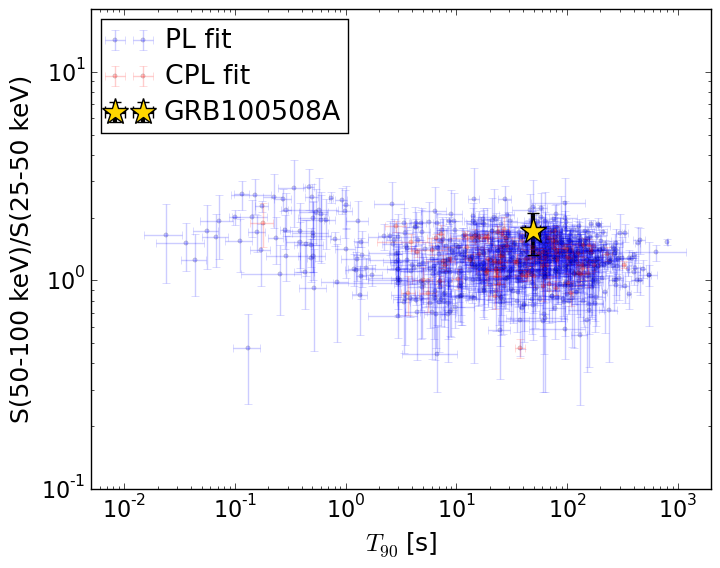
T90                                   = 49.26 sec.
Hardness ratio (energy fluence ratio) = 1.71913533913
S(15-50 keV) vs. S(50-150 keV) plot
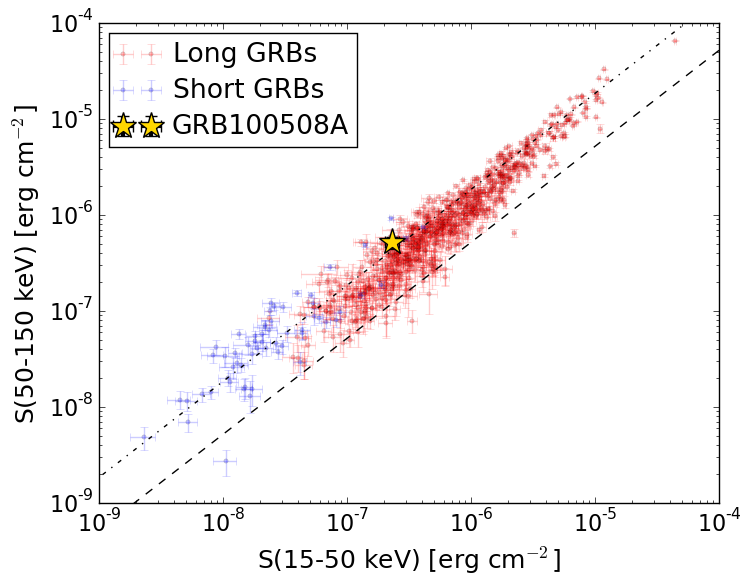
S(15-50 keV)  = 2.3208917e-07
S(50-150 keV) = 5.176788e-07
The dash-dotted line and the dashed line traces the fluences calculated from the Band function with Epeak = 15 and 150 keV, respectively. Both lines assume a canonical values of alpha = -1 and beta = -2.5.
Mask shadow pattern
IMX = 6.757725958994587E-01, IMY = 5.611813211728716E-02
Spacecraft aspect plot

Bright source in the pre-burst/pre-slew/post-slew images
Pre-burst image of 15-350 keV band
Time interval of the image:
-239.000000 -1.532000

# RAcent  DECcent POSerr Theta    Phi  PeakCts   SNR AngSep     Name
#  [deg]    [deg]    ['] [deg]  [deg]                   [']
337.0908 -40.8013    2.9  50.8  153.9   3.2039   4.0 ------	UNKNOWN
 25.1188 -52.0420    2.5  23.8  116.4   1.0755   4.6 ------	UNKNOWN
 85.1303   0.2865    2.5  53.0  -23.6   2.4903   4.5 ------	UNKNOWN
Pre-slew background subtracted image of 15-350 keV band
Time interval of the image:
-1.532000 58.376000

# RAcent  DECcent POSerr Theta    Phi  PeakCts   SNR AngSep     Name
#  [deg]    [deg]    ['] [deg]  [deg]                   [']
 15.4628 -45.2482    2.4  23.9  139.5   0.4783   4.8 ------	UNKNOWN
 76.2624 -20.7385    1.1  34.1   -4.7   1.1213  10.8 ------	UNKNOWN
  2.2354   5.0298    2.4  50.7 -138.1   1.8441   4.7  330.2	UNKNOWN
Post-slew image of 15-350 keV band
Time interval of the image:
131.500590 963.062600

# RAcent  DECcent POSerr Theta    Phi  PeakCts   SNR AngSep     Name
#  [deg]    [deg]    ['] [deg]  [deg]                   [']
 83.6215  22.0205    0.3  43.3  -38.7  33.6821  34.2    0.7	Crab
 93.0113  -1.3419    3.5  25.3   -6.4   1.6893   3.4 ------	UNKNOWN