Analysis Summary
Notes:
- 1) No attempt has been made to eliminate the non-significant decimal places.
- 2) This batgrbproduct analysis is done using the HEASARC data.
- 3) This batgrbproduct analysis is using the flight position for the mask-weighting calculation.
======================================================================
BAT GRB EVENT DATA PROCESSING REPORT
Process Script Ver: batgrbproduct v2.46
Process Start Time: Fri Jan 17 18:15:05 EST 2014
Host Name: batevent1
Current Working Dir: /local/data/batevent/batevent_reproc/trigger423184
======================================================================
Trigger: 00423184 Segment: 000
BAT Trigger Time: 296593244.352 [s; MET]
Trigger Stop: 296593271.232 [s; MET]
UTC: 2010-05-26T19:00:38.517680 [includes UTCF correction]
Where From?: TDRSS position message
BAT
RA: 0.699890609018591 Dec: -37.9023721389102 [deg; J2000]
Catalogged Source?: NO
Point Source?: YES
GRB Indicated?: YES [ by BAT flight software ]
Image S/N Ratio: 6.89
Image Trigger?: NO
Rate S/N Ratio: 6.92820323027551 [ if not an image trigger ]
Image S/N Ratio: 6.89
Analysis Position: [ source = BAT ]
RA: 0.699890609018591 Dec: -37.9023721389102 [deg; J2000]
Refined Position: [ source = BAT pre-slew burst ]
RA: 0.728184823810135 Dec: -37.9243943086205 [deg; J2000]
{ 00h 02m 54.8s , -37d 55' 27.8" }
+/- 2.14847245811105 [arcmin] (estimated 90% radius based on SNR)
+/- 0.871128547931319 [arcmin] (formal 1-sigma fit error)
SNR: 10.201105766198
Angular difference between the analysis and refined position is 1.881426 arcmin
Partial Coding Fraction: 0.953125 [ including projection effects ]
Duration
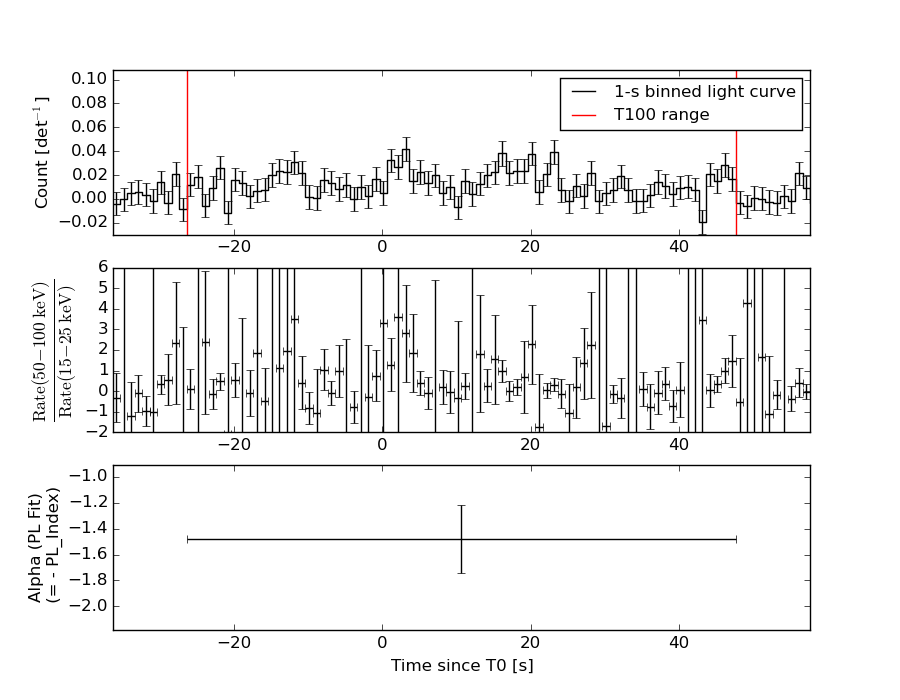
T90: 67 +/- 15.2643375224737
Measured from: -22.3519999980927
to: 44.6480000019073 [s; relative to TRIGTIME]
T50: 29 +/- 11.3137084989848
Measured from: -7.35199999809265
to: 21.6480000019073 [s; relative to TRIGTIME]
Fluence
Peak Flux (peak 1 second)
Measured from: 2.64800000190735
to: 3.64800000190735 [s; relative to TRIGTIME]
Total Fluence
Measured from: -26.3519999980927
to: 47.6480000019073 [s; relative to TRIGTIME]
Band 1 Band 2 Band 3 Band 4
15-25 25-50 50-100 100-350 keV
Total 0.262219 0.351036 0.230734 0.111955
0.044564 0.045869 0.041291 0.037994 [error]
Peak 0.006435 0.012745 0.018075 0.004518
0.005114 0.005403 0.004997 0.004604 [error]
[ fluence units of on-axis counts / fully illuminated detector ]
======================================================================
====== Table of the duration information =============================
Value tstart tstop
T100 74.000 -26.352 47.648
T90 67.000 -22.352 44.648
T50 29.000 -7.352 21.648
Peak 1.000 2.648 3.648
====== Spectral Analysis Summary =====================================
Model : spectral model: simple power-law (PL) and cutoff power-law (CPL)
Ph_index : photon index: E^{Ph_index}
Ph_90err : 90% error of the photon index
Epeak : Epeak in keV
Epeak_90err: 90% error of Epeak
Norm : normalization at 50 keV in both the PL model and CPL model
Nomr_90err : 90% error of the normalization
chi2 : Chi-Squared
dof : degree of freedo
=== Time-averaged spectral analysis ===
(Best model with acceptable fit: PL)
Model Ph_index Ph_90err_low Ph_90err_hi Epeak Epeak_90err_low Epeak_90err_hi Norm Nomr_90err_low Norm_90err_hi chi2 dof
PL -1.478 -0.267 0.263 - - - 7.56e-04 -1.20e-04 1.18e-04 58.160 57
CPL -1.303 N/A N/A 181.786 N/A N/A 9.43e-04 N/A N/A 58.070 56
=== 1-s peak spectral analysis ===
(Best model with acceptable fit: N/A)
Model Ph_index Ph_90err_low Ph_90err_hi Epeak Epeak_90err_low Epeak_90err_hi Norm Nomr_90err_low Norm_90err_hi chi2 dof
PL -0.695 -0.751 0.911 - - - 2.52e-03 -1.15e-03 1.03e-03 46.800 57
CPL -0.424 0.424 10.411 379.062 -379.062 -379.062 3.20e-03 -1.71e-03 1.05e+01 46.820 56
=== Fluence/Peak Flux Summary ===
Model Band1 Band2 Band3 Band4 Band5 Total
15-25 25-50 50-100 100-350 15-150 15-350 keV
Fluence PL 7.00e-08 1.30e-07 1.87e-07 5.69e-07 5.33e-07 9.57e-07 erg/cm2
90%_error_low -1.63e-08 -1.96e-08 -3.95e-08 -2.17e-07 -9.37e-08 -2.56e-07 erg/cm2
90%_error_hi 1.71e-08 1.95e-08 3.95e-08 2.96e-07 9.61e-08 3.23e-07 erg/cm2
Peak flux PL 4.83e-02 7.88e-02 9.74e-02 2.38e-01 2.92e-01 4.63e-01 ph/cm2/s
90%_error_low -3.62e-02 -7.88e-02 -3.85e-02 -1.60e-01 -1.14e-01 -1.94e-01 ph/cm2/s
90%_error_hi 5.60e-02 4.44e-02 3.74e-02 3.36e-01 1.16e-01 2.85e-01 ph/cm2/s
Fluence CPL 6.87e-08 1.33e-07 1.88e-07 4.11e-07 5.22e-07 8.01e-07 erg/cm2
90%_error_low -1.83e-08 -2.21e-08 -4.11e-08 -3.36e-07 -1.13e-07 -3.62e-07 erg/cm2
90%_error_hi 1.61e-08 2.65e-08 4.12e-08 2.12e-07 1.05e-07 2.41e-07 erg/cm2
Peak flux CPL 4.87e-02 7.93e-02 9.74e-02 2.40e-01 2.92e-01 4.63e-01 ph/cm2/s
90%_error_low N/A N/A -3.84e-02 -2.40e-01 -1.44e-01 -4.63e-01 ph/cm2/s
90%_error_hi N/A N/A 6.42e-02 3.26e-01 1.15e-01 2.78e-01 ph/cm2/s
======================================================================
Image
Pre-slew 15.0-350.0 keV image (Event data)
#   RAcent    DECcent   POSerr    Theta     Phi              Peak Cts       SNR   Name
    0.7282   -37.9244   0.0189    10.3333   123.4695         1.0024224     10.201 TRIG_00423184

Foreground time interval of the image:
-26.352  47.648 (delta_t =  74.000 [sec])
Background time interval of the image:
-502.352 -382.288 (delta_t = 120.064 [sec])
-239.352 -26.352 (delta_t = 213.000 [sec])
Light Curves
Note: The mask-weighted lightcurves have units of either count/det or counts/sec/det, where a det is 0.4 x 0.4 = 0.16 sq cm.
Full-time range; 1 s binning
Other quick-look light curves:
- 64 ms binning (zoomed)
- 16 ms binning (zoomed)
- 8 ms binning (zoomed)
- 2 ms binning (zoomed)
- SN=5 or 10 s binning (full-time range)
- Raw light curve
Spectra
- 64 ms binning (zoomed)
- 16 ms binning (zoomed)
- 8 ms binning (zoomed)
- 2 ms binning (zoomed)
- SN=5 or 10 s binning (full-time range)
- Raw light curve
Spectra
Notes:
- 1) The fitting includes the systematic errors.
- 2) When the burst includes telescope slew time periods, the fitting uses an average response file made from multiple 5-s response files through out the slew time plus single time preiod for the non-slew times, and weighted by the total counts in the corresponding time period using addrmf. An average response file is needed becuase a spectral fit using the pre-slew DRM will introduce some errors in both a spectral shape and a normalization if the PHA file contains a lot of the slew/post-slew time interval.
- 3) For fits to more complicated models (e.g. a power-law over a cutoff power-law), the BAT team has decided to require a chi-square improvement of more than 6 for each extra dof.
Time averaged spectrum fit using the average DRM
Power-law model
Time interval is from  -26.352 sec. to   47.648 sec.

Spectral model in power-law:
------------------------------------------------------------
Parameters  : value       lower 90%   higher 90%
Photon index: -1.47839     ( -0.267109   0.262726 )
Norm@50keV  : 7.56398E-04    ( -0.000120059   0.000118062 )
------------------------------------------------------------
#Fit statistic : Chi-Squared =          58.16 using 59 PHA bins.
# Reduced chi-squared =          1.020 for     57 degrees of freedom
# Null hypothesis probability =   4.322053e-01

Photon flux (15-150 keV)    in 74 sec: 9.38922E-02 ( -0.0138288  0.0138328 ) ph/cm2/s
Energy fluence (15-150 keV)             : 5.32993e-07 ( -9.36929e-08  9.61245e-08 ) ergs/cm2
Cutoff power-law model
Time interval is from  -26.352 sec. to   47.648 sec.
Spectral model in the cutoff power-law:
------------------------------------------------------------
Parameters  : value       lower 90%   higher 90%
Photon index: -1.30305     (       )
Epeak [keV] : 181.786      (   )
Norm@50keV  : 9.42973E-04    (     )
------------------------------------------------------------
#Fit statistic : Chi-Squared =          58.07 using 59 PHA bins.
# Reduced chi-squared =          1.037 for     56 degrees of freedom
# Null hypothesis probability =   3.988145e-01

Photon flux (15-150 keV)    in 74 sec: 9.31837E-02 ( -0.0144272  0.0071883 ) ph/cm2/s
Energy fluence (15-150 keV)             : 5.22086e-07 ( -1.12804e-07  1.04589e-07 ) ergs/cm2
1-s peak spectrum fit
Power-law model
Time interval is from    2.648 sec. to    3.648 sec.

Spectral model in power-law:
------------------------------------------------------------
Parameters  : value       lower 90%   higher 90%
Photon index: -0.694609     ( -0.751056   0.911412 )
Norm@50keV  : 2.52370E-03    ( -0.00114544   0.00103294 )
------------------------------------------------------------
#Fit statistic : Chi-Squared =          46.80 using 59 PHA bins.
# Reduced chi-squared =         0.8210 for     57 degrees of freedom
# Null hypothesis probability =   8.304583e-01

Photon flux (15-150 keV)    in 1 sec: 0.291839 ( -0.114466  0.116347 ) ph/cm2/s
Energy fluence (15-150 keV)             : 3.0883e-08 ( -1.24774e-08  1.27093e-08 ) ergs/cm2
Cutoff power-law model
Time interval is from    2.648 sec. to    3.648 sec.
Spectral model in the cutoff power-law:
------------------------------------------------------------
Parameters  : value       lower 90%   higher 90%
Photon index: -0.68612     ( 0.44179   10.4284 )
Epeak [keV] : 9997.86      ( -9997.96 -9997.96 )
Norm@50keV  : 2.54290E-03    ( -0.00105818   10.4617 )
------------------------------------------------------------
#Fit statistic : Chi-Squared =          46.80 using 59 PHA bins.
# Reduced chi-squared =         0.8357 for     56 degrees of freedom
# Null hypothesis probability =   8.046751e-01

Photon flux (15-150 keV)    in 1 sec: 0.292206 ( -0.14357  0.114931 ) ph/cm2/s
Energy fluence (15-150 keV)             : 3.08994e-08 ( -1.05959e-08  1.15538e-08 ) ergs/cm2
Time-resolved spectra
Distribution
T90 vs. Hardness ratio plot
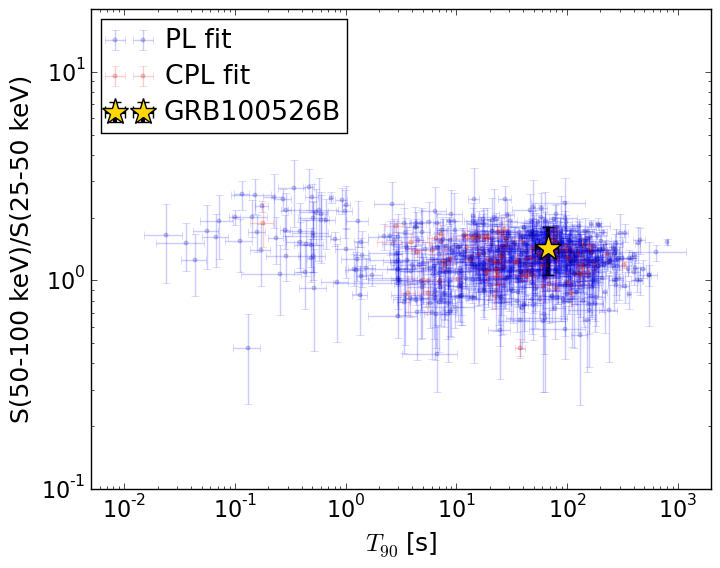
T90                                   = 67.0 sec.
Hardness ratio (energy fluence ratio) = 1.43558829326
S(15-50 keV) vs. S(50-150 keV) plot
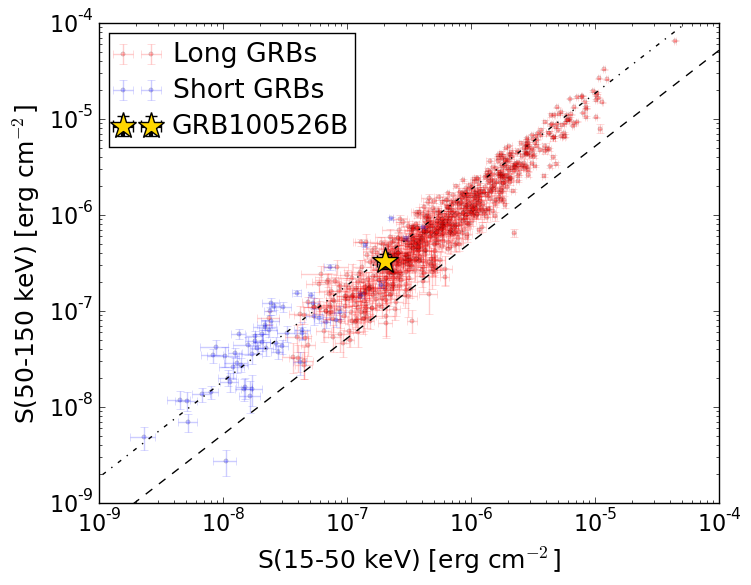
S(15-50 keV)  = 2.0044959e-07
S(50-150 keV) = 3.32541e-07
The dash-dotted line and the dashed line traces the fluences calculated from the Band function with Epeak = 15 and 150 keV, respectively. Both lines assume a canonical values of alpha = -1 and beta = -2.5.
Mask shadow pattern
IMX = -1.005538939088317E-01, IMY = -1.520964210415964E-01
Spacecraft aspect plot
Bright source in the pre-burst/pre-slew/post-slew images
Pre-burst image of 15-350 keV band
Time interval of the image:
-502.352000 -382.288300
-239.352000 -26.352000

# RAcent  DECcent POSerr Theta    Phi  PeakCts   SNR AngSep     Name
#  [deg]    [deg]    ['] [deg]  [deg]                   [']
334.6260 -64.0169    2.7  35.1   67.5   2.0803   4.2 ------	UNKNOWN
353.5620 -48.7015    2.9  18.3   85.3   1.0272   4.0 ------	UNKNOWN
340.9674   6.9398    3.0  54.1  177.0   3.3571   3.8 ------	UNKNOWN
 92.1694 -47.2967    3.7  56.1  -14.5   2.7084   3.2 ------	UNKNOWN
Pre-slew background subtracted image of 15-350 keV band
Time interval of the image:
-26.352000 47.648000

# RAcent  DECcent POSerr Theta    Phi  PeakCts   SNR AngSep     Name
#  [deg]    [deg]    ['] [deg]  [deg]                   [']
332.9348 -73.6793    2.1  41.0   54.9   1.6699   5.6 ------	UNKNOWN
  0.7282 -37.9244    1.1  10.3  123.5   1.0023  10.2 ------	UNKNOWN
  8.6081 -43.3610    2.4   6.9   72.0   0.4364   4.8 ------	UNKNOWN
 65.8278 -28.6744    2.3  43.9  -47.3   1.1334   5.0 ------	UNKNOWN
 68.4253 -24.4890    3.0  47.9  -50.9   1.5914   3.9 ------	UNKNOWN
Post-slew image of 15-350 keV band
Time interval of the image:
365.148610 962.774500

# RAcent  DECcent POSerr Theta    Phi  PeakCts   SNR AngSep     Name
#  [deg]    [deg]    ['] [deg]  [deg]                   [']
 83.6387  22.0189    0.3  28.7  -99.5  22.9499  38.0    0.4	Crab
120.4632 -25.1829    3.0  47.1  156.5   4.7194   3.9 ------	UNKNOWN
101.8817 -31.0663    3.9  54.1  177.3   5.0517   3.0 ------	UNKNOWN
 80.2306  33.8549    3.2  32.6  -76.6   2.6892   3.6 ------	UNKNOWN
 72.8997 -13.6641    2.6  54.0 -143.2  10.7516   4.4 ------	UNKNOWN
 70.5453  15.1678    3.2  42.1 -107.2   6.5753   3.6 ------	UNKNOWN